HAL Id: hal-02506039
https://hal.archives-ouvertes.fr/hal-02506039
Submitted on 12 Mar 2020
HAL is a multi-disciplinary open access
archive for the deposit and dissemination of
sci-entific research documents, whether they are
pub-lished or not. The documents may come from
teaching and research institutions in France or
abroad, or from public or private research centers.
L’archive ouverte pluridisciplinaire HAL, est
destinée au dépôt et à la diffusion de documents
scientifiques de niveau recherche, publiés ou non,
émanant des établissements d’enseignement et de
recherche français ou étrangers, des laboratoires
publics ou privés.
offshore wind turbines
Eleni Stavropoulou, Christophe Dano, Marc Boulon
To cite this version:
Eleni Stavropoulou, Christophe Dano, Marc Boulon. Experimental investigation of the mechanical
behaviour of soft carbonate rock/grout interfaces for the design of offshore wind turbines. E3S Web
of Conferences, EDP Sciences, 2019, 92, pp.13006. �10.1051/e3sconf/20199213006�. �hal-02506039�
Experimental investigation of the mechanical behaviour of
soft carbonate rock/grout interfaces for the design of offshore
wind turbines
Eleni Stavropoulou1,∗, Christophe Dano1, and Marc Boulon1
1Univ. Grenoble Alpes, CNRS, Grenoble INP, 3SR, F-38000, Grenoble, France
Abstract. Since a few years, in France, the development and construction of offshore wind farms in different sites of the country is investigated. The wind turbines will be installed in soft carbonate rock for-mations (calcarenite, limestone), the mechanical properties of which can vary in a significant way according to the location of the site. Once installed, the bored piles will be sealed with grout in the hosting rock. It is well known that the mechanical behaviour of piles is mainly governed by the behaviour of the interface at the contact between the structure and the hosting rock. The study of the mechanical behaviour of these interfaces, being the weakest points in terms of mechanical resistance, is of great importance for the im-provement of the design methods of such infrastructures. The shear response of the rock/grout interface is studied with laboratory experiments in the 3SR lab (Grenoble). The interface’s mechanical properties are characterised by a series of shear tests under Constant Normal Stiffness (CNS), these conditions being the most representative of the in-situ conditions. Interface samples of a roughness representative of the in-situ drilling traces, are tested under different levels of applied normal stiffness. The shear response is studied for both monotonic and cyclic shear paths, while all tests are performed under wet conditions. The failure mechanisms are explored, taking into account the contrasting mechanical properties of the two materials composing the interface, as well as, the evolution of the geometrical profile of the interface. The correlation between roughness and the mechanical response of the interface is investigated and the importance of an existing roughness is discussed.
1 Introduction
The development and construction of offshore wind farms in soft carbonate rock formations is investigated in differ-ent sites of northern France. Once installed, the piles of the wind turbines will be sealed with grout in the hosting rock. According to the location of the site, the mechanical prop-erties of the rock (calcarenite, limestone) can vary in a sig-nificant way. Taking into account the contrasting proper-ties of the sealing grout with these of the hosting rock, the study of the mechanical behaviour of the rock/grout inter-face in shear, being the weakest point in terms of mechan-ical resistance, is of great importance for the improvement of the design methods for offshore wind turbine founda-tions.
Such engineering problems require a study representa-tive of the in-situ conditions, where the normal stress act-ing on the interface may vary duract-ing shearact-ing, and any di-lation of the interface may be constrained by the confined environment formed across it, by the hosting rock mass (see Figure 1). Shear tests under constant normal stiffness (CNS) are, thus, considered by many authors as more ap-propriate for the characterisation of the behaviour of these interfaces (Heuze, 1979 [1], Leichnitz, 1985 [2], Johnston et al., 1987 [3], Seidel and Haberfield, 2002 [4]). The CNS
∗e-mail:eleni.stavropoulou@3sr-grenoble.fr
boundary condition is usually simulated by a spring with a normal stiffness kn =dσn/dun, where dσnand dun are
the variation of normal stress and normal displacement, respectively.
In addition to the boundary normal stiffness imposed by the surrounding rock mass, other parameters can affect the shear behaviour of rock interfaces such as the inter-face’s surface roughness, the level of initial applied nor-mal stress or the presence of infill (gouge) material with water in the joint interface. Even though a considerable amount of work has been conducted to describe how these factors affect the shear behaviour of joints under more con-ventional conditions (shearing under constant normal load – CNL: Ladanyi and Archambault, 1969 [5], Barton and Choubey, 1977 [6], Hutson and Dowding, 1990 [7], In-draratna and Buddhima, 2010 [8], Tatone and Grasselli, 2015 [9]), only a few studies with limited experimental data and analysis on the shear response of interfaces under CNS conditions exist (Seidel and Collingwood, 2001 [10], Indraratna et al. [11]).
In this paper, the shear behaviour of a rough lime-stone/grout interface is studied with lab-scale shear tests under constant normal stiffness in wet conditions. An ini-tial characterisation of the interface takes place with a se-ries of monotonic tests under different levels of applied normal stiffness, followed by the investigation of the shear
equivalent two-dimensional model after displacement
(d) σn
σn
equivalent two-dimensional model before displacement
(c)
pile after displacement (b) pile before displacement
(a) σn = φ (kn, un) σn σn σn σn un τ τ un
Pile and socket
Pile dia.,D Socket dia., D + ΔDPile dia.,D
Rough wall of rock socket
Rock Concrete Concrete pile
Fig. 1. Idealised displacement of pile socketed in rock (after Johnston et al., 1987 [3])
response under cyclic loading. The failure mechanisms are explored, taking into account the contrasting mechanical properties of the two materials composing the interface, as well as, the post-shear geometrical profile of the interface.
2 Experimental campaign
The mechanical behaviour of the limestone/grout interface is investigated with CNS shear tests under monotonic and cyclic loading. All tested interfaces have the same rough-ness, corresponding to the traces of the drilling tool in-situ. As Nam and Vipulanandan (2008) [12] suggested, roughness can be represented by a regular saw-tooth with a
chord length 2Laand an asperity height ∆r corresponding
to a roughness angle θ◦according to the used drilling tool. Based on these recommendations, triangular asperities of
roughness angle θ = 5.7◦ are chosen for the rock
speci-mens, corresponding to an asperity height ∆r = 0.5 mm
and a segment length 2La=10 mm.
The interface samples are moulded in two half shear boxes which are kept apart by a 10 mm thick plexiglas plate. The rock sample, previously placed in water, is sealed in the shear box with cement. The removal of the plate leaves a free interface of 10 mm height. The interface is continuously (i.e. during preparation, consolidation and shearing) maintained in imbibed conditions with the aid of a round membrane acting as water reservoir. However, a fully saturated state can not be achieved at atmospheric pressure, thus, the term wet is preferred to saturated. All
shear tests are performed, using the BCR3D shear box de-vice (Boulon, 1995 [13]). This shear dede-vice applies a sym-metrical and opposite shear displacement on the joint’s active part, limiting the relative rotation between the two walls of the interface. The BCR3D is composed by three orthogonal loading axes, each one independent of the oth-ers: a normal (Z) and two parallel (X and Y) to the in-terface plane axes, all three controlled either in force or displacement.
In the case of pile foundations, the stiffness normal to the interface is described as a function of the shear modu-lus Grock, of the hosting rock mass and the radius r of the
pile (Boulon et al.,1986 [14]): kn= 2Grock
rpile (1)
The measured shear modulus of the tested lime-stone with the minimum possible radius of the pile give according to Equation 1, a maximum normal stiffness kn,max = 2500 kPa/mm. Thus, shear tests under three different values of imposed normal stiffness are
consid-ered with kn = 500 kPa/mm, kn = 1500 kPa/mm and
kn = 2500 kPa/mm.
2.1 Monotonic shear tests
The mechanical response in shear of two types of inter-faces is studied and compared in these series of mono-tonic tests: an unbonded rock/rock interface and a bonded rock/grout interface (grout cast on top of the rock free sur-face). Based on the asperities geometry, the interfaces have been tested following the shear path presented in Fig-ure 2. The principle behind this path, involves a first ap-plication of shear displacement up to 85% of the segment
length 2La , i.e. past the asperities peak. Then, two
one-way cycles are performed, +85% 2La → +25% 2La →
+85% 2La, i.e. back and forth the asperities peak,
fol-lowed by a long last shearing towards the opposite direc-tion (−85% 2La). 0 200 400 600 800 1000 1200 1400 1600 1800 −10 −8 −6 −4 −2 0 2 4 6 8 10 shea r displacement (mm) 1st cycle 3rd cycle 2nd cycle data point -85% 2La +25% 2La +85% 2La
Fig. 2. Shear path of the rock/rock and rock/grout interfaces as a function of the asperities length
Typical results of a rock/grout interface are pre-sented in Figure 3. This interface sample, tested under
kn = 1500 kPa/mm, presents a high initial shear
resis-tance with shear displacement which then decreases dur-ing the followdur-ing cycles of shear. In terms of normal dis-2
equivalent two-dimensional model after displacement
(d) σn
σn
equivalent two-dimensional model before displacement
(c)
pile after displacement (b) pile before displacement
(a) σn = φ (kn, un) σn σn σn σn un τ τ un
Pile and socket
Pile dia.,D Socket dia., D + ΔDPile dia.,D
Rough wall of rock socket
Rock Concrete Concrete pile
Fig. 1. Idealised displacement of pile socketed in rock (after Johnston et al., 1987 [3])
response under cyclic loading. The failure mechanisms are explored, taking into account the contrasting mechanical properties of the two materials composing the interface, as well as, the post-shear geometrical profile of the interface.
2 Experimental campaign
The mechanical behaviour of the limestone/grout interface is investigated with CNS shear tests under monotonic and cyclic loading. All tested interfaces have the same rough-ness, corresponding to the traces of the drilling tool in-situ. As Nam and Vipulanandan (2008) [12] suggested, roughness can be represented by a regular saw-tooth with a
chord length 2Laand an asperity height ∆r corresponding
to a roughness angle θ◦according to the used drilling tool. Based on these recommendations, triangular asperities of
roughness angle θ = 5.7◦ are chosen for the rock
speci-mens, corresponding to an asperity height ∆r = 0.5 mm
and a segment length 2La =10 mm.
The interface samples are moulded in two half shear boxes which are kept apart by a 10 mm thick plexiglas plate. The rock sample, previously placed in water, is sealed in the shear box with cement. The removal of the plate leaves a free interface of 10 mm height. The interface is continuously (i.e. during preparation, consolidation and shearing) maintained in imbibed conditions with the aid of a round membrane acting as water reservoir. However, a fully saturated state can not be achieved at atmospheric pressure, thus, the term wet is preferred to saturated. All
shear tests are performed, using the BCR3D shear box de-vice (Boulon, 1995 [13]). This shear dede-vice applies a sym-metrical and opposite shear displacement on the joint’s active part, limiting the relative rotation between the two walls of the interface. The BCR3D is composed by three orthogonal loading axes, each one independent of the oth-ers: a normal (Z) and two parallel (X and Y) to the in-terface plane axes, all three controlled either in force or displacement.
In the case of pile foundations, the stiffness normal to the interface is described as a function of the shear modu-lus Grock, of the hosting rock mass and the radius r of the
pile (Boulon et al.,1986 [14]): kn= 2Grock
rpile (1)
The measured shear modulus of the tested lime-stone with the minimum possible radius of the pile give according to Equation 1, a maximum normal stiffness kn,max = 2500 kPa/mm. Thus, shear tests under three different values of imposed normal stiffness are
consid-ered with kn = 500 kPa/mm, kn = 1500 kPa/mm and
kn = 2500 kPa/mm.
2.1 Monotonic shear tests
The mechanical response in shear of two types of inter-faces is studied and compared in these series of mono-tonic tests: an unbonded rock/rock interface and a bonded rock/grout interface (grout cast on top of the rock free sur-face). Based on the asperities geometry, the interfaces have been tested following the shear path presented in Fig-ure 2. The principle behind this path, involves a first ap-plication of shear displacement up to 85% of the segment length 2La, i.e. past the asperities peak. Then, two
one-way cycles are performed, +85% 2La → +25% 2La →
+85% 2La, i.e. back and forth the asperities peak,
fol-lowed by a long last shearing towards the opposite direc-tion (−85% 2La). 0 200 400 600 800 1000 1200 1400 1600 1800 −10 −8 −6 −4 −2 0 2 4 6 8 10 shea r displacement (mm) 1st cycle 3rd cycle 2nd cycle data point -85% 2La +25% 2La +85% 2La
Fig. 2. Shear path of the rock/rock and rock/grout interfaces as a function of the asperities length
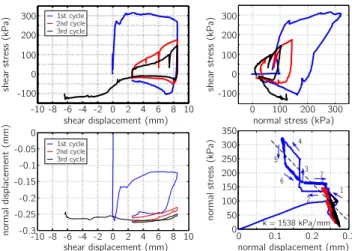
Typical results of a rock/grout interface are pre-sented in Figure 3. This interface sample, tested under
kn = 1500 kPa/mm, presents a high initial shear
resis-tance with shear displacement which then decreases dur-ing the followdur-ing cycles of shear. In terms of normal
dis-placement, a significant increase is measured on the nor-mal axis, i.e. dilation during the first shearing, which then is almost negligible in the following cycles. A dilating sponse when shearing under constant normal stiffness re-sults to, as expected, an increase in the normal stress. The imposed normal stiffness is in average maintained constant during shearing, it’s worthy to mention however, that the accuracy of the shear device has been improved since the time of these series of monotonic tests.
shear displacement (mm) shea r stress (kP a) 0 -2 -4 -6 -8 shea r stress (kP a) no rmal stress (kP a) 1 2 3 4 5 6 7 k = 1538 kPa/mm 0 100 200 300
normal stress (kPa) 2 4 6 8 10 -100 0 100 200 300 no rmal displacemen t (mm)
shear displacement (mm) normal displacement (mm)
-100 0 100 200 300 0 100 200 300 50 150 250 350 0 -0.05 -0.1 -0.15 -0.2 -0.25 -0.3-10 10 0 0.1 0.2 0.3 1st cycle 2nd cycle 3rd cycle 1st cycle 2nd cycle 3rd cycle -10 0 -2 -4 -6 -8 2 4 6 8
Fig. 3. Results of a rock/grout interface tested in shear under
kn=1500 kPa/mm
The values of the calculated friction angle and the ap-parent cohesion are presented in Table 1 for both direc-tions of shear during the first cycle and for both rock/rock and rock/grout interfaces. Surprisingly, the friction angle is calculated somewhat higher for the rock/rock interface, even though the mechanical properties of the grout are importantly higher than these of the limestone, while for both interfaces the friction angle corresponding to shear-ing towards the opposite direction decreases. On the other hand, the apparent cohesion is three times higher for the rock/grout interface, indicating a different mode of fail-ure for the two types of interface. These values, describe two Mohr-Coulomb failure envelopes (for each direction of shear) which in the case of the rock/rock interface are quite symmetrical, unlike the rock/grout interface where the two envelopes are non-symmetrical.
φ+(◦) C+(kPa) φ−(◦) C−(kPa)
rock/rock 34.9 62.0 31.8 19.0
rock/grout 29.5 180.0 21.8 40.0
Table 1. Friction angle (φ) and apparent cohesion (C) calculated for the two opposite shearing directions during the
first cycle, for both rock/rock and rock grout interfaces
Looking at the state of the rock/grout interfaces after shearing (see Figure 4), in all cases a thick layer of lime-stone is found attached to the grout, while the initial regu-lar sawtooth roughness has disappeared. This means that failure occurs within the rock part and thus, the value of the calculated friction angle can now be explained given
that the geometry of the failure surface is no longer sim-ilar to the initial one. The state of the post shear surface of the rock/grout interface can also explain the high mea-sured cohesion, given the bonds developed at the interface during the casting of grout on the rough limestone surface. On the other hand, a rock/rock rough interface exhibits an apparent cohesion only due to its roughness.
Fig. 4. Post-shear state of two rock/grout interface samples
The post-shear surfaces are scanned with a laser device with a 0.2 mm resolution. In Figure 5, first the surface map of a rock sample before tested is presented, while a 2D profile is extracted along the shearing direction. Similarly the surface maps and 2D profiles of a rock/rock interface and a rock/grout interface after shearing are presented in the same figure. In the case of the rock/rock interface, the existence of the initial roughness is obvious, with the asperities presenting some damage, i.e. height decrease. Regarding the rock/grout interface, the post-shear surfaces are rather irregular, while the initial roughness cannot even be suspected. In this case, the creation of a main asperity is observed (bottom and right) which could be the reason behind the non-symmetrical modification of the mechani-cal response of this type of interface. The dependence of the final surface state to the asperities size together with the created adhesion of the interface is unknown, it could however give some more insight into the overall response. Finally, one can notice that the two rock/grout surfaces are not complementary as it would be expected. This is most likely due to the gouge (infilling material) created by the limestone’s damage which is distributed by the existing water. The samples are scanned once dried and thus, the wet limestone powder dries on the the rock surface and modifies to the final result.
After having established the monotonic shear response of the rock/grout interface and based on the calculated Mohr-Coulomb properties (friction angle and apparent co-hesion), a series of cyclic tests is designed and performed, the results of which are presented in the following section.
length (mm) 0 250 500 750 height (m m) 0 -0.5 -1.0 -1.5 -2.0 0.5 1.0 1.5 2.0 shear direction grout (800 x 800) mm (800 x 800) mm (700 x 700) mm rock rock rock (700 x 700) mm rock (760 x 760) mm Post-shea r rock/rock interface Post-shea r rock/grout interface
Initial rock sam
ple height (m m) 0 -0.5 -1.0 -1.5 -2.0 0.5 1.0 1.5 2.0 length (mm) 0 250 500 750 length (mm) 0 100 200 300 400 500 600 height (m m) 0 -0.5 -1.0 -1.5 -2.0 0.5 1.0 1.5 2.0 length (mm) 0 100 200300400500600 700 height (m m) 0 -0.5 -1.0 -1.5 -2.0 0.5 1.0 1.5 2.0 height (m m) 0 -0.5 -1.0 -1.5 -2.0 0.5 1.0 1.5 2.0 length (mm) 0 100 200 300 400 500 600 height higher lower height higher lower height higher lower
Fig. 5. Initial rock profile and surface profiles of a rock/rock and rock/grout interface after shearing under kn=1500 kPa/mm
2.2 Cyclic shear tests
In these series of CNS shear tests, rock/grout inter-face samples of the same roughness are tested under cyclic loading, always in wet conditions. The differ-ent performed tests take place under a normal stiffness
kn = 1500 kPa/mm and an initial normal stress
σn0 = 100 kPa, and include both two-way and
one-way shear tests, as shown in Figure 6. These shear tests are controlled in force under constant frequency and based on the shear strength calculated from the monotonic tests (τmax,CNS ≈ 310 kPa). The different values of average
shear stress (τave) and semi-amplitude (τcyc) are imposed.
It is clear that for values where τave, τcyc tend to τmax,CNS,
or τave τCNS,
τcyc
τmax,CNS tend to 1, i.e. the applied loading is
high and towards the calculated monotonic strength of the interface, failure is expected earlier compared to all other intermediate values of loadings.
τave/τmax,CNS 0 0.2 0.4 0.6 0.8 1 0 0.2 0.4 0.6 0.8 1 τcyc /τmax, CNS two-w ay one-w ay
Fig. 6. Program of cyclic tests with imposed normal stiffness
Some typical results are presented in Figures 7 and 8.
τave= 0, τcyc= 50% τmax;CNS
shea r displacement (mm) average value failure no rmal displacemen t (mm) contractant response average value cycle number average value no rmal stress (kP a) average value shea r stress (kP a)
Fig. 7. Evolution of stress and displacement along the normal and shear direction with the number of cycles
length (mm) 0 250 500 750 height (m m) 0 -0.5 -1.0 -1.5 -2.0 0.5 1.0 1.5 2.0 shear direction grout (800 x 800) mm (800 x 800) mm (700 x 700) mm rock rock rock (700 x 700) mm rock (760 x 760) mm Post-shea r rock/rock interface Post-shea r rock/grout interface
Initial rock sam
ple height (m m) 0 -0.5 -1.0 -1.5 -2.0 0.5 1.0 1.5 2.0 length (mm) 0 250 500 750 length (mm) 0 100 200 300 400 500 600 height (m m) 0 -0.5 -1.0 -1.5 -2.0 0.5 1.0 1.5 2.0 length (mm) 0 100200300400500 600700 height (m m) 0 -0.5 -1.0 -1.5 -2.0 0.5 1.0 1.5 2.0 height (m m) 0 -0.5 -1.0 -1.5 -2.0 0.5 1.0 1.5 2.0 length (mm) 0 100 200 300 400 500 600 height higher lower height higher lower height higher lower
Fig. 5. Initial rock profile and surface profiles of a rock/rock and rock/grout interface after shearing under kn=1500 kPa/mm
2.2 Cyclic shear tests
In these series of CNS shear tests, rock/grout inter-face samples of the same roughness are tested under cyclic loading, always in wet conditions. The differ-ent performed tests take place under a normal stiffness
kn = 1500 kPa/mm and an initial normal stress
σn0 = 100 kPa, and include both two-way and
one-way shear tests, as shown in Figure 6. These shear tests are controlled in force under constant frequency and based on the shear strength calculated from the monotonic tests (τmax,CNS ≈ 310 kPa). The different values of average
shear stress (τave) and semi-amplitude (τcyc) are imposed.
It is clear that for values where τave, τcyc tend to τmax,CNS,
or τave τCNS,
τcyc
τmax,CNS tend to 1, i.e. the applied loading is
high and towards the calculated monotonic strength of the interface, failure is expected earlier compared to all other intermediate values of loadings.
τave/τmax,CNS 0 0.2 0.4 0.6 0.8 1 0 0.2 0.4 0.6 0.8 1 τcyc /τmax, CNS two-w ay one-w ay
Fig. 6. Program of cyclic tests with imposed normal stiffness
Some typical results are presented in Figures 7 and 8.
τave= 0, τcyc= 50% τmax;CNS
shea r displacement (mm) average value failure no rmal displacemen t (mm) contractant response average value cycle number average value no rmal stress (kP a) average value shea r stress (kP a)
Fig. 7. Evolution of stress and displacement along the normal and shear direction with the number of cycles
Cycles of shear are performed up to failure, after which a large shearing is applied in order to examine the post-cyclic response of the interface. Figure 7 shows the evolu-tion of all measured parameters with the number of cycles (displacement and stress in both normal and shear direc-tions), together with the average value per cycle of each parameter. In this test, failure occurs on cycle No. 28 and the response of the interface is contractant, i.e. both normal stress and displacement decrease with the cycles. The evolution of normal stress with normal displacement is presented in Figure 8, with a normal stiffness maintained constant with an average value of 1500 kPa/mm.
normal displacement (mm)
no
rmal stress
(kP
a)
Fig. 8. Normal stiffness during the cyclic test
Taking into account the non-symmetrical response of the rock/grout interface in terms of shear response, it is in-teresting to have a look at the response of symmetric two-way cycling loading together with the monotonic Mohr-Coulomb failure envelopes (Figure 9). In the case of a
low cyclic loading τcyc =25%τmax,CNS, shearing towards
the “positive” direction involves values much lower than the calculated failure Mohr-Coulomb envelope. On the other hand, when shearing towards the “negative” direc-tion, the reached shear stress values are on the calculated failure envelope. Shearing towards different directions in-volves the activation of different parts of the interface, however, shearing towards values equal to the maximum strength in the negative direction should accelerate fail-ure. Even more, when shearing under higher cyclic
load-ing (τcyc = 50%τmax,CNS and τcyc = 75%τmax,CNS), the
maximum shear stress towards the negative direction is by far exceeded without failure after many cycles. This un-expected result shows a mechanical modification of the interface with cyclic loading, following a response that involves a shear translation of the monotonic failure en-velopes. The first application of shear leads to a break-down of the interface’s cohesion and thus the interface be-ing non-cohesive any more exhibits a more symmetrical shear response.
In the case of a 1-way cyclic test, where for example τave=25%τmax,CNS and τave=25%τmax,CNS, the variation
of stresses is well within the failure limits and thus, the number of cycles to failure is N>1000. During the last large shearing, the response stays always within the failure envelopes in both shearing directions. In this type of cyclic test, the variation of shear stress which is not symmetrical along the two opposite shearing directions, remains lower
shea r stress (kP a) shea r stress (kP a) shea r stress (kP a) 0 -100 100 200 300 400 500 400 300 200 100 -100 -200 -300 0 0 -100 100 200 300 400 500 400 300 200 100 -100 -200 -300
τave= 0, τcyc= 75% τmax,CNS
τave= 0, τcyc= 50% τmax,CNS
τave= 0, τcyc= 25% τmax,CNS
normal stress (kPa)
normal stress (kPa) normal stress (kPa)
0 0 -100 100 200 300 400 500 400 300 200 100 -100 -200 -300 0
Fig. 9. Shear stress response of symmetric two-way cycling load-ing tests (τave=0)
than the calculated monotonic shear strength during the cycles. Unlike the symmetric 2-way cyclic loading, this type of loading is “in favour” of the monotonic response which is followed closely but not exceeded, leading to a post-cyclic shear response that is in correspondence with the monotonic failure envelopes.
0 -100 100 200 300 400 500 400 300 200 100 -100 -200 -300
normal stress (kPa) 0
last big shearing all cycles 0 -100 100 200 300 400 500 400 300 200 100 -100 -200 -300
normal stress (kPa) 0
Fig. 10. Shear stress response with normal stress for a 1-way cyclic test of τave=25%τmax,CNS and τave=25%τmax,CNS
3 Conclusions
A series of monotonic and cyclic shear tests have been performed on limestone/grout rough interfaces under con-stant normal stiffness and in wet conditions. For a better understanding of the monotonic response, an additional study on the rock/rock interface has taken place. These monotonic tests reveal the different failure modes occur-ring to a bonded (rock/grout) and a unbonded interface
(rock/rock). In the case of the rock/grout interface, the failure surface occurs within the rock part in an irregu-lar way. From a macroscopic mechanical point of view the different rock/grout tests are consistent, for example in terms of measured friction angle, however the geometri-cal irregularity of their failure surface together with the created infilling material makes the correlation of these two aspects – mechanical and geometrical – rather com-plicated. When the rock/grout interface is tested in shear under cyclic loading, the response is not similar between the case of two-way cycles and one-way. The combination of the application of a shear load lower than the maximum shear strength of the interface together with the break-down of the initial cohesion of the interface during the first shearing, leads to a modification of the interface’s re-sponse. A one-way cyclic loading where the shear stresses do not reverse in sign is less damaging, unlike the two-way cycles which even though they are comparatively rare in-situ, they are the most commonly applied in laboratory test programs. Therefore, as observed during this cam-paign of cyclic shear tests, failure reached much earlier in a two-way cyclic test than in a one-way cyclic one. A follow-up of the interface’s geometrical evolution af-ter each cycle could allow a betaf-ter understanding of the observed mechanical modification. This would however involve opening of the interface and potentially additional damage, making the separation of all different parameters affecting its response even more complex. The considera-tion of different size asperities would be a logical first step for the investigation of a mechanical and geometrical cor-relation of this type of interface.
This work benefited from France Energies Marines and French National Research Agency (Investements for the Future) funds: ANR-10-IEED-0006-18.
References
[1] Heuze, F. E. "Dilatant effects of rock joints." 4th ISRM Congress. International Society for Rock Me-chanics and Rock Engineering, 1979.
[2] Leichnitz, W. "Mechanical properties of rock joints." International Journal of Rock Mechanics and Mining Sciences & Geomechanics Abstracts. Vol. 22. No. 5. Pergamon, 1985.
[3] Johnston, I. W., Lam, T. S. K., and Williams, A. F. "Constant normal stiffness direct shear testing for sock-eted pile design in weak rock." Geotechnique 37.1: 83-89 (1987).
[4] Seidel, J. P., and Haberfield, C. M. "A theoretical model for rock joints subjected to constant normal stiff-ness direct shear." International Journal of Rock Me-chanics and Mining Sciences 39.5 (2002): 539-553. [5] Ladanyi, B., and Archambault, G. "Simulation of
shear behavior of a jointed rock mass." The 11th US Symposium on Rock Mechanics (USRMS). American Rock Mechanics Association, 1969.
[6] Barton, N., and Choubey, V. "The shear strength of rock joints in theory and practice." Rock mechanics 10.1-2 (1977): 1-54.
[7] Hutson, R. W., and Dowding, C. H. "Joint asperity degradation during cyclic shear." International Journal of Rock Mechanics and Mining Sciences & Geome-chanics Abstracts. Vol. 27. No. 2. Pergamon, 1990. [8] Indraratna, B. "Effect of soil–infilled joints on the
sta-bility of rock wedges formed in a tunnel roof." Interna-tional Journal of Rock Mechanics and Mining Sciences 47.5 (2010): 739-751.
[9] Tatone, B. SA, and Grasselli, G. "Characterization of the effect of normal load on the discontinuity morphol-ogy in direct shear specimens using X-ray micro-CT." Acta Geotechnica 10.1 (2015): 31-54.
[10] Seidel, J. P., Collingwood, B. "A new socket rough-ness factor for prediction of rock socket shaft resis-tance." Canadian Geotechnical Journal 38.1 (2001): 138-153.
[11] Indraratna B, Welideniya H, Brown E. "A shear strength model for idealised infilled joints under con-stant normal stiffness." Géotechnique 2005; 55(3): 215-26.
[12] Nam, M. S., Vipulanandan S. "Roughness and unit side resistances of drilled shafts socketed in clay shale and limestone." Journal of geotechnical and geoenvi-ronmental engineering 134.9 (2008): 1272-1279. [13] Boulon, M. "A 3-d direct shear device for testing the
mechanical behaviour and the hydraulic conductivity of rock joints." Proc. Mechanics of Jointed and Faulted Rock. 1995.
[14] Boulon, M., C. Plytas, and P. Foray. "Comportement d’interface et prévision du frottement latéral le long des pieux et tirants d’ancrage." Revue française de géotech-nique 35 (1986): 31-48.
[15] Di Prisco, C. G., Muir Wood D. "Mechanical Behaviour of Soils Under Environmentallly-Induced Cyclic Loads." Vol. 534. Springer Science & Business Media, 2012.
![Fig. 1. Idealised displacement of pile socketed in rock (after Johnston et al., 1987 [3])](https://thumb-eu.123doks.com/thumbv2/123doknet/11563111.297074/3.892.87.435.114.578/fig-idealised-displacement-pile-socketed-rock-johnston-et.webp)