Université de Montréal
Narrative Generation by Associative Network Extraction from Real-life Temporal Data
par
Pierre-Luc Vaudry
Département d’informatique et de recherche opérationnelle Faculté des arts et des sciences
Thèse présentée
en vue de l’obtention du grade de Philosophiæ Doctor (Ph.D.) en informatique
Octobre 2016
c
RÉSUMÉ
Les données portant sur des événements abondent dans notre société technologique. Une façon intéressante de présenter des données temporelles réelles pour faciliter leur interpréta-tion est un récit généré automatiquement. La compréhension de récits implique la construcinterpréta-tion d’un réseau causal par le lecteur. Les systèmes de data-to-text narratifs semblent reconnaître l’importance des relations causales. Cependant, celles-ci jouent un rôle secondaire dans leurs planificateurs de document et leur identification repose principalement sur des connaissances du domaine.
Cette thèse propose un modèle d’interprétation assistée de données temporelles par généra-tion de récits structurés à l’aide d’un mélange de règles d’associagénéra-tion automatiquement extraites et définies manuellement. Les associations suggèrent des hypothèses au lecteur qui peut ainsi construire plus facilement une représentation causale des événements. Ce modèle devrait être applicable à toutes les données temporelles répétitives, comprenant de préférence des actions ou activités, telles que les données d’activités de la vie quotidienne.
Les règles d’association séquentielles sont choisies en fonction des critères de confiance et de signification statistique tels que mesurés dans les données d’entraînement. Les règles d’associa-tion basées sur les connaissances du monde et du domaine exploitent la similitude d’un certain aspect d’une paire d’événements ou des patrons causaux difficiles à détecter statistiquement.
Pour interpréter une période à résumer déterminée, les paires d’événements pour lesquels une règle d’association s’applique sont associées et certaines associations supplémentaires sont dérivées pour former un réseau associatif.
L’étape la plus importante du pipeline de génération automatique de texte (GAT) est la plani-fication du document, comprenant la sélection des événements et la structuration du document. Pour la sélection des événements, le modèle repose sur la confiance des associations séquen-tielles pour sélectionner les faits les plus inhabituels. L’hypothèse est qu’un événement qui est impliqué par un autre avec une probabilité relativement élevée peut être laissé implicite dans le texte.
les associations du début à la fin du texte. Il prend la forme d’un arbre couvrant sur le sous-réseau associatif précédemment sélectionné. Les associations qu’il contient sont sélectionnées en fonction de préférences de type d’association et de la distance temporelle relative. Le fil associatif ramifié est ensuite segmenté en paragraphes, phrases et syntagmes et les associations sont converties en relations rhétoriques.
L’étape de microplanification définit des patrons lexico-syntaxiques décrivant chaque type d’événement. Lorsque deux descriptions d’événement doivent être assemblées dans la même phrase, un marqueur discursif exprimant la relation rhétorique spécifiée est employé. Un évé-nement principal et un évéévé-nement principal précédent sont déterminés pour chaque phrase. Lorsque le parent de l’événement principal dans le fil associatif n’est pas l’événement principal précédent, un anaphorique est ajouté au marqueur discursif frontal de la phrase.
La réalisation de surface peut être effectuée en anglais ou en français grâce à des spécifica-tions lexico-syntaxiques bilingues et à la bibliothèque Java SimpleNLG-EnFr.
Les résultats d’une évaluation de la qualité textuelle montrent que les textes sont compré-hensibles et les choix lexicaux adéquats.
Mots clés: Génération automatique de textes, data-to-text, planification de document, récit, données temporelles, relation causale, règle d’association, séquence, événement, connais-sances du domaine.
ABSTRACT
Data about events abounds in our technological society. An attractive way of presenting real-life temporal data to facilitate its interpretation is an automatically generated narrative. Narrative comprehension involves the construction of a causal network by the reader. Narrative data-to-text systems seem to acknowledge causal relations as important. However, they play a secondary role in their document planners and their identification relies mostly on domain knowledge.
This thesis proposes an assisted temporal data interpretation model by narrative generation in which narratives are structured with the help of a mix of automatically mined and manually defined association rules. The associations suggest causal hypotheses to the reader who can thus construct more easily a causal representation of the events. This model should be applicable to any repetitive temporal data, preferably including actions or activities, such as Activity of Daily Living (ADL) data.
Sequential association rules are selected based on the criteria of confidence and statistical significance as measured in training data. World and domain knowledge association rules are based on the similarity of some aspect of a pair of events or on causal patterns difficult to detect statistically.
To interpret a specific period to summarize, pairs of events for which an association rule applies are associated. Some extra associations are then derived. Together the events and asso-ciations form an associative network.
The most important step of the Natural Language Generation (NLG) pipeline is document planning, comprising event selection and document structuring. For event selection, the model relies on the confidence of sequential associations to select the most unusual facts. The assump-tion is that an event that is implied by another one with a relatively high probability may be left implicit in the text.
The structure of the narrative is called the connecting associative thread because it allows the reader to follow associations from the beginning to the end of the text. It takes the form of a spanning tree over the previously selected associative sub-network. The associations it contains are selected based on association type preferences and relative temporal distance. The
connecting associative thread is then segmented into paragraphs, sentences, and phrases and the associations are translated to rhetorical relations.
The microplanning step defines lexico-syntactic templates describing each event type. When two event descriptions need to be assembled in the same sentence, a discourse marker expressing the specified rhetorical relation is employed. A main event and a preceding main event are determined for each sentence. When the associative thread parent of the main event is not the preceding main event, an anaphor is added to the sentence front discourse marker.
Surface realization can be performed in English or French thanks to bilingual lexico-syntactic specifications and the SimpleNLG-EnFr Java library.
The results of a textual quality evaluation show that the texts are understandable and the lexical choices adequate.
Keywords: Natural language generation, data-to-text, document planning, narrative, temporal data, causal relation, association rule, sequence, event, domain knowledge.
CONTENTS RÉSUMÉ . . . ii ABSTRACT . . . iv CONTENTS . . . vi LIST OF TABLES . . . ix LIST OF FIGURES . . . x LIST OF APPENDICES . . . xi
LIST OF INITIALISMS AND ACRONYMS . . . xii
ACKNOWLEDGMENTS . . . xiii
CHAPTER 1: INTRODUCTION . . . 1
CHAPTER 2: PREVIOUS WORK . . . 3
2.1 Narratology . . . 3
2.2 Psychology . . . 4
2.2.1 Causal Attribution in Everyday Life . . . 4
2.2.2 Narrative Comprehension . . . 4
2.3 History and Philosophy of Science . . . 5
2.4 Data Mining . . . 6
2.5 Natural Language Generation . . . 7
2.5.1 Fictional Narrative Generation . . . 8
2.5.2 Narrative Data-to-text . . . 9
2.5.3 Evaluation . . . 14
CHAPTER 3: ASSISTED TEMPORAL DATA INTERPRETATION MODEL . . . 16
3.1 Main Characteristics of the Model . . . 16
3.1.1 A Narrative Generation Model . . . 16
3.1.2 A Data-driven Model . . . 16
3.1.3 An Assisted Interpretation Model . . . 17
3.1.4 From Beginning to End . . . 19
3.2 Communicative Goal of the Generated Text . . . 20
3.3 Model Overview . . . 21
3.4 Applications . . . 21
3.4.1 Activities of Daily Living . . . 24
3.5 Activity of Daily Living Data-to-text Running Example . . . 24
3.6 Conclusion . . . 27
CHAPTER 4: ASSOCIATIVE NETWORK EXTRACTION . . . 28
4.1 Association Rules . . . 28
4.1.1 Sequential Association Rule Mining . . . 28
4.1.2 World and Domain Knowledge Rules . . . 33
4.2 Data Interpretation . . . 38
4.2.1 Rule Direction and Causal Interpretation . . . 38
4.2.2 Derived Associations . . . 39
4.3 Conclusion . . . 40
CHAPTER 5: NARRATIVE GENERATION . . . 42
5.1 Document Planning . . . 42
5.1.1 Event Selection . . . 42
5.1.2 Document Structuring . . . 44
5.2 Microplanning . . . 53
5.2.1 Description of a Single Event . . . 53
5.2.2 Combining Event Descriptions to Form a Sentence . . . 56
5.2.3 Combining Sentences to Form the Paragraphs of a Text . . . 57
5.3 Surface Realization . . . 58
5.4 Human Reading . . . 60
5.5 Conclusion . . . 60
CHAPTER 6: EVALUATION . . . 62
6.1 Intrinsic Evaluation of Text Quality by Non-expert Judges . . . 62
6.1.1 Method . . . 62
6.1.2 Results . . . 66
6.1.3 Comparison with Previous Temporal Data-to-text Evaluations . . . 66
6.2 Extrinsic Evaluation Designs . . . 68
6.2.1 Evaluation of Unusual Event Recall . . . 69
6.2.2 Task-based Evaluation with Domain Experts . . . 71
6.3 Conclusion . . . 72
CHAPTER 7: CONCLUSION . . . 73
7.1 Summary . . . 73
7.2 Future Work . . . 76
LIST OF TABLES
I The 30 ADL labels for user B on November 24, 2012 . . . 26
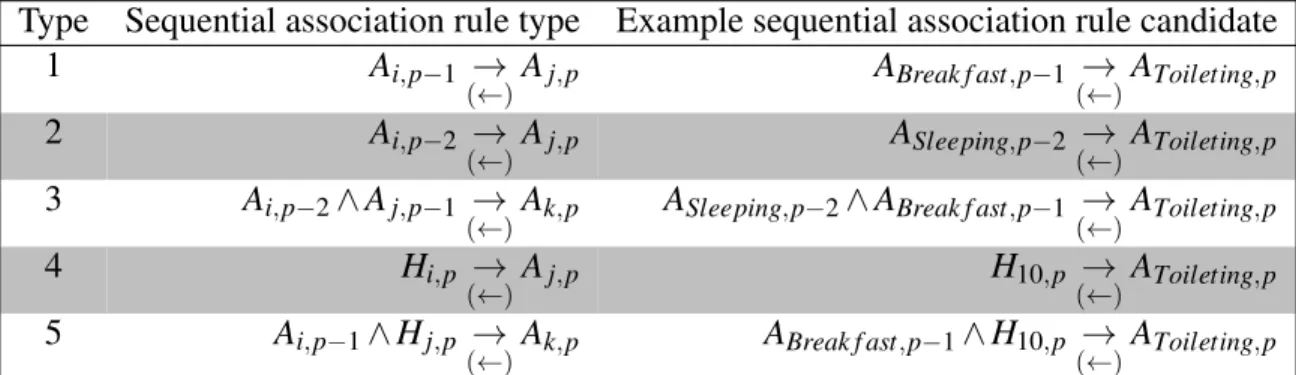
II Sequential association rule types and candidate examples . . . 30
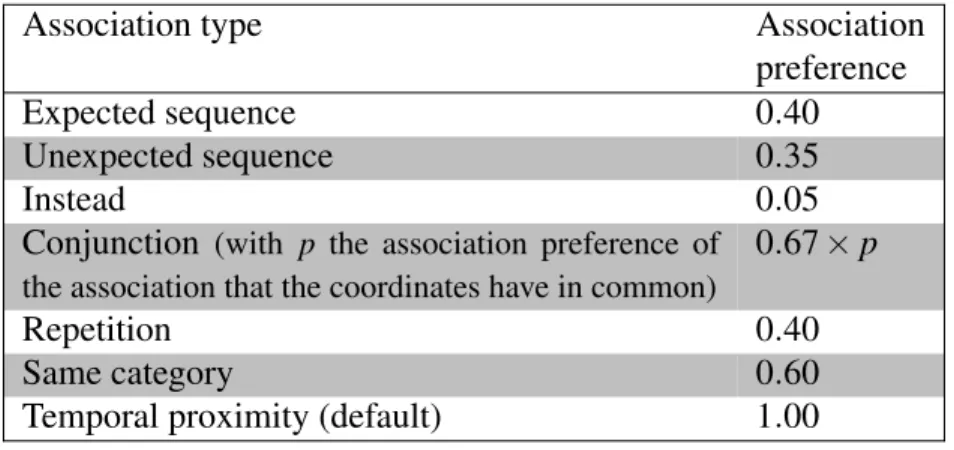
III Association preferences for each association type . . . 47
IV Rhetorical relation(s) and satellite for each association type . . . 53
V Example English and French event description lexico-syntactic templates used in the ADL example . . . 55
VI English and French intrasentential discourse markers used in the ADL example for each rhetorical relation . . . 56
VII English and French intersentential discourse markers used in the ADL example for each rhetorical relation . . . 58
LIST OF FIGURES
1 Assisted temporal data interpretation model . . . 22
2 English generated text example . . . 26
3 Notation and formulas for counts, frequency, confidence and significance 32 4 Association rule examples . . . 34
5 Specific causal pattern-based association rules . . . 37
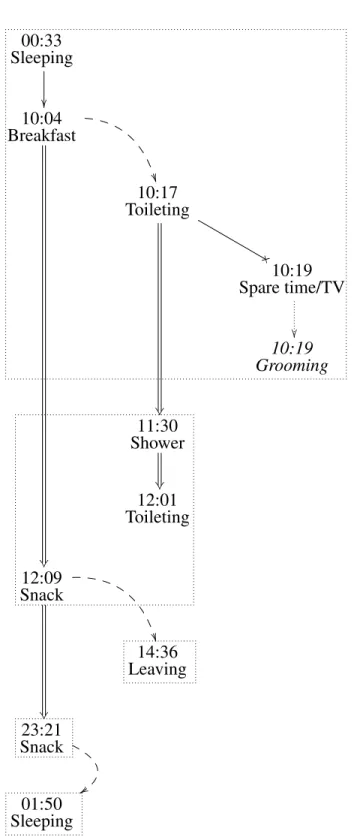
6 Associative network example . . . 41
7 Event selection algorithm . . . 44
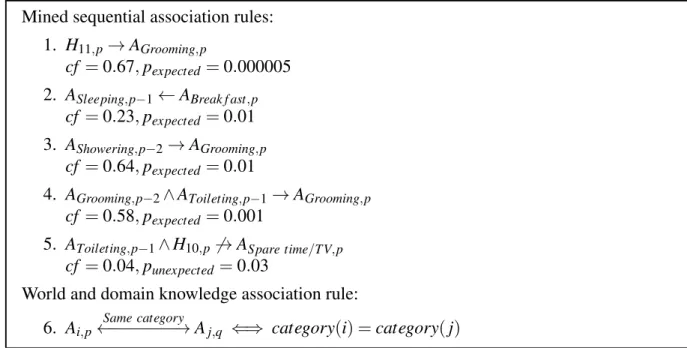
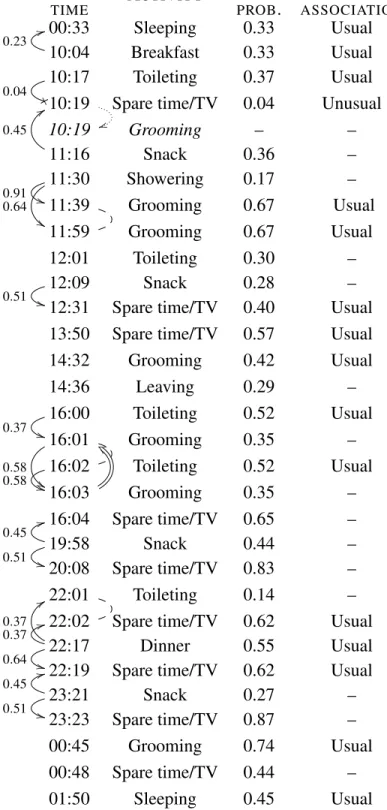
8 Associative network example . . . 45
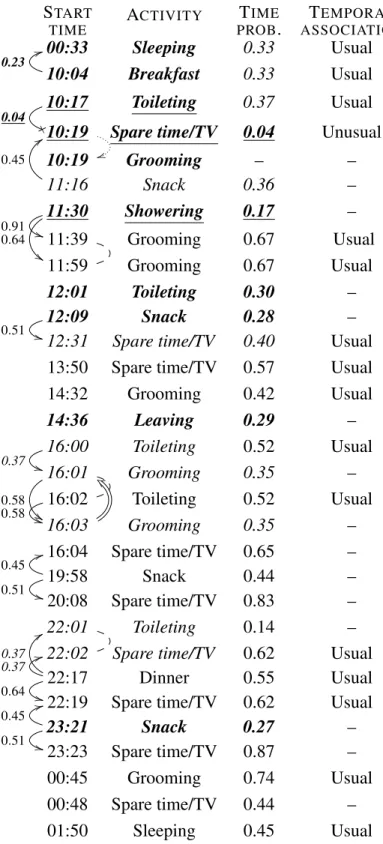
9 Connecting associative thread example . . . 48
10 English and French generated text examples . . . 59
11 Results of the text quality evaluation . . . 67 12 Chronology and icon legend used in the memorization experiment dry run 70
LIST OF APPENDICES
Appendix I: Text Quality Evaluation Form Sample . . . xiv Appendix II: Publications of the author related to this thesis . . . xvii
LIST OF INITIALISMS AND ACRONYMS
ADL activity of daily living NICU neonatal intensive care unit
NLG natural language generation RST Rhetorical Structure Theory
ACKNOWLEDGMENTS
Firstly, I would like to express my sincere gratitude to my supervisor Guy Lapalme for his precious support, beginning with the opportunity he gave me as an undergraduate to intern in his lab, and through all my doctoral studies and research. His wisdom and pragmatism helped me avoid straying from the path and reach my goal.
Very friendly thanks to analyst Fabrizio Gotti and to everyone at the laboratoire de recherche appliquée en linguistique informatique (RALI) for the stimulating discussions and moral sup-port.
My grateful thanks are extended to the Fonds de recherche du Québec - Nature et tech-nologies (FRQNT) and the Département d’informatique et recherche opérationnelle (DIRO) de l’Université de Montréal for their financial support.
Last but not the least, I would like to thank my partner Vanessa, my parents Doris and François, and my sister Myriam for their patience and loving support during this challenging period of my life.
CHAPTER 1
INTRODUCTION
When I was a child, like many others, when I came back from school my parents used to ask me something like: “What did you do at school today?” Then I would tell them about anything of note that had happened on that day. What went on in my mind between the question and the answer, I would be very curious to know. How were all the innumerable perceptions and thoughts of one day processed, summarized, and converted into language? However, this is not just a matter of curiosity. Our technological world is in great need of a solution to a very similar problem.
Whether they are standard on now ordinary devices such as mobile phones or are specialized for healthcare or surveillance purposes, for example, sensors of all kinds record more of our lives every day. Industrial equipment monitoring also generates considerable amounts of data. This adds to the data accumulating on computers around the globe on commercial and financial trans-actions, web traffic, and clickthrough statistics. These examples have in common large volumes of frequently updated non-textual event data. Much of this temporal data is heterogeneous and involves actions performed or experienced by individuals or groups. To present this information and allow the concerned persons to quickly understand the situation and make better decisions, computers must be able to discover links between events and express them properly. Indeed, the data must not only be described, but also analyzed, summarized, and explained. One way of presenting voluminous temporal data is to use Natural Language Generation (NLG) technology to produce a narrative text summarizing the events of a given period.
Experiments have shown that a narrative written by a domain expert can be a better support for decision-making than a graphical presentation of the same data (Law et al., 2005). Unfor-tunately automatically generated narratives do not yet achieve the same level of performance (Portet et al., 2009). Experts in discourse analysis have concluded that the problem may lay in the narrative structure: deficiencies in narrative flow and narrative details impacted negatively on coherence (McKinlay et al., 2009).
Hints on how to solve this problem may be found in cognitive psychology. According to experiments, narrative comprehension in humans seems to involve the construction of a causal network (Trabasso and van Den Broek, 1985, Trabasso et al., 1989). It is only natural, then, that causal networks have been applied to the automatic creation of fairy tales (Swartjes and Theune, 2006, Theune et al., 2007). Moreover, several narrative data-to-text systems already identify and make use of some causal relations (Bouayad-Agha et al., 2012, Hallett et al., 2006, Hunter et al., 2012, Wanner et al., 2010). Going further, in Vaudry and Lapalme (2015) we have tried to extract a form of causal network from temporal data and use it to build the structure of the generated narrative. We used data mining techniques to extract sequential association rules and interpreted them as indicating potential, approximate causal relations. The resulting causal network was used to express locally some rhetorical relations in the sense of the Rhetorical Structure Theory (RST) (Mann and Thompson, 1988). However, we did not succeed at that point at exploiting it to build a complete document structure that would give the text a global coherence.
The next year, we proposed an assisted temporal data interpretation model (Vaudry and La-palme, 2016) that I describe in more detail in this thesis. This model uses a combination of au-tomatically mined sequential association rules and a limited number of manually written world and domain knowledge rules to extract an associative network from temporal data. From this is built a document structure linking together the most unusual events. An associative thread can be followed by the reader from the beginning to the end of the generated narrative. Fi-nally, this intelligent preprocessing assists the human reader in applying their world and domain knowledge to form a causal representation of the events.
The thesis is organized as follows. After presenting the previous work that serves as theo-retical foundations for this thesis (Chapter 2), an entire chapter is dedicated to presenting the assisted temporal data interpretation model (Chapter 3). Next its components are detailed, be-ginning in Chapter 4 with those that deal with extracting an associative network from the data. Chapter 5 completes the model detailed description with the presentation of the components that exploit this associative network to generate a narrative. Finally the evaluation of the model is discussed in Chapter 6.
CHAPTER 2
PREVIOUS WORK
This chapter presents various work that, taken together, constitute the theoretical foundations of this thesis. It begins with what seems obvious by resorting to the discipline of narratology for a definition of the concept of narrative. It proceeds with psychological notions about causality and an overview of the role of narratives in scientific explanations, before a short excursion in the world of data mining. Last but not least, several research projects in the area of natural language generation are summarized, be they about creating fictional narratives or generating from real-life data.
2.1 Narratology
To make sure that a narrative text is an appropriate format for data-to-text from temporal data and to begin to understand how to generate one, let us first turn to the field dedicated to its study, that is narratology.
Genette (2007, p. 13) describes three senses of the word narrative (récit in French). The first sense is a text or speech telling about one event or a sequence of events. The second is a sequence of events and their relations (sequence, opposition, repetition, etc.) being the object of the narrative in the first sense. The third is an act of telling a story. The first definition confirms that a narrative expresses temporal data. The second one adds that the relations holding between the events are of importance.
Bal (2009, p. 5) adds to the first sense, that she calls narrative text, more media such as imagery and sounds. Her story would correspond to the second sense. The novel element here is that the events must be caused or experienced by actors. Those are agents that are not necessarily human but have the capacity to perceive and act. This definition would mean that temporal data involving actors would make better material for narrative generation than temporal data concerning only inanimate objects.
2.2 Psychology
Psychology is very useful as part of this thesis for the insights it gives on how humans identify causal relations in real-life and in the process of comprehending narratives.
2.2.1 Causal Attribution in Everyday Life
Attribution theory (Kelley, 1973) deals with how people make causal explanations in ev-eryday life. It models what kind of information people use to make causal inferences and how they use it. It has first developed to study how people choose between an internal and an exter-nal cause: is this behavior explained by the persoexter-nality of the person doing it (interexter-nal) or the situation in which it happens (external)?
One useful concept of attribution theory for analyzing temporal data is the covariation prin-ciple. This states that when selecting among possible causes, people tend to choose the one that covaries over time with the potential effect. It is also stated that this principle implies temporal contiguity between the cause and the effect. For the subject to be able to observe covariation, there must be occurrences of the potentially causally related pair appearing in close temporal proximity and other instances when neither occurs.
2.2.2 Narrative Comprehension
Trabasso and van Den Broek (1985) and Trabasso et al. (1989) used the concepts of causal networkand causal chain to explain the process of narrative comprehension in humans. Those causal networks are essentially composed of physical and mental events and states (of which actionsand goals) connected by causal relations. Restrictions apply on which types of causal relation can connect which types of event or state. Goals motivate actions and mental reactions are psychologically caused. Actions and other physical events can physically cause other phys-ical events. If an event or state is one of several causes but not a sufficient cause, it is a case of enablement. The causal chain comprises the events that are on a path that traverses the causal network from the introduction of the protagonists and setting to either goal attainment or the consequences of failure. Being on a causal chain and having more causal connections have both
been found to increase chances of an event being recalled, included in a summary or judged im-portant by the reader. This indicates that causal relations are at the heart of how humans process information submitted in the form of a narrative.
Zwaan et al. (1995) present the event-indexing model, a model of how readers mentally reconstruct the situations described by a narrative. According to this model, as each event mentioned in the text is comprehended, the current situation model is updated on five indices: temporality, spatiality, protagonist, causality, and intentionality. It has been demonstrated that sentence-reading times increase with the number of indices that present a discontinuity. This shows that events are related and grouped in the text according to various dimensions of simi-larity.
Centering theory (Grosz et al., 1995) models the focus of attention while reading a text. From that it makes predictions on the relation between the choice of referring expression encountered and how coherent the text appears to the reader. Each utterance has a set of entities called forward-looking centers. One of them plays also the role of backward-looking center. The backward-looking center of an utterance points towards one of the forward-looking centers of the previous utterance. Forward-looking centers are partially ranked by prominence. Coherence and realization are affected by the rank and role of the backward-looking center in the previous utterance. Those general principles can inspire how to refer to events in the narrative.
Neuroscience experiments have shown that in the telling of a spoken narrative, several areas in the listener’s brain are coupled with ones in the speaker’s (Silbert et al., 2014). This brain-to-brain interaction highlights the importance of imitating natural narratives for effective temporal data-to-text.
2.3 History and Philosophy of Science
Section 2.2.1 briefly presented attribution theory. This theory assumes that the man on the street uses a naive version of the scientific approach used in behavioral science (Kelley, 1973, p. 109). Since data-to-text systems must often deal with scientific concepts in order to provide useful insights into data (such as in Hallett et al., 2006, Hunter et al., 2012, Ponnamperuma et al., 2013, Portet et al., 2009, Turner et al., 2008, Wanner et al., 2010), it is useful to consider
the role of narratives in scientific explanations.
Athearn (1994, pp. 58–59) explains that historically, causal stories have been an important aspect of the sciences. An exception is physics, which left this behind at the end of the nineteenth century to replace it with descriptions in the form of mathematical formulas. However, narratives remain essential to other sciences, such as geology and biology.
In political science, for example, Dowding (2015, pp. 94–95) states that scientific models can provide an explanation by modeling a mechanism, which he describes as “a narration that makes sense of the data.” He adds that a characteristic of narratives is that they make a causal claim.
These thoughts about the history and philosophy of science tell us that a narrative is an appropriate way to scientifically model phenomena present in temporal data. They also highlight the importance of causality in those narratives.
2.4 Data Mining
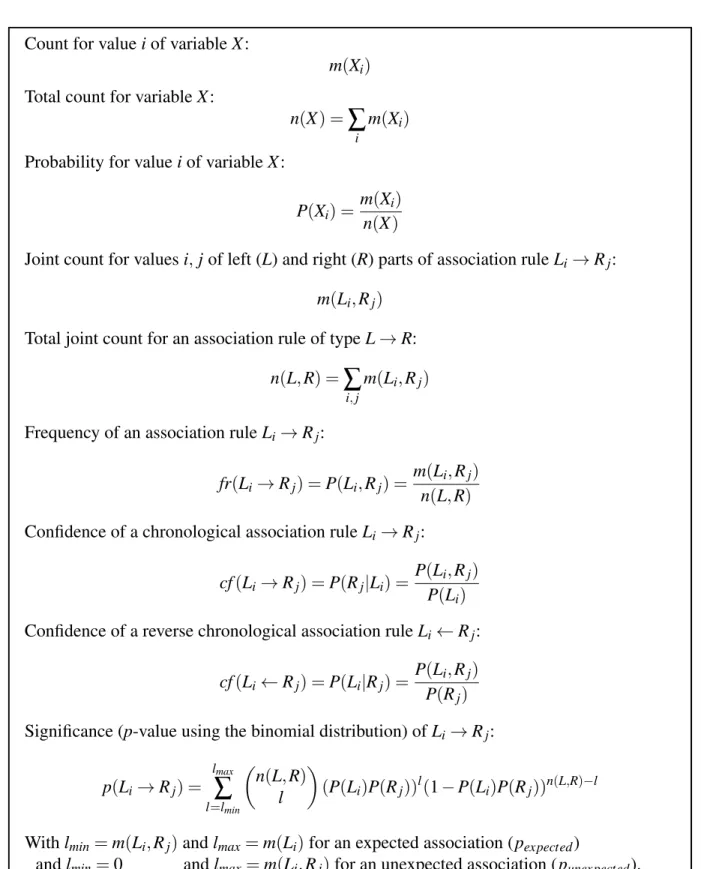
Data mining techniques can be used to automatically extract knowledge about associations between events in a dataset. Hamalainen and Nykanen (2008) presents a method for finding statistically significant association rules. Traditional association rules are selected based on frequency and confidence. Given a rule candidate X → Y with X and Y being events, its fre-quency is P (X ,Y ) and its confidence is P (Y |X ). Selecting based on statistical significance is desirable because associations between infrequent events are as relevant for the narrative as associations between frequent events. Significance can be measured by computing the proba-bility of independence of the two parts of the rule. If that null hypothesis would be true, then P(X ,Y ) = P (X ) P (Y ). The probability of independence is given by the binomial distribution because an event either occurs or does not occur. This is formalized in the following p-value formula. The lower this value, the more statistically significant a candidate rule is. m (X ) is the number of times X occurs, m (X ,Y ) is the number of times X and Y occur together, and n the total number of occurrences in which X and Y could have occurred.
p(X → Y ) = m(X )
∑
i=m(X ,Y ) n i (P(X )P(Y ))i(1 − P(X )P(Y ))n−i
An association rule can be interpreted as a probabilistic implication. A probabilistic im-plication is one that holds with a certain probability (Grzegorzewski, 2011). In that case the probability of this implication is the confidence of the rule.
2.5 Natural Language Generation
As one might expect, most of the previous work presented in this chapter belongs to the area of natural language generation (NLG). Reiter and Dale (2000) describe an NLG architecture that is representative of a number of existing NLG systems. It consists of a pipeline composed of three components: the document planner, the microplanner, and the surface realizer. The task of the document planner is to determine the content of the document along with its structure. It usually requires application domain knowledge about what information is appropriate for the communicative goal and the user model. Knowledge about how documents are structured in that domain may also be required. The document planner outputs a document plan and passes it to the microplanner. The microplanner must make some decisions that depend more on language and effective writing and less on domain knowledge. For example, it may be left to the microplanner to determine exactly how to package the selected content into sentences and how to choose referring expressions. Purely linguistic knowledge about grammar and document structure is stored in the third component, the surface realizer. Its job is to convert an abstract document specification into a string. It may have to put words in the right order, find the correct verb inflection and any auxiliaries corresponding to a particular tense and produce the proper mark-up to signal paragraph boundaries. This pipeline architecture is the one adopted in this thesis.
According to Reiter and Dale (2000), many NLG systems structure document content using ideas from Rhetorical Structure Theory (RST) (Mann and Thompson, 1988). RST is a theory about textual coherence. It posits a hierarchical document structure composed of recursive text segments. Two or more segments are grouped with a rhetorical relation to form a bigger segment. Some rhetorical relations, such as Circumstance and Elaboration, are binary and asymmetrical:
one of their arguments is the nucleus and the other the satellite. The nucleus is more important for the writer’s purpose. The satellite could be substituted by another satellite of the same kind. Other rhetorical relations are multinuclear. All their arguments have the same status. Contrast and Sequence are examples of multinuclear relations.
An advantage of placing the tasks of surface realization in a separate component of the pipeline is that it can be reused in different NLG systems. The grammar and lexicon do not in principle have to be adapted much when changing domain but not language. SimpleNLG-EnFr (Vaudry and Lapalme, 2013) is a bilingual English-French surface realizer that is used as part of this thesis. It is an adaptation of the English surface realizer SimpleNLG (Gatt and Reiter, 2009). It can be used to construct lexico-syntactic specifications and linearize them while taking care of morphology and punctuation. It can also accept canned strings inserted anywhere in the structure.
Systems generating narratives fall into two broad categories: those that do so based on fic-tional data and those generating from real-life data. The two following subsections summarize a few of them. Another subsection covers NLG evaluation.
2.5.1 Fictional Narrative Generation
Swartjes and Theune (2006) and Theune et al. (2007) apply causal networks to the automatic creation of fairy tales. A multi-agent system simulates a story world where characters can have goals, emotions and perceptions and can perform actions. This simulation outputs a story repre-sentation in the form of a causal network inspired by Trabasso et al. (1989). This serves as input to the NLG component of their storytelling system. The document planner component prunes the causal network and transforms the causal relations into rhetorical relations to form a rhetor-ical structure. The rhetorrhetor-ical relations used include Cause, Contrast, Temporal and Additive. Microplanning then maps the leaves of the rhetorical structure to syntactic dependency trees. After lexicalizing the nodes of those trees excepting referring expressions, they are syntactically aggregated with cue phrases depending on the rhetorical relation. Then referring expressions are generated and the now fully lexicalized dependency trees are linearized by a surface realizer. However, the system as described in those papers does not yet handle contrast relation detection
and separation of the rhetorical structure into paragraphs. In the same research project, Terluin (2008, chap. 7-8) studies the paragraph segmentation problem. Experimental results show that there is not one unique correct way to segment a text into paragraphs. However, sets of sentences covering a single event or issue (possibly containing elaborations) are never separated.
With the help of focus and inferencing models, Niehaus and Young (2014) generate fictional narratives in which some events need to be causally inferred by the reader. For example, suppose the reader is told that Robbie waits in a dark alley with a gun for someone to come out of the bank. The reader is next told that Sally goes to the bank, but the next day is unable to buy the dress she wanted to buy. The reader should then infer that Robbie robbed Sally. This is because this inference is both enabled (the explanation is simple and there are few alternatives) and necessary (the reader must make the inference to make sense of the story). Those causal inferences must be precisely defined as part of the input in order to be modeled.
León and Gervás (2010) also use causality-related relations to structure narratives. Their algorithm learns preconditional rules between events of a fictional story with the help of human feedback. Existing stories are first translated by a human into an event sequence, with events represented by predicates. An assumption is made that a valid set of preconditional links is one in which there exists a directed path from any event to the last event of the story. In other words, every event must be directly or indirectly a precondition to the last event of the story. Although this may make sense for a fictional story, it could involve eliminating important information when starting from real-life data.
2.5.2 Narrative Data-to-text
This subsection gives an overview of several data-to-text systems generating narratives from temporal data. Most identify and make use of some causal relations. Additionally, note that to achieve this they tend to rely on domain-specific knowledge.
Hallett et al. (2006) describes a medical history visualization system that integrates graphics and text. A semantic network extracted from patient records serves as input to the generation process. It contains information on problems, investigations, and treatments and causal relations between them. Depending on the type of summary requested, a list of concepts essential to the
summary will constitute the summary spine. To each event of the summary spine, some related events may be added depending on the summary type and length. Events are then grouped by time period and/or event type. Within groups, events are structured with rhetorical relations that are either found in the input or deduced from domain specific rules. Those include Cause, Result, and Sequence. The List relation is used for unconnected events. Events part of the summary spine are placed in the role of a nucleus of a rhetorical relation and other events preferably as satellites.
The Babytalk project aims at producing textual summaries from continuous physiological signals and discrete events recorded in a Neonatal Intensive Care Unit (NICU). Portet et al. (2009) describes the BT-45 prototype which summarizes periods of about 45 minutes. It uses expert rules to determine if two events must be linked because they are causally or otherwise related. The document planner works similarly to that of Hallett et al. (2006). It first identifies as key events those that have the highest importance and creates a paragraph for each. In each paragraph it places first the key event itself, then linked events, and lastly events happening at the same time. Paragraphs are ordered first by body system and then by the start time of their key event.
Discourse analysts compare BT-45 generated texts with human-written texts in McKinlay et al. (2009). They note that the texts differ in terms of narrative structure. The beginning and end of the human-written narratives are clearly marked by a temporal marker and a description of the current state of affairs. This description only contains the information judged relevant with what happened in the middle section of the narrative. The information found at the end represents an update on what was first presented. The generated texts also present apparent inconsistencies and statements which do not seem topically relevant. The human-written texts are better at making apparent relations between events that presented those events as a coherent whole. They also tend to foreground the baby under care as an actor and provide information about his or her experience.
After learning from BT-45, the Babytalk project continues with BT-Nurse (Hunter et al., 2012). This system summarizes 12 hours of NICU data to support nurse shift handover. Docu-ment planning is realized using a mixture of techniques. The Current Status section is planned
with schemas, that is fixed structures filled with predetermined types of events. The Events Dur-ing the Shiftsection is planned essentially as in BT-45. Some narrative deficiencies of BT-45 are addressed. The BT-Nurse document planner keeps track of the most recent information commu-nicated about each data channel to avoid continuity problems. For example, if the information that X increased to 10 and then X increased to 8 is selected, to avoid an apparent inconsistency it is important to additionally mention that X decreased to 2 between the two increases. This can take the form of a subordinated clause placed in front of the clause describing the second increase. Another important point is temporal planning. This is required because events inside a paragraph are not necessarily presented in chronological order. An event has an event time and a reference time that are used to determine tense. The former is the time at which the event happened. The latter can be equal to event time in a descriptive section, but can correspond to the time of the last mentioned event in a more narrative part. A perfect tense is used when the reference time is after the event time. Furthermore, to determine the event time, the temporal focus can be on the initial state, change of state, or final state corresponding to an event. Re-garding temporal modifiers, the strategy is to add an absolute time phrase to all key events and to long events when the focus is on their end state. The authors conclude that more effort is still needed to generate narratives that make the big picture clear and express properly temporal, causal, and other discourse relations.
Turner et al. (2008) generate a weather forecast from spatio-temporal meteorological data. They identify spatial reference frames used by experts to partition space into meaningful sub areas for descriptive purposes: altitude, absolute direction, coastal proximity, and population. Data points are enriched with those characteristics with the help of external geographical in-formation systems. The communicative purpose of spatial descriptions in that type of weather forecast is to explain each weather phenomenon by expressing a causal relation between it and some spatial reference frame. The evaluation highlights that forecasters would like to see more causal linking between events of a generated weather forecast in order to get a more fluent story. The MARQUIS system generates user-tailored air quality bulletins for five European regions (Wanner et al., 2010). It takes as input numeric monitored and forecasted air pollutant and meteorological time series. It can indicate causal relations between meteorological conditions
and pollutant levels. For this purpose, depending on the region correlations are determined by multiple regression, machine learning, or expert rules models. The causal relations can be lexicalized in various ways depending on the syntactic context: noun (cause, consequence), verb (to cause), adjective (responsible, due), or adverb (because, due, therefore). This is made easier by the use of a surface realizer that starts from a conceptual representation instead of a syntactic one. This surface realizer is implemented with the graph transducer workbench MATE (Bohnet et al., 2000).
Bouayad-Agha et al. (2012) describe a system for generating perspective-oriented football match summaries. The small generated narrative is adapted to reflect the affinity of the targeted reader for one of the teams. The same surface realizer as MARQUIS is employed. Logico-semantic relationsincluding causation are inferred between input concepts using domain-depen-dent rules. Logico-semantic relations can in principle be mapped to different rhetorical relations depending on the perspective chosen. For example, if a neutral perspective if desired, causation can be mapped to a temporal circumstance instead of a rhetorical cause or result. In practice perspective is communicated mainly through lexicalization. Semantic and lexical units are qual-ified with a polarity: positive, neutral, or negative. For example, the concept of causation can be expressed by three causation semantic units, one for each polarity. The semantic positive causation can in turn be expressed not only by the verb cause but also by the positive-sounding preposition thanks to, among others.
The Tag2Blog system generates narratives centering on satellite tagged wild animals (Pon-namperuma et al., 2013). The narrative places the animal’s movements in its ecological context by associating its time-stamped locational information with data about habitat types, terrain features, place names, and weather conditions. This enriched data gives an impression of the animal’s behavior: site fidelity and exploration, feeding and roosting, and social behavior. The needed expert knowledge is dependent on the species. The document plan is composed of two paragraphs each specified by a schema. The first one summarizes the overall movement pattern for the week. The second one, more detailed, describes interesting behavior during the week.
Gervás (2014) addresses the issue of planning a narrative about events involving several characters at different locations over the same period. The chosen experimental input data is
the description of a chess game in algebraic notation. The characters are the pieces and their perceptual range on the board is limited to a few squares. A fiber is defined as the sequence of events that are perceived by a given character. Once a set of fibers has been selected based on the communicative goal, splicing can begin. This operation consists of identifying potential break-points in each fiber, together with pairing breakbreak-points so that appropriate transitions between fiber fragments are obtained. A sequence of fiber fragments is called a yarn. For the initial version of the model, the splicer begins with the fiber that starts earliest, ends the fragment at a random point, and continues with the fiber that has been less fragmented until all the selected fibers are consumed. To indicate any change of context between fiber fragments now adjacent in the yarn, contextualization devices are placed at the beginning of each fragment: temporal expressions or discourse markers, spatial expressions, tense, setting or character attitude indica-tions, etc. The yarn is then converted to a narrative span by removing redundant information in successive event descriptions. According to the author, further work should integrate causal relations along the lines of Trabasso et al. (1989). The detection of causal relations between events in different fibers, in particular, could guide better splicing into yarns.
Baez Miranda et al. (2014, 2015) generate a narrative from sensor data acquired during a mountain ski excursion. A domain-specific task model provides top-down constraints on the se-quence of scenes that can be identified in the data to form the structure of the narrative. The task model organizes activities into a hierarchy of tasks and sub-tasks. Each task is characterized by an actor and objects in the actor’s environment. The model can represent temporal constraints, dependencies and causal relations between tasks. Based on horizontal and vertical speeds, GPS data is divided into segments classified as ascending, moving forward, descending, or break. The segments are then incorporated into an ontology encoding the task model and enriched with point-of-interest data. The narrative’s content is selected based on what is valid according to the task model. The segments containing the beginning, end, and goal of the excursion are always included.
Farrell et al. (2015) describe a model for the generation of narrative explanations from error trace data. The model uses finite-state technology. Trace explanations are specified for a specific domain by associating error trace regular expressions with natural language strings. Among
other things, this can be used to recognize and express the possible causes of an error.
Ahn et al. (2016) generate small narratives from causal graphs. Those causal graphs are abducted from first order logic descriptions of the actions of simple imaginary characters taken from a commonsense inference benchmark (Gordon, 2016). To this end, commonsense knowl-edge of actions, social relationships, intentions, and emotions are manually encoded. To gener-ate more fluent narratives, paraphrases are first genergener-ated by applying rule-based grammatical transformations. Then a probabilistic parser is used to select the best one.
2.5.3 Evaluation
This subsection summarizes selected research that is relevant for narrative data-to-text eval-uation. The ideas presented here inspired the evaluation methods described in Chapter 6.
Belz and Reiter (2006) compares automatic and manual methods for the evaluation of know-ledge-based and statistical NLG systems. They classify evaluation methods as either intrinsic or extrinsic. The former consist of evaluating the generated texts themselves, either by asking subjects to rate them or by automatically comparing them to reference texts using evaluation metrics. The latter methods evaluate the generated texts by measuring their impact on task performance, counting expert post-edits, or measuring reading times.
Jordanous (2012) proposes a standardized procedure for evaluating computational creativity systems. As part of this work, a corpus of academic papers was analyzed to find the words most significantly associated with creativity. Those words were clustered and 14 components of creativity identified. Those that are the most relevant for the model proposed in this thesis are: dealing with uncertainty, domain competence, and originality. In particular, note that originality can mean to show previously unassociated concepts as linked with or without specifying how they are related.
Callaway and Lester (2002) designed a narrative prose generation system that takes as input a high-level story specification. It was subject to an intrinsic evaluation by presenting the output of different versions of the system to subjects who rated it on 9 criteria. Some pertained more to the formal properties of the generated texts: style, grammaticality, flow (between sentences), diction (word choices), and readability. Others were more about the semantics of the texts: logicality
(omissions, being out of order), detail (too much or too little), and believability (behavior of the characters). There was also an overall criterion which asked how good the generated stories were compared to fairy tales in general.
Portet et al. (2009) conducted a task-based extrinsic evaluation of the BT-45 system. Doctors and nurses were given a human-written text, a generated text or a graphical presentation of historical data about a baby that had been hospitalized in the past. They then had to make decisions about the action(s) to take. A score was computed which rewarded appropriate actions and penalized inappropriate ones. The human-written texts proved superior to the other two. There was no significant difference between generated texts and graphical presentations.
Hunter et al. (2012) evaluated their BT-Nurse system by generating texts for currently hospi-talized babies at shift handovers and asking the incoming and outgoing nurses to rate them. The evaluation criteria were understandability of the text, accuracy of the content, and helpfulness in writing a shift summary (outgoing nurse) or in planning care (incoming nurse). A significant majority of ratings were positive for each criterion. This evaluation could be classified as intrin-sic because the text themselves are rated by experts. However, helpfulness could be considered an extrinsic criterion because it relates to what the nurse can do with the text, i.e. its function.
2.6 Conclusion
This chapter presented some necessary basic notions: definitions of narrative, the covariation principle, causal networks and causal chain, narratives in science, association rule mining, an NLG pipeline architecture, Rhetorical Structure Theory, various examples of NLG systems, and intrinsic and extrinsic evaluations. It can be observed that the notion of causality is associated with narratives and temporal data in narratology, psychology, fictional narrative generation, and temporal data-to-text. In narrative data-to-text, causal relations are used and acknowledged as important, but they do not play a central role in planning the text. Furthermore, most systems have a domain-specific planning algorithm or a generic planning model that requires a lot of effort to be instantiated for a particular domain. The next chapter presents a narrative data-to-text model that addresses those issues.
CHAPTER 3
ASSISTED TEMPORAL DATA INTERPRETATION MODEL
This chapter proposes a model showing how automatically extracted and manually written association rules can be combined to build the structure of a narrative from real-life temporal data. First the main characteristics of the model are presented. Then the communicative goal of the generated text in the context of this model is explained. Follows a brief overview of the main steps included in the model. Finally possible applications are discussed and an example application in the Activity of Daily Living domain is introduced.
3.1 Main Characteristics of the Model
The model presented in this thesis is a data-driven model for generating narratives for assist-ing human interpretation of temporal data. It features a discourse structure aimassist-ing at leadassist-ing the reader from the beginning to the end of the narrative. All those characteristics are elaborated in the following subsections.
3.1.1 A Narrative Generation Model
A narrative is a text presenting with a certain angle a series of logically and chronologically related events caused or experienced by actors (Bal, 2009, p. 5). Therefore, this model assumes that generating a narrative is a natural way to communicate temporal data including actions or activities, if that corresponds to the needs of the users. To generate a text that readers recognize as a good narrative, this model takes inspiration from narrative comprehension theory (Trabasso and van Den Broek, 1985, Trabasso et al., 1989). More precisely, it assumes that the process of narrative comprehension involves the mental construction of a causal network by the reader.
3.1.2 A Data-driven Model
The model includes the extraction of sequential association rules using data-mining tech-niques (Hamalainen and Nykanen, 2008). This means that patterns where it does not seem
plau-sible that chance can explain an event type frequently following another event type are gathered from training data. Those sequential association rules are used for event selection and docu-ment structuring. The use of data mining techniques to capture information potentially useful for causal interpretation allows both to rely less on domain knowledge and to better adapt to the characteristics of a particular dataset.
To maximize the scope of this thesis, it was important that the model be applicable to a wide range of domains. That is why a domain-independent bottom-up approach to document planning was chosen. That said, given knowledge about the structure of the narratives needed for a specific application, it could plausibly benefit from the addition of top-down specifications. For example, Baez Miranda et al. (2014, 2015) use a task model providing constraints on the sequence of scenes that can be identified in ski excursion data to structure the narrative. Top-down specifications of this kind are not addressed in this thesis.
3.1.3 An Assisted Interpretation Model
What makes this model an assisted interpretation model instead of a fully automated one is its recognition of the need of incorporating human input. Associations are provided that the reader must interpret to arrive at a causal explanation. In addition, world and domain knowledge are added manually into the system.
3.1.3.1 Associations, Not Causal Relations
In the course of my research, I found that it was very difficult to infer even the direction of a potential causal relation from an extracted sequential association. The initial hypothesis was that approximate causal relations could be derived from sequential association rules. For this purpose it was assumed that temporal precedence was an indicator of potential causality. Sequential association rules were thus mined with a chronological direction only.
A first paper was published (Vaudry and Lapalme, 2015) and the claim of identifying even approximate causal relations was criticized in the anonymous reviews. Some argued that domain knowledge was necessary. This I agreed with. I eventually integrated the possibility of having manually written association rules that could reflect world and domain knowledge.
A later hypothesis suggested mining reverse chronological sequential association rules to try to capture underlying goals having a later manifestation. If for an action sequence AB, it is possible to predict the previous occurrence of A given the later occurrence of B, the hypothesis was that A was possibly done in order to be able to do B. In other words, the goal of A could be the enabling of B. Reverse chronological association rule mining was implemented to test this. After looking through the results, I came to the conclusion that there was no clear link between the direction of the rule and the direction of a potential causal relation.
Because of those considerations, I no longer claim to identify causal relations, even “ap-proximate” ones. The relations found are simply termed associations. By association, I mean a connection between events or states without specifying the nature of the underlying relation. For example, an association can be based on a frequent sequence or a formal similarity. For the purpose of narrative comprehension, I assume that interesting associations are those that can help the reader formulate causal hypotheses.
In contrast with work on reader inference in fictional narrative generation such as Niehaus and Young (2014), in our model the computer generating the text does not have access to causal relations or even to all relevant real-world events. Relying on predictions of what the reader will infer when reading the text is not possible, because the computer is missing world and domain knowledge that only the human reader can possess. Instead, the computer finds associations in the data and presents them in a form that the human reader can interpret as a narrative.
Note that although this is not a model for creating fictional narratives, its function is to suggest new associations between previously unassociated events. In this sense and to the extent that it accomplishes this, it can be considered to produce original, creative text (Jordanous, 2012, p. 257).
3.1.3.2 Added World and Domain Knowledge
World and domain knowledge can be formalized as various forms of association rules. Only a limited number of rules is necessary. Those rules can be manually entered or come from an existing ontology, for example. Belonging to the same ontology class can be made into a type of association. Events of the same class can have similar causes and effects. Other possibilities
include creating associations between events having the same location (or locations of the same class) or sharing an argument (or arguments of the same class). Generally, any knowledge about possible causality that can be formalized as a rule can be used here.
3.1.3.3 Construction of a Causal Representation by the Human Reader
In this model, the most important associations found between selected events form a chain of associations throughout the text. The model assumes that this associative thread can be followed by the human reader from the beginning to the end of the text. Based on experiments show-ing that human narrative comprehension seems to involve the construction of a causal network (Trabasso et al., 1989), this model makes a number of hypotheses. The associations expressed between some of the events can give the reader hints toward building a mental representation of the events. Their world and domain knowledge can enable them to sort through the expressed associations to retain and enrich the relevant ones. This can lead the reader to fill the gaps left by the text towards a causal interpretation of the events.
3.1.4 From Beginning to End
Simple generated narratives should have a structure including a clear beginning introducing a middle section and leading to a recognizable end (McKinlay et al., 2009). This model achieves this by constructing a non-hierarchical, tree-like document structure having the beginning as root and the end as the last leaf to appear in the text. The different branches link all selected events with the most important associations. This structure is called the connecting associative thread. The type of period to be summarized should be chosen so as to have a natural beginning and end. For example, a day beginning with getting up and ending with going to bed, a working shift or a clearly delimited incident. An appropriate definition of the type of period to summarize is required before applying this model. It is possible that because of this limitation, the model would not be equally well applicable to any kind of data. In that case, some more elaborate way of determining the initial and final situations of the narrative would need to be developed.
3.2 Communicative Goal of the Generated Text
The communicative goal of the generated text in the context of this model is to communicate effectively the facts necessary to facilitate the construction of a causal network by the reader. By necessary facts, we mean the least easily predictable facts. The more easily predictable facts can, by definition, be more easily guessed by the reader. The least easily predictable facts are more difficult to guess and must be given explicitly. The sequential rule model serves to approximate how easily a fact can be predicted (given the other facts) by a reader who knows what is usual for a period a the same type of data. The least easily predictable facts are the most unusual (or least usual) of the summarized period compared to a typical period of the same kind of data. They are what makes this period unique.
The associations expressed in the generated text should give valuable hints to the reader in constructing a causal mental representation of the events. Moreover, they should generally help see the events of the period as a coherent whole if such coherence can be found. This should help the reader assimilate effectively the text’s content.
The facts not mentioned in the text should be implicitly understood as “same as usual" and the reader should be able to infer them approximately from the text’s content if needed. Accord-ing to Niehaus and Young (2014), the reader will make such an inference if it is necessary to the comprehension of the text (criterion of necessity) and not too difficult to make (criterion of enabledness). An inference could be necessary because there is a gap in a causal chain, for ex-ample. The knowledge that the reader has of what usually happens, if the sequential association rules model that correctly enough, should enable the reader to make such inferences.
In the case of the inferences that could be triggered in the reader by the expressed associa-tions, it is much more difficult to use the criteria of necessity and enabledness, as exactly what should be inferred or not is not known by the computer. For example, suppose an association is expressed between events A and B. If it was established that there was a causal relation between A and B, the computer could try to determine if the criteria of necessity and enabledness were fulfilled. In the affirmative, the relation could be left implicit, but if not it would need to be expressed explicitly. The problem here is that in this model, the computer does not know if there was a causal relation between A and B in the first place. There could be no causal relation or
a common cause or effect or something else altogether. In this model, the computer does not choose between these alternatives. Rather the associations are communicated and it is left to the reader to find an explanation.
3.3 Model Overview
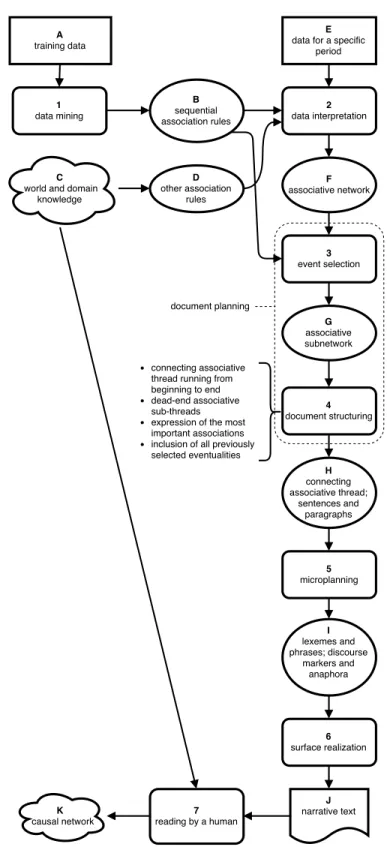
This section presents the main components of my model of assisted temporal data inter-pretation using narrative generation. Figure 1 on the following page gives an overview of this model. I will refer to its components by using numbers for steps and letters for representation levels. Association rules come from two sources: data mining (1) for sequential association rules (B) from training data (A) and world and domain knowledge (C) formalized as rules (D). The data about a specific period (E) is interpreted (2) using the association rules to create an associative network (F). Then a sub-network containing the most unusual facts (G) is selected (3) using the probabilities of the corresponding sequential association rules (B). The following step of document structuring (4) involves determining the connecting associative thread going from the beginning to the end of the narrative (H). Microplanning (5) produces from this the lexico-syntactic specification (I). This specification is then realized (6) as a text (J) read by a hu-man (7). The huhu-man reader uses his knowledge (C) to reason about the associations expressed in the text. From this they form a mental representation which hypothetically includes a form of causal network (K). The following chapters detail each of these steps.
3.4 Applications
This section sketches the type of data to which this model applies. A specific example of an application domain, Activities of Daily Living, is described in Section 3.4.1.
Genette (2007, p. 13) defines a narrative to be a discourse about an event or series of event and the various relations between them. Bal (2009, p. 5) adds that those events must be caused or experienced by actors. A data-to-text system summarizing temporal data should thus aim at generating a narrative if its users need to have a summary of what happened and how. This is to be contrasted with a descriptive summary containing only statistics about what happened. Furthermore, although this is not required by the proposed model, a generated narrative would
Figure 1 – Assisted temporal data interpretation model. Rectangles represent input data; rounded rectangles: computational representations; ellipses: steps; clouds: hypothesized mental representations; rectangle with S-shaped bottom side: natural language document. For ease of reference, steps are identified by a number and representations by a letter.
be the more relevant if the temporal data includes actions or activities. The presence of actors causing or experiencing events introduces, even if only implicitly, goals and other mental events into the causal network underlying the narrative (Trabasso et al., 1989). Note that inanimate objects or phenomena can sometimes be treated as animate for narrative purposes.
The proposed model of assisted temporal data interpretation by narrative generation should be applicable in any scenario where:
— events happen repetitively enough to accumulate statistics;
— a summary of a given period is required on a regular basis to monitor unusual events; — it would not be worthwhile to ask a human to go through the detailed sequence of events
to write the summary themselves.
Events and states can be overlapping or not. If overlapping, they can still be analyzed as a single sequence by ordering them by their start time. This does not prevent correct temporal relations to be taken into account (inclusion, overlap).
Growing quantities of data corresponding to the above criteria are available. Mobile devices equipped with ever more numerous and varied sensors occupy an increasingly large place in our lives (Lane et al., 2010). For example, their daily use for the monitoring of the health of a person with a chronic disease or a mental disorder is currently studied (Pavel, 2013, Pentland et al., 2009). Specialized sensors could also be applied temporarily during a medical emergency to allow better transfer of information in the health-care chain (paramedic, nurse, doctor, etc.) (Schneider et al., 2013). Even without specialized sensors, our behavior is often recorded. Video monitoring, whether for reasons of health, safety or traffic monitoring, produces a lot of data that need to be analyzed and synthesized in order to detect problematic behaviors (Lee et al., 2000). All commercial and financial transactions recorded daily can provide important information on consumer behavior and the economy, which is valuable for business, government and society in general. On the web, the millions of clicks recorded have the potential to improve the user experience by better identifying their needs. Finally, the various logs recorded by computer servers need to be exploited to better manage traffic and network security.
The following subsection describes an example of a typical application domain for the pro-posed model, the Activity of Daily Living domain.
3.4.1 Activities of Daily Living
Ambient assisted living technology can be used to help elderly people to live in their own house longer. Moreover, sensor equipment can be used to monitor an elderly person’s Activities of Daily Living (ADLs) and detect anomalies associated with dementia early (Lalanda et al., 2010).
There are different ways of processing sensor data to detect and present possible anomalies. For example, Munstermann et al. (2012) achieve typical behavior discovery by learning a tran-sition network from the ADL sequence data. They then use it to measure how normal a given day is and map this metric to traffic light colors.
However the normalcy of a given day is measured, health care professionals would still need to assess if there were indeed anomalies and what was their nature. For this, a more detailed access to the data is required. In my experiments, I explore a way of presenting unusual facts using NLG technology. For that sequential association rules are extracted from the event data. They are then used, together with manually written association rules, to present a textual narra-tive summary of a given time interval that emphasizes unusual facts. Health care professionals could then review this summary for potential anomalies with access to other sources of infor-mation. One advantage of natural language is that it can compactly express not only events but also multiple relations between events. By selecting for the generated text only the most impor-tant events and relations, the reader should not have to pore over unnecessarily detailed usual behavior.
3.5 Activity of Daily Living Data-to-text Running Example
Since this was my first experiment both with generating a narrative from extracted associ-ations and presenting unusual facts in Activities of Daily Living (ADLs), I wanted to work on a simple yet realistic dataset. For this reason I chose the publicly available UCI ADL Binary Dataset (Ordóñez et al., 2013). This dataset was assembled to train activity classifiers that take as input raw sensor data. I do not address this task in this thesis, relying instead on the reference annotations provided as the input (but see for example the paper just cited or Fleury et al., 2010). Generating from raw data and not reference annotations would pose problems that are out of the
scope of this thesis.
This dataset includes the ADLs of two users (A and B) in their own homes. The data was recorded for 14 and 21 consecutive days, respectively. Binary sensor events and the correspond-ing activity labels are given. I used only the latter in my experiments. For each sensor event or activity, the start and end time are given. There is no overlap between sensor events and between activities (there was only one person per house).
The ADL label set is: Leaving, Toileting, Showering, Sleeping, Breakfast, Lunch, Dinner, Snack, Spare_Time/TV, Grooming. The ADL sequence for user A comprises 248 activities (av-erage of 18 activities per day) and that for user B, 493 activities (av(av-erage of 21 activities per day).
To illustrate the various representation levels of the model, an example based on this dataset is provided throughout the remaining of this thesis. It appears in Tables I and II and figs. 2, 4, 6 and 8 to 10, on pages 26, 30, 34, 41, 45, 48 and 59, respectively.
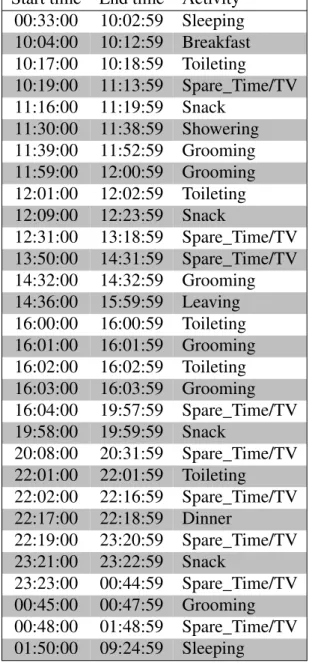
The input for this running example consists of the data for user B as training data (A in Fig-ure 1, p. 22) and the portion covering the day of November 24, 2012 as the data to summarize (E in Figure 1). Table I on the next page lists the 30 ADL labels of that day. On the same page, Fig-ure 2 offers a foretaste of the sort of generated text that can be obtained with an implementation of the proposed model. The next chapters explain exactly how this is done.
In a real application and in an ideal experiment, the training data would not include the data about the day to summarize and subsequent days. Predictive relationships about the user’s routine would be extracted from past data in the form of sequential association rules. This knowledge would then be used to evaluate the likelihood that events in the current period follow the same routine. However, considering the small size of the dataset, including all the user’s data in the training data helped mitigate data sparsity problems. That way, texts could be generated for any day of the dataset, instead of only the last few days for each user.
When publishing this research in Vaudry and Lapalme (2015), we have been asked about what seemed like irregularities in the UCI ADL Dataset activity labels. Sometimes the same label is repeated and one could think that it was just the same activity that continued. It has been suggested to treat such a case as a single longer activity for data-to-text purposes. However, by
Start time End time Activity 00:33:00 10:02:59 Sleeping 10:04:00 10:12:59 Breakfast 10:17:00 10:18:59 Toileting 10:19:00 11:13:59 Spare_Time/TV 11:16:00 11:19:59 Snack 11:30:00 11:38:59 Showering 11:39:00 11:52:59 Grooming 11:59:00 12:00:59 Grooming 12:01:00 12:02:59 Toileting 12:09:00 12:23:59 Snack 12:31:00 13:18:59 Spare_Time/TV 13:50:00 14:31:59 Spare_Time/TV 14:32:00 14:32:59 Grooming 14:36:00 15:59:59 Leaving 16:00:00 16:00:59 Toileting 16:01:00 16:01:59 Grooming 16:02:00 16:02:59 Toileting 16:03:00 16:03:59 Grooming 16:04:00 19:57:59 Spare_Time/TV 19:58:00 19:59:59 Snack 20:08:00 20:31:59 Spare_Time/TV 22:01:00 22:01:59 Toileting 22:02:00 22:16:59 Spare_Time/TV 22:17:00 22:18:59 Dinner 22:19:00 23:20:59 Spare_Time/TV 23:21:00 23:22:59 Snack 23:23:00 00:44:59 Spare_Time/TV 00:45:00 00:47:59 Grooming 00:48:00 01:48:59 Spare_Time/TV 01:50:00 09:24:59 Sleeping
Table I – The 30 ADL labels for user B on November 24, 2012.
OrdonezB Saturday, November 24, 2012 12:33 AM - Sunday, November 25, 2012 09:24 AM
---OrdonezB got up at 10:02 AM and then he ate his breakfast. As usual at 10:17 AM he went to the toilet but then he unexpectedly spent 1 hour in the living room instead of grooming.
In addition to having gone to the toilet at 10:17 AM, he took a shower at 11:30 AM. Also at 12:01 PM he went to
the toilet. Beside his 10:04
AM breakfast, he had a snack at 12:09 PM.
At 2:36 PM he left for 1 hour.
In addition to his 12:09 PM snack, he had a snack at 11:21 PM.
As usual at 1:50 AM he went to bed.
Figure 2 – English generated text example for user B on November 24, 2012.
looking at the sensor data it can be understood why it was annotated in this way. For example, between the Grooming activity that finishes at 11:52 in Table I and the following activity, also Grooming, that begins at 11:59, the sensor data reveals that the bedroom door was used twice. In any case, I want to stress that it is out of the scope of this thesis to question the annotation process of this dataset.
3.6 Conclusion
In summary, this chapter presented a model of assisted temporal data interpretation by nar-rative generation. In this model, the capacities of both computer and humans are exploited to bring out a causal interpretation of the data. The computer itself only manipulates associations, formal relations of indefinite semantics which have in common that they may help the human reader in making causal hypotheses. Some association rules come from sequential data mining while others are manually derived from world and domain knowledge. The reader can follow a connecting associative thread from the beginning to the end of the generated text. This model should be most applicable to repetitive temporal data including actions or activities, such as Activities of Daily Living (ADLs).
The next two chapters describe in more detail this model and provide an example of appli-cation in the ADL domain. Chapter 4 explains how an associative network is extracted from the temporal data. Chapter 5 presents the natural language generation proper where the associative network is transformed into a narrative text. Chapter 6 discusses the evaluation of the proposed model.