Revue Roumaine de Chimie http://web.icf.ro/rrch/
Rev. Roum. Chim.,
2018, 63(2), 000-000
THE INFLUENCE OF TITANIUM DIOXIDE IN THE PVK MATRIX
ON ANTI-BACTERIAL PROPERTIES, ELECTRICAL RESISTANCE
AND RESISTANCE TO UV RADIATION
Ouahiba BOURICHE,a, b* Brahim BOUZERAFA, a Hicham KOUADRI a,b* and Ouarda DJAOUT b a Laboratory: Preparation and Modification of Multiphase Polymeric Materials (LMPMP), Department of
Process Engineering, University of Ferhat Abbas Setif 1 19000 Algeria
b The Center of Scientific and Technical Research in Physicochemical Analyzes (CRAPC), BP384,
Industrial Zone Bou_ Ismail RP 42004 Tipaza Algeria Received June 8, 2017
In the present study the poly (N-vinylcarbazole) (PVK) is doped with nano-crystalline titanium dioxide (TiO2). The solutions of
the PVK-TiO2 and neat PVK in the DMSO were prepared, followed
by a gradual evaporation of the solvent until the mixture became viscous. The viscous solution was drop-cast onto a pre-cleaned glass substrate (ITO). A polymer thin film was formed after slow solvent evaporation under ambient conditions for 12h. Thin films of PVK-TiO2 composites show a porous microstructure (SEM).
The complexation and the ultraviolet resistance of the composite were confirmed by Fourier transform infrared spectroscopy (FTIR) and UV-Visible studies. The antibacterial activity was tested with various concentrations, 10-2M, 3.10-2M and 5.10-2M
of doping, with Bacillus subtilis, Pseudomonas aeruginosa,
Escherichia coli, and Staphylococcus. The electrical resistance of
the samples of PVK and these complexes is based on the Automatic Mapping Four Point Probe System. Moreover, the TiO2
based Poly (N-vinylcarbazole) (PVK) exhibited a remarkable variation at higher concentrations as compared to that of the pure poly (N-vinylcarbazole) film. The antimicrobial activity against gram negative and gram positive bacteria increased with the increase in the concentrations of TiO2 and the maximum inhibition
of bacteria growth was observed in PVK-TiO2(5.10-2M) composites
with Escherichia coli. This is due to the higher concentrations of TiO2, activated surface area and better dispersion of TiO2 on
PVK. The results of SEM confirm the presence of TiO2in the
composite, which consequently modifies the morphology of the film significantly.
INTRODUCTION
Poly (N-vinylcarbazole) (PVK) is a nonconjugated polymer, 1, 2 and it is a vinyl polymer with repeat
carbazole poly cycle. The PVK is an amorphous, thermoplastic, hard and transparent polymer.3
This material has outstanding physicochemical properties (photoconductive, photo-refractive, high refractive index) and is used in many areas such as
photovoltaic cells, holograms, and photocopies. PVK is a good insulator in the neutral state with low conductivity of about 10-14 to 10-16 S.cm-1, and
it was used originally as a dielectric capacitor, since it has very good electrical resistance over a range of temperatures and frequencies.4, 5 The PVK has an
energy gap (Eg) in the range of 3.3-3.5 eV.6, 7 The
photoconductive character of PVK (increase in electrical conduction under the influence of light radiation) was discovered.3, 8 This allowed the
*Corresponding authors: Tel: (+213) 549 9936 82; E-mail: anesk2011@yahoo.fr; (Dr. BOURICHE Ouahiba); E-mail: chinpolyhim@yahoo.fr; (Dr. KOUADRI Hicham)
exploitation of PVK in the field of xerography and radiation. In addition to its photoconductive power, the PVK is also photo- and electroluminescent.9
A number of studies have been carried out on the photodegradation of poly (N-vinylcarbazole) under UV irradiation. Bussiére PO et al.10 studied the photodegradation of poly (N-vinylcarbazole), and Aurélien, 11 studied the photochemical behavior upon exposure to UV- light of a poly (2, 7-carbazole) derivative for use in high-performance solar cells. Akira. I, Rivaton. A et al. have also followed the evolution of the IR spectrum of a PVK film photooxidized.12-14
The organic-inorganic hybrid materials are the subject of much research because they help develop new applications by combining the properties of both components. For two decades, the titanium dioxide films have been extensively studied for many applications including photo catalysis, solar cells, and coatings for optics or wave guide applications of titanium dioxide for the manufacture of integrated optical devices.
Inorganic particles not only increase the mechanical strength of the polymers but also can provide antibacterial property.15 TiO2 is one of these
agents. It is a semiconductor photo catalyst that can generate hydroxyl radicals (OH) under UV light. This is very important in catalysis reaction, and antibacterial property of TiO2 comes from the
light reactivity of the excited hydroxyl radicals.16 The work of Robinson et al.17 showed the antibacterial activity of titanium dioxide powder type anatase with Escherichia Coli under and in the absence of UV light. This postulate was confirmed by Rincon et al.18 Kubacka et al.19
studied the activity of TiO2 in an EVOH matrix at
different rates (from 0.5 to 5% by mass).
Bahloul W20 studied the antibacterial properties
by incorporating titanium dioxide-type (anatase) in a polypropylene matrix. Cheng et al.21 prepared a
composite material from mixing TiO2-Ag and PVC
granules. Su et al.22 prepared a nanocomposite
TiO2/Ag/polyethylene glycol (PEG600). The
anti-bacterial activity of a composite film TiO2/Ag was
studied by Liu et al.23 Paulina Rokicka et al.24
examined the antibacterial properties of 15 Titania photo catalysts, mono- and dual-modified with nitrogen and carbon. The antimicrobial activity of single-walled carbon nanotubes coated with poly (N-vinylcarbazole) was studied by Ahmed F. 25
The aim of our study is to incorporate titanium dioxide (TiO2) into PVK and to study the TiO2
concentrations effect on optical absorption, antibacterial
activities, ultraviolet resistance, electrical resistance and morphology of Poly (N-vinylcarbazole). We note that the antibacterial activities and ultraviolet resistance of PVK-TiO2 have not been studied yet.
Therefore, we report the detailed studies here.
EXPERIMENTAL 1. Materials
The following materials were used in this investigation:
Commercially Poly (N-vinylcarbazole) (molecular weight 1,100,000).
Titanium dioxide (TiO2) powder. The materials
were purchased from Sigma-Aldrich and were used without any additional purification.
Dimethylsulfoxide (DMSO) as a solvent. Gentamicin (10 μg/disc).
Indium Tin Oxide (ITO) coated substrates. Filter paper discs (5 mm in diameter). The solid media plates.
Muller Hilton agar was used for bacteria culture; Strains of bacteria were obtained from the American Type Culture Collection.
Four bacterial strains were tested: Escherichia coli ATCC 25922, Pseudomonas aeruginosa ATCC27853, Bacillus subtilis ATCC 6633 and Staphylococcus aureus ATCC 43300.
2. Sample Preparation
PVK and TiO2 materials were dissolved in
DMSO at ambient air. The composite was used in a bath deposition onto glass substrates (ITO). To the deposition process, the ITO substrates were ultrasonically cleaned in methanol, acetone and distillate water for 10 min, and the samples were further dried in ambient air for 12h. The thickness of the polymer layer was controlled with the help of different deposition time and by the concentrations of polymer in the solvent (thickness of the order of 5 µm). Muller Hilton agar was used for bacteria culture. Strains of bacteria were obtained from the American Type Culture Collection. Four bacterial strains were tested. Briefly, a suspension of the tested microorganism (0.1 mL 108 cells per mL) was spread on the solid media plates. Filter paper discs (5 mm in diameter) were impregnated with 10 μL of 100 mg/mL of the composite and placed on the inoculated plates. These plates were incubated at 37 C° for 24h. Gentamicin (10 μg/disc) was used as a standard and dimethylsulfoxide DMSO as a control.
CHARACTERIZATION 1. FTIR spectroscopy
In the present study, the chemical structure and the complexation of the composites were investigated by FTIR spectroscopy using an EO-SXB IR spec-trometer with a resolution of 4 cm-1 in the range 400-4000 cm-1.
2. UV-Visible
The absorption spectra of the films were recorded using a Shimadzu UV–Visible spectrometer.
3. Antibacterial test
In our study, Agar disc diffusion testing, 26 was
employed for the determination of antibacterial activities of pure PVK and PVK-TiO2 composite. It
is a simple and practical method, and is well-stan-dardized. The test is performed by applying a bacterial inoculum of approximately 1–2×10⁸CFU/mL to
the surface of a 150 mm diameter Mueller-Hinton agar plate. Fixed concentration and paper disks are placed on the inoculated agar surface. Plates are incubated for 16–24 h at 37°C prior to the determination of results. The zones of growth inhibition around each of the disks are measured to the nearest millimeter. The diameter of the zone is related to the diffusion rate of the antibacterial agent through the agar medium.
4. The electrical conductivity
For this, we used a resistivity type CMT-SR 2000N, which is a fully automatic system for measuring the electrical resistance of the conductive layers and semiconductors. The measurement is based on the four-point method. This technique is generally used because of its simplicity and its effectiveness.
5. Ultraviolet Resistance of TiO2
in the poly(N-vinylcarbazole)materials
In order to prove the ultraviolet resistance of TiO2 in the Poly (N-vinylcarbazole) materials, the
films of PVK, PVK-TiO2 were exposed to UV light
lamp of 32W of which the wavelength was between 300 and 400 nm for 120h and 300h, and the distance between the UV light and the samples was kept at
20 cm. The ultraviolet resistance of TiO2 in the
PVK materials was investigated using an EO-SXB IR spectrometer.
6. Morphological Characterization (Scanning electron microscopy):
Scanning electron microscopy (SEM) is currently the most used in topography on the microscopic scale. A JEOL 7001 F electron microscope (SEM) was used to observe the morphology of PVK, PVK-TiO2 composites at an accelerating voltage of 12 kV.
RESULTS AND DISCUSSION UV-Visible Analysis
UV-Visible spectra of pure PVK film and doped TiO2 Polymer exhibit absorption in ultraviolet region
with maximum absorption as shown in Fig. 1. It is clear that the absorbance increases with the increase of TiO2 concentration in the matrix, and the
PVK-TiO2 composites doped with 5.10-2M of TiO2 gave
higher absorbance value. Results are derived from the charge transfer mechanism between PVK and TiO2 according to the proper concentration of the
pn-heterojunction.6, 27 300 350 400 450 500 550 600 0 1 2 3 4 Absor b an ce (a. u ) Wavenumber (cm-1) (a) (b) (c) (d)
Fig. 1 – UV-Visible spectra of (a)Pure PVK ,(b) PVK/10-2M
TiO2, (c) PVK/3.10-2M TiO2 and (d) PVK/5.10-2M TiO2.
FTIR analysis
FTIR spectroscopy is a useful tool for determining the extent of the interaction between the polymer and the nanocrystals. Fig. 2 presents the FTIR spectra of PVK, and PVK-TiO2 showed the following
is due to the Aromatic C=C stretching frequency of PVK. Peak 1442 cm-1 is associated with the vibration deformation of the CH bonds of the aromatic group. The band at 1326 cm-1 for pure PVK is attributed to CH2 deformation.
The band at 1223cm-1 is a sign for C-N
stretching of N-vinylcarbazole vibration. The band at 741 cm-1 is related to the rocking vibration of
CH2 group. The ring deformation of substituted
aromatic structure is observed at 704 cm-1. 6, 32
However, for the composites PVK-TiO2, similar
peaks with little variation on the stretching frequencies were observed when compared to the control containing PVK only; However, a slight shift in the C-H stretching frequency, from 3058 cm−1 for
the pure PVK to 3071 cm−1 for the nanocomposite,
as well as a decrease in the peak intensity is observed. This therefore suggests that the integrity of the polymer is maintained; nevertheless, some interaction between the polymer and the TiO2 is still evident
and this bodes well with the morphology observed in the SEM. This result is in agreement with the work of Govindraju. S et al. 28
5000 4000 3000 2000 1000 0 C-H C-N C-H C-C C-H Tra n smit tance ( a .u .) Wavenumber (cm-1) (d) (c) (b) (a) Fig. 2 – IR spectra of : (a) Pure PVK, (b)PVK/10-2M TiO2,
(c)PVK/3.10-2M TiO2 and (d) PVK/5.10-2M TiO2.
Antibacterial Analysis
The antibacterial activity was determined by measuring inhibition zone diameters (mm) (Fig. 3, and Fig. 4), which were evaluated according to the parameters suggested by Alves et al.29, 30 (<9 mm:
inactive; 9–12 mm: less active; 13–18 mm: active ;> 18 mm: very active).
(a) (b) (c) (d) Fig. 3 – Zone of inhibition by different concentrations of PVK/TiO2 against (a): Pseudomonas aeruginosa, (b): SARM, (c):
Escherichia coli, (d): Bacillus subtilis.
The inhibition zones of the antibacterial activity of PVK pure and doped with 10-2M TiO
2, 3.10-2M TiO2,
5.10-2M TiO
2 and the control test are reported in Table 1. Table 1
Inhibition zones in millimeter of the antibacterial activity of Poly (N-vinylcarbazole) pure and doped with 10-2M, 3.10-2M, 5.10-2M TiO
2 and control Escherichia coli ATCC 25922 Bacillus subtilis ATCC 6633 Pseudomonas aeruginosa ATCC27853 Staphylococcus aureus ATCC43300
Control test No inhibition No inhibition No inhibition No inhibition
Poly(N-vinylcarbazole ) pure No inhibition No inhibition No inhibition No inhibition
Poly(N-vinylcarbazole ) +10-2M TiO2 6.50±0.41 6.33±0.41 6.23±0.41 5.88±0.41
Poly(N-vinylcarbazole ) +3.10-2M TiO2 7.33±0.24 8.01±0.24 7.04±0.24 6.00±0.24
Poly(N-vinylcarbazole ) +5.10-2M TiO2 9.58±0.24 7.58±0.24 8.11±0.24 6.71±0.24
The antimicrobial activity against gram negative and gram positive bacteria increased with the increase in the concentration of TiO2, and the
maximum inhibition of bacteria growth was observed in PVK-TiO2 5.10-2M composites. This is
due to the higher concentration of TiO2, to the
activated surface area and the better dispersion of TiO2 in PVK (confirmed with SEM). The zone of
inhibition was not observed in pure PVK, which indicated that the essential activity is due to the TiO2 concentration.
33
Fig. 4 – Antibacterial activity against gram positive and gram negative bacteria of PVK+10-2M TiO2,
PVK+3.10-2M TiO2, PVK+5.10 -2
M TiO2.
Ultraviolet resistance of TiO2 in the Poly
(N-vinylcarbazole) materials
a) Influence of the irradiation time on PVK
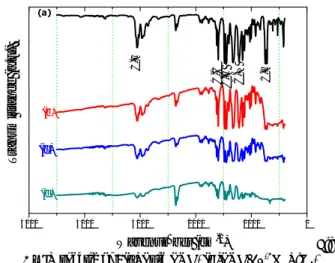
The effects of (UV) light irradiation on pure PVK compared with control device (PVK) without UV light irradiation have been investigated. Fig. 5 and Fig. 6 show IR spectra of pure PVK polymer thin films without and with UV irradiation at 300 and 400 nm for 120h and 300h at 25°C.
1000 2000 0 20 40 60 80 100 1200 1220 1240 1260 (a) T rasm it ta nce ( a.u .) Wavenumber (cm-1) 1224 cm-1 (b) (c) (B) 32003300340035003600 Tra s mi tt an ce ( a.u .) Wavenumber (cm-1) 3 417 cm-1 (a) (b) (c) (A) (3) (2) (1) Wavenumber (cm-1) T ra s mitta n c e (%) (3) PVK+300 h UV irradiation (2) PVK+120 h UV irradiation (1) PVK without UV irradiation 1720 cm-1
Fig. 5 – Comparison of IR spectra of pure PVK polymer thin films (5 µm) caused by photolysis irradiation time
at (300 and 400 nm) for 120h and 300h at 25C°.
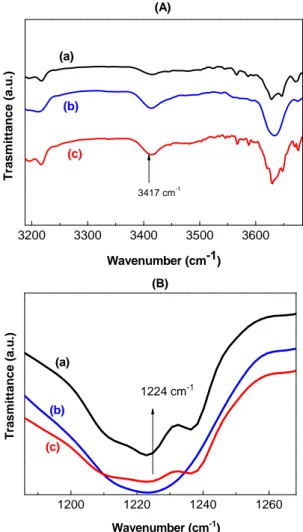
Intensities of the binding energy peaks increased as the time of UV irradiation increased (120h and 300h). These suggest that the scission of molecular chain of PVK developed, such result had been already reported by Rivaton et al.14 and the density of states in valence band increased as the time of UV irradiation increased. An irradiated PVK film should also be photolysed long (over 100 hours of irradiation) prior to observing significant developments in infrared spectrum. Firstly, the changes are mainly observed with appearance of two peaks one at 1720 cm-1 corresponding to carbonyl groups and the other at 3417 cm-1, which was attributed to the vibration of the N-H bond of a primary amine (symmetrical elongation). At the same time we observe a decrease in intensity of all bonds characteristic of aromatic cycle (1450, 1480, 1595, 1623, 1850, 1880, 1920, 3080, 3058, 3022 cm-1), a decrease in the intensity of the band at 1224 cm-1 corresponding to the breaking of the C-N bond and a lower aliphatic CH.10-14 3200 3300 3400 3500 3600 Tras m it tance (a.u. ) Wavenumber (cm-1) 3417 cm-1 (a) (b) (c) (A) 1200 1220 1240 1260 (a) T ra s mi ttan ce (a.u .) Wavenumber (cm-1) 1224 cm-1 (b) (c) (B)
Fig. 6 – Changes in the IR spectra of (a) PVK film (5 µm), (b) PVK film (5 µm) caused by photolysis for 120h at 25°C, (c) PVK film (5 µm) caused by photolysis for 300h at 25°C for:
(A) Evolution of the IR spectra in the 3200-3700cm-1 region,
b) Influence of addition of TiO2 on
photo-degradation of PVK
Fig. 7 and Fig. 8 illustrate infrared spectra of pure PVK and PVK-TiO2 before and after exposure
to UV irradiation for 120h and 300h at 25°C (1500-2000cm-1 region) and (2000-3600cm-1 region).
1680 1740 1800 1860 1920 1980 T ransmi tt a nce ( a .u .) Wavenumber (cm-1) (A) (a) (b) (c) (d) (e) 1720 cm-1 1680 1760 1840 1920 2000 Transmit tance ( a .u .) Wavernumber (cm-1) 1720 cm-1 (B) (d) (e) (c) (b) (a)
Fig. 7 – Evolution of the IR spectra in the 1500-2000cm-1 region of : (a)- pure PVK film
,(b)-PVK+UVirradiation,(c)-PVK+UVirradiation+10-2M TiO2
,(d)-PVK+UVirradiation+3.10-2M TiO2,(e)- PVK+UV
irradiation+5.10-2M TiO2 at 25°C photolysis (A) :120h at 300-
400 nm, (B) : 300h at 300- 400 nm.
The evolution of the absorption bands at 1720 and at 3417cm-1 from FTIR analysis showed that UV-irradiation induced significant photodegradation for PVK. However, with the incorporation of TiO2
nanoparticles into the PVK materials, the extent of the photodegradation was significantly reduced due to the UV light screening effects offered by the TiO2 nanoparticles (Fig. 7, 8) and by the
concen-tration of TiO2. We can note that the TiO2
nanoparticles absorb the UV radiation and hence reduce the UV intensity, thus promoting the significant improvements on the photodegradation resistance of PVK-TiO2 to UV-irradiation. 3000 3300 3600 30 60 90 (e) (d) (c) (b) Wavenumber (cm-1) T ra s m itta n c e (% ) 3417cm-1 (a) (C) 3000 3300 3600 30 60 90 (e) (d) (c) (b) Wavenumber (cm-1) Tr a s mitta nce (%) 3417cm-1 (a) (D)
Fig. 8 – Evolution of the IR spectra in the 2000-3600cm-1 region of : (a)- pure PVK film , (b)-PVK+UV irradiation,
(c)-PVK+UV irradiation+10-2M TiO2,
(d)-PVK+UV irradiation+3.10-2M TiO
2, (e)- PVK+UV
irradiation+5.10-2M TiO2 at 25°C photolysis
(C) :120h at 300–400 nm, (D) : 300h at 300–400 nm.
Electrical resistance measurement (DC electrical conductivity)
The electrical resistance (ER) and electrical conductivity of PVK, PVK-TiO2 composite before
and after being exposed to UV irradiation obtained by the four-point method are reported in (Table 2 and Fig. 9).
Electrical resistance measurement (DC electrical conductivity)
The electrical resistance (ER) and electrical conductivity of PVK, PVK-TiO2 composite before and after
being exposed to UV irradiation obtained by the four-point method are reported in (Table 2 and Fig. 9).
Table 2
Electrical resistance (ER) and electrical conductivity of PVK, PVK-TiO2 without and with UV irradiation
at 300 and 400 nm for 120h and 300h at 25C°
Sample Electrical resistance (ER) ( Ω.cm) (DC electrical conductivity)(S/cm)
PVK pure 2.42E+04 4.13-05 PVK 10-2M TiO 2 1.13E+04 8.85-05 PVK 3.10-2M TiO 2 1.23E+04 8.13-05 PVK 5.10-2M TiO 2 1.51E+04 6.62-05
PVK pure at 120h ( UV- R) 2.36E+04 4.23-05
PVK 10-2M TiO 2 at 120h(UV- R) 1.51E+04 6.62-05 PVK 3.10-2M TiO 2 at 120h(UV- R) 1.35E+04 7.40-05 PVK 5.10-2M TiO 2 at 120h (UV- R) 1.54E+03 6.49-04
PVK pure at 300h (UV- R) 2.34E+04 4.27-05
PVK 10-2M TiO 2 at 300h(UV- R) 1.81E+04 5.52-05 PVK 3.10-2M TiO 2 at 300h(UV- R) 9.20E+03 1.08-04 PVK 5.10-2M TiO 2 at 300h( UV- R) 1.44E+03 6.94-04 0 1 2 3 4 5 0,0 8,0x10³ 1,6x10⁴ 2,4x10⁴ El ec tri ca l r esi st an ce (ER ) (Oh m .c m) Concentration of TiO2 (*102M) PVK PVK at 120h (UV-R) PVK at 300h(UV-R) (A) 0 1 2 3 4 5 0,0 1,0x10⁻⁴ 2,0x10⁻⁴ 3,0x10⁻⁴ 4,0x10⁻⁴ 5,0x10⁻⁴ 6,0x10⁻⁴ 7,0x10⁻⁴ DC e lectr ica l Con ducti vi ty (S/ cm) Concentration of TiO2 (*10 2 M) PVK PVK at 120h (UV-R) PVK at 300h (UV-R) (B)
Fig. 9 – (A) Electrical resistance (ER), (B) DC electrical conductivity (S/cm) of PVK, PVK/TiO2
without and with UV irradiation at 300 and 400 nm for 120h and 300 h at 25°C. The values of the resistances are comparable to
those found in the literature.5, 31 Moreover, the electrical resistance (ER) decreased with the increasing of the concentration of TiO2. This decrease is significant
at 300 hours of exposure of the PVK to UV irradiation. The exhibition of PVK to UV irradiation also makes it conductive. The PVK is the first known polymeric photoconductor. The absorption of radiation
generates charge carriers whose displacement is res-ponsible for the conductivity. Poly (N-vinyl-carbazole) is a transporter of holes. These “holes” are related to the cationic radicals delocalized on the carbazyls. The displacement is done by electron jump between nuclei carbazyls of the same chain or of similar chains. PVK is a photo-conductor intrinsic in the ultraviolet wavelength range. It is possible to obtain a photo-
conductor in the visible from PVK by addition of a pigment or electron accepting molecule.
Morphology of thin films properties
as function of TiO2 concentration
Fig. 10 shows SEM images of TiO2 samples,
and a monodispersion of nanoparticles with an average particle size of about 15 to 20 nm can be seen. Consequently, the TiO2 nanoparticles have a spherical
shape.
Fig. 11 (a) represents the microstructure of the PVK thin films with pores and with high
connectivity which are clearly observed. Macropores can be evaluated as almost cylindrical cavities with an average diameter of 500 nm. Fig. 11 (b) and 11 (c) shows the SEM images of PVK-TiO2 samples. As shown by the micrographs, the
TiO2 nanoparticles are strictly confined in the
pores and the occupancy rate depends largely on the concentration. When the concentration of TiO2
largely dominates (5.10-2M), the clusters of supersaturated nanoparticles grow on top of the pores where further maturation occurs by diffusion into and from the polymer network, as can be seen from Figure 11(d).34
Fig. 10 – SEM image of TiO2 nanoparticles.
(c) (d) Fig. 11 – SEM image of; (a) pure PVK; (b) PVK: 10-2M TiO
2;
(c) PVK: 3.10-2M TiO2; and (d) PVK: 5.10-2M TiO2 thin films.
CONCLUSION
The aim of the present work was to study the influence of the concentration of TiO2 inside a
PVK matrix via a bath deposition method onto the glass substrates (ITO). For this purpose, the FTIR and UV-visible techniques were used to confirm the complexation of the composite.
The Electrical resistance values are on average comparable to those found in the literature. The sample PVK-TiO2 5.10
-2
M exhibits higher antibacterial activity against Escherichia coli. The chemical structure of TiO2 and the fine morphology
and a good dispersion of the particles in the matrix could explain the bactericidal activity of the PVK-TiO2 composite.
Photodegradation of a film PVK causes significant change in its infrared spectrum after exposure to UV. This leads to an increase in conductivity and a decrease in resistivity. We can note that the addition of TiO2 particles absorbs the UV irradiation and
hence reduces its effect on the material, thus promo-ting the significant improvements on the photo-degradation resistance of PVK-TiO2 to UV-irradiation.
REFERENCES
1. J. L. Martin, J. D. Bergeson, V. N. Prigodin and A. J. Epstein, Synthetic. Met., 2010, 160, 291-296. A. Kumasi, YI. H and A. Iraqi, J. Polym .Ski A1., 2007, 45, 5957-5967.
2. J. V. Grazulevicius, P. Strohriegl, J. Pielichowski and K. I. Pielichowsk, Prog. Polym. Sci., 2003, 28, 1297-1353.
3. S.Oh. Kyoung, B. Won and K. Hwayong, Polymer., 2007,
48, 1450-1454.
4. N. Ballav and M. Biswas, Synthetic Met., 2003, 132, 213-218.
5. H. Yangang, Wu. Gang, Ch. Hongzeng and W. Mang, J.
Appl. Polym. Sci., 2008, 109, 882-888.
6. E. Pérez-Gutiérrez, M .J. Percino, V.M. Chapela and J. L. Maldonado, E. Thin Solid Films, 2011, 519, 6015-6020. 7. S. Touihri, J. C. Bernède, P. Molinie and D. Legoff,
Polymer., 2002, 43, 3123-3129.
8. Tu. Ming-Lung, Su. Yan-Kuin, Wu. Shang-Shang, Gu.Tzung-Fang, W. Ten-Chin and H. Chun-Yuan,
Synthetic. Met., 2011, 161, 450-454.
9. B. Pierre-Olivier, R. Agnes, T. Sandrine and G. Jean-Luc, J.
Phys.Chem B., 2012, 19, 116(2), 802-812.
10. T. Aurélien, B. Pierre-Olivier, W.W.Ch. Pascal, T. Sandrine, R. Agnès, G. Jean-Luc, B. Serge and L. Mario,
Adv. Energy Mater., 2013, 3, 478–487.
11. I. Akira, O. Ken-Ichi and K. Shig Kazu, B. Chem. Soc.
Jpn., 1979, 52, 2218.
12. R. F. Cozzens, J. Am. Chem. Soc., 1981, 137.
13. A. Rivaton, B. Mailhot, G. Derderian, P. O. Bussiere and J. L. Gardette, Macromolecules, 2003, 36, 15, 5815–5824. 14. W.Zhaobo, Li. Guicun, P. Hongrui and Z. Zhikun, Mater.
Sci., 2005, 40, 6433.
15. V. Prashant and Kamat, Chem. Rev., 1993, 93, 267-300. 16. M. C. R. Jeanette, K. J. R. Peter and A. L. Linda, A:
Chemistry, 2005, 175, 51-56.
17. A. G Rincon and C. Pulgarin, Appl. Catal. B-Environ.,
2003, 44, 263-284.
18. A. Kubacka, M. Ferrer, A. Martınez-Arias and M. Fernandez-Garcı, J. Amer. Chem. Soc., 2007, 7, 2529-2534.
19. W. Bahloul, M. Flavien, B. L. Véronique and C. Philippe,
Mater. Chem. Phys., 2012, 134, 399– 406.
20. Q. Cheng, C. Pavlinek, S. Li, P. Vladmir, S. Petr and W. Huanbing, Appl. Surface. Sci., 2010, 252, 4154-4160. 21. W. Su, S. S. Wei, S. Q. Hu. J. X Tang and J. Hazard,
Mater., 2009, 172, 716-720.
22. Y. Liu, X. Wang, F. Yang and X. Yang, Micropor.
23. R.O. Paulina, M. S. Agata, K. Lukasz, K. Ewa and W. M. Antoni., Pol J Chem Technol., 2016, 18, 56–64.
24. F. Ahmed, C. M. Santos, R. A. M. V. Vergara, M. C. R. Tria, R. Advincula and D. F. Rodrigues, Environ. Sci.
Technol., 2012, 46, 1804-1810.
25. A. Alves, T. M. Silva, A. F. Brandão, M. Grandi, T. S. M. Smânia, E. F. A. Smânia and Jr. A. Zani, Mem. I.
Oswaldo. Cruz., 2000, 95, 367–373.
26. W. L. Sang and H.C. Seung, Sensors., 2016, 16, 1, 74. 27. S. Govindraju, N. Ntholeng, K. Ranganathan, M. J.
Moloto, L. M. Sikhwivhilu and N. Moloto, J. Nanomater.,
2016, 9592189, 8.
28. S. Gaamoune, W. Nouioua and O. Djaout, A. J. B. P. A.
D., 2015, 3,2231-2560.
29. S. Ankita, D. Amit and K. Rajnish, J. Porous. Mater.,
2016, 23, 851–855.
30. C. Basavaraja, Jo. EunAe, K. Bong Sung, H. Mallikarjuna and H. Do. Sung, Bull. Korean.Chem. Soc., 2010, 31, 10, 2967.
31. M. Catherine, K. M Santos and A. CuiFarid, Macromol.
Mater. Eng., 2012, 77204-5003.
32. A. Razi and S. Meryam, I.J. I. R. S. E. T., 2013, 2, 8, 2319-8753.
33. A. Benchaabane, Z. Ben Hamed, F. Kouki, M. A. Sanhoury, K. Zellama, Z. Andreas and H. Bouchriha, J.