CARACTÉRISATION DES PÉRIODES DE SÉCHERESSE SUR LE DOMAINE
DE L'AFRIQUE SIMULÉE PAR LE MODÈLE RÉGIONAL CANADIEN DU
CLIMAT (MRCC5)
MÉMOIRE PRÉSENTÉ
COMME EXIGENCE PARTIELLE
DE LA MAÎTRISE EN SCIENCES DE L'
ATMOSPHÈRE
PAR BESSAM BOUAGILA
A
ved/ssement
La diffusion de ce mémoire se fait dans 1&1 respect des droits de son auteur, qui a signé le formulaire Autorisation ds rapioduirs st ds diffuser un travail de recherche de cycles c;up~rfaurs (SDU-522- Rév.01-2006). Cette autorisation stipula que ccconformément
à
l'article 11 du Règlement no 8 dea études de cycles supérieurs, [l'auteur] concèdeà
l'Université du Québecà
Montréal une licence non exclusive d'utilisation et de . publication de la totalité ou d'une partie Importante de [son] travail da recherche pour dea fins pédagogiques at non commerciales. Plus précisément, [l'auteur) autorise l'Université du Québec à Montréal à reproduire, diffuser, prêter, distribuer ou vendre dea copies de. [son] travail de rechercheà
dea flna non commerciales sur quelque support que ce soit, y compris l'Internet Cette licence et cette autorisation n'entrainent pas une renonciation da Qa] part [de l'auteur] à [sea) droits moraux nià
[sea] droits de propriété intellectuelle. Sauf ententè contraire, [l'auteur] conserve la liberté de diffuser et de commercialiser ou non ce travail dont [il] possède un exemplaire.,REMERCIEMENTS
Je tiens à remercier ma directrice de recherche, Laxmi Sushama, pour rn' avoir permis de travailler sur ce projet et pour ses bons conseils. J'aimerais aussi remercier tous mes collègues qui ont su m'aider que ce soit au niveau de la recherche, mais aussi pour le support moral.
Je souhaiterais également remercier le groupe des Sciences de l'Atmosphère d'avoir mis à ma disposition les outils nécessaires pour pouvoir effecteur ce projet. Un gros merci à ma famille et à mes amis pour leur support infini.
Finalement un merci particulier à Jacinthe pour m'avoir soutenu et encouragé durant ce long processus.
REMERCIEMENTS ............................................................... 111
LISTE DES FIGURES ... VII LISTE DES TABLEAUX ... IX LISTE DES ACRONYMES ... XI LISTE DES SYMBOLES ... XIII RÉSUMÉ ...
xv
CHAPITRE I INTRODUCTION ... 1 1. 1 Problématique générale ... 1 1.2 Méthodologie ... 5 1.3 Objectifs du mémoire ... 9 CHAPITRE II ON THE CURRENT AND FUTURE DRY SPELL CHARACTERISTICS OVER AFRICA ... 11Abstract ... 12
2.1 Introduction ... 13
2.2 Mode!, Experimental Configuration, Datasets and Methods ... 15 2.2.2 Observational data ... 17
2.2.3 Methods ... 17
2.3 Results ... 20
2.3 .1 Assessment of Errors and Added Value ... 20
2.3 .2 Projected changes to Dry Spell Characteristics ... 25
2.4 Discussion and conclusions ... 29
Acknowledgements ... 32
FIGURES ... 33
CHAPITRE Ill CONCLUSION ... 45
ANNEXE A EXEMPLE DE CALCUL DU MAXIMUM ANNUEL DE JOUR CONSÉCUTIF SANS PRÉCIPITATION ASSOCIÉ À UNE RÉCURRENCE DE 5 ANS POUR LE CLIMAT PRÉSENT ( 1981-201 0) ... 51 ANNEXES TABLEAUX ET FIGURES COMPLÉMENT AIRES ... 55
Figure
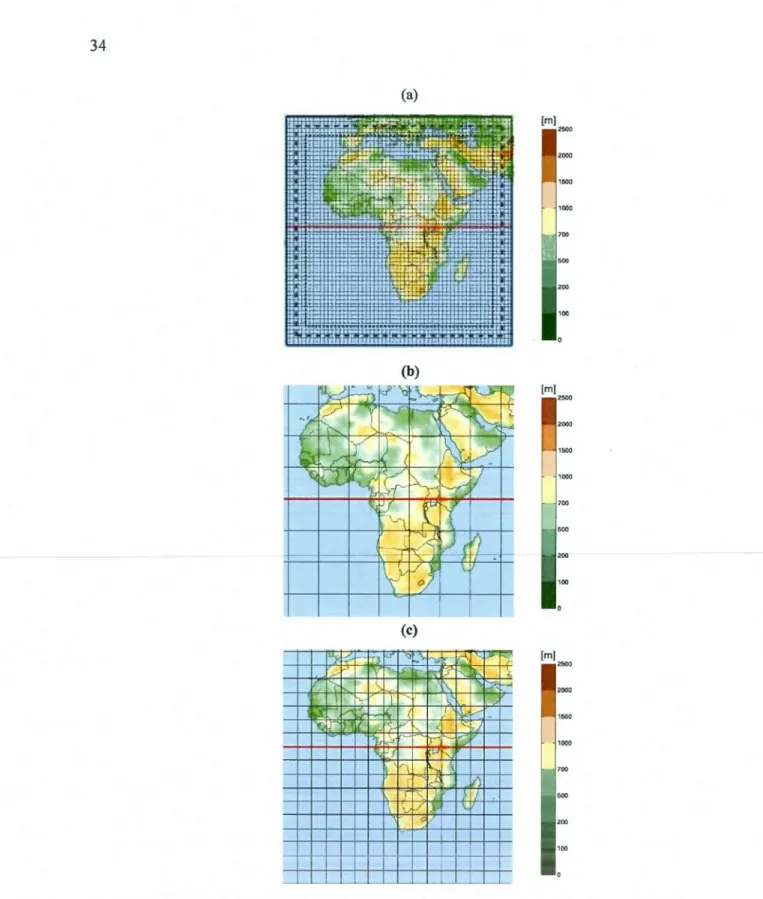
2.1 African simulation domain for (a) CRCM5 at 0.44° horizontal resolution, with only every 5th grid box displayed. The dashed !ines represent the 10 grid-point nesting zone and the dotted li ne represents the domain of interest. The (b) CanESM2 grid at 2.81 o horizontal resolution and ( c) GPCP grid at 1 o horizontal
Page
resolution is also shown. The red horizontalline represents the equator... ... 34
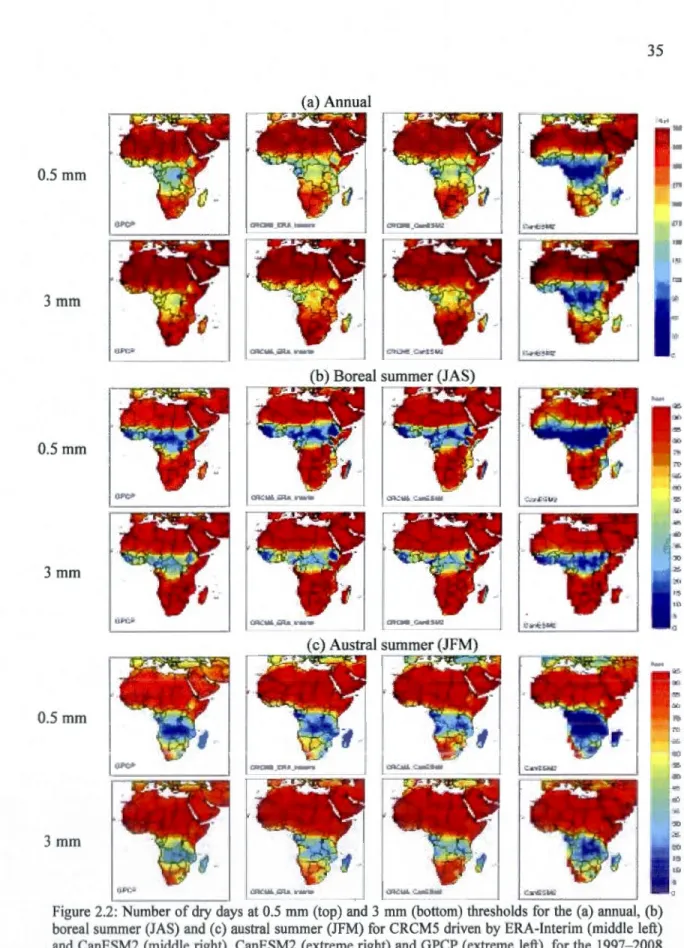
2.2 Number of dry days at 0.5 mm (top) and 3 mm (bottom) thresholds for the (a) annual, (b) boreal summer (JAS) and (c) austral summer (JFM) for CRCM5 driven by ERA-Interim (middle left) and CanESM2 (middle right), CanESM2
(extreme right) and GPCP (extreme left), for the 1997-2008 period. ... 35
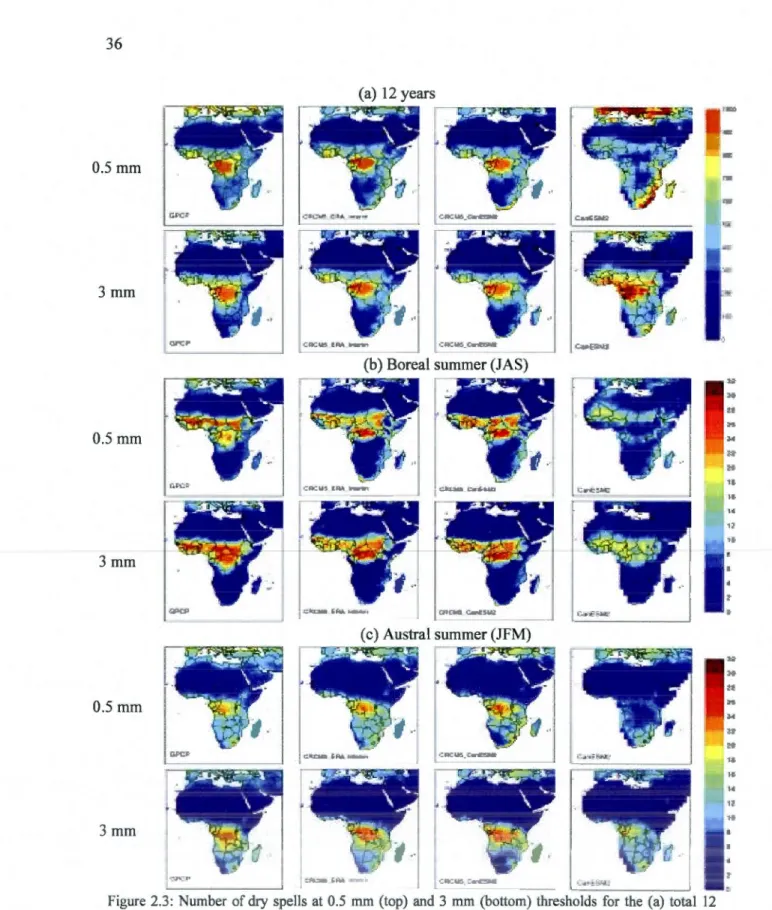
2.3 Number of dry spells at 0.5 mm (top) and 3 mm (bottom) thresholds for the (a) total 12 years, (b) boreal summer and (c) austral summer period for CRCM5 driven by ERA-Interim (middle left), and CanESM2 (middle right), CanESM2
( extreme right) and GPCP ( extreme left), for the 1997-2008 period. ... ... 36
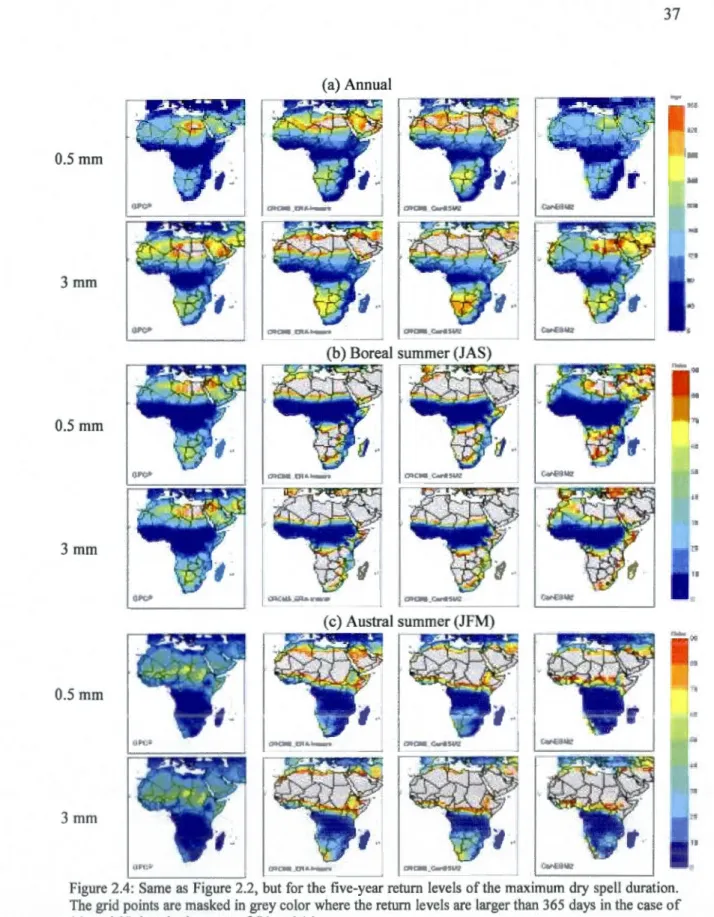
2.4 Same as Figure 2.2, but for the five-year retum levels of the maximum dry spell duration. The grid points are masked in grey color where the retum levels are
larger th an 365 da ys in the case of (a), and 92 da ys in the cases of (b) and ( c )... 3 7
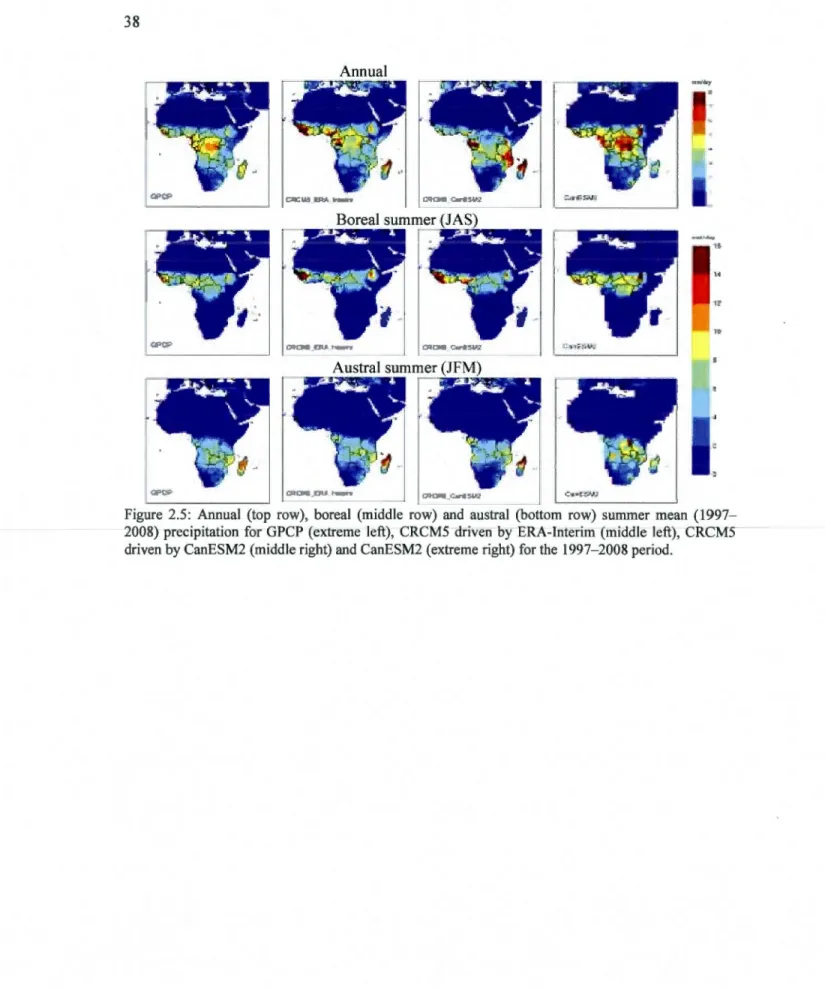
2.5 Annual (top row), boreal (middle row) and austral (bottom row) summer mean (1997-2008) precipitation for GPCP (extreme left), CRCM5 driven by ERA-Interim (middle left), CRCM5 driven by CanESM2 (middle right) and CanESM2
( extreme right) for the 1997-2008 period. .... ... ... .. ... ... ... .... ... .. ... .. . . ... 3 8
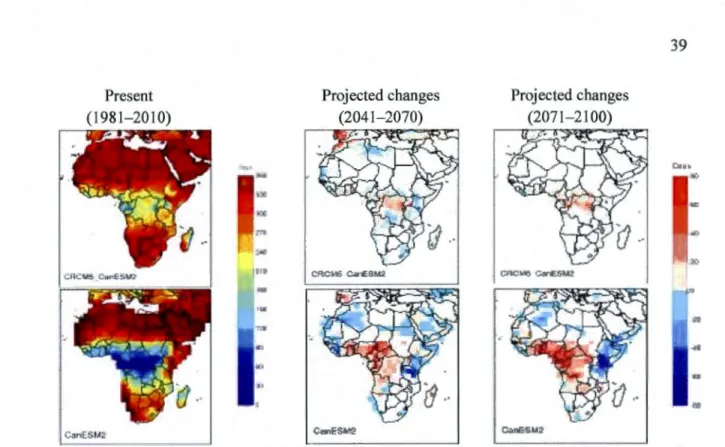
2.6 Annual mean number of dry days as simu1ated by CRCM5 driven by CanESM2 (top panel) and CanESM2 (bottom panel) for the present (1981-2010; left column) and the corresponding projected changes for the 2041-2070 (middle column) and the 2071-2100 (right column) periods for RCP 4.5 scenario for 2 mm threshold. Grid cells where projected changes are not statistically significant
at 95% confidence leve! are shown in white.. ... 39
2.7 Same as Figure 2.6, but for the mean number of dry days for boreal summer.. ... 39
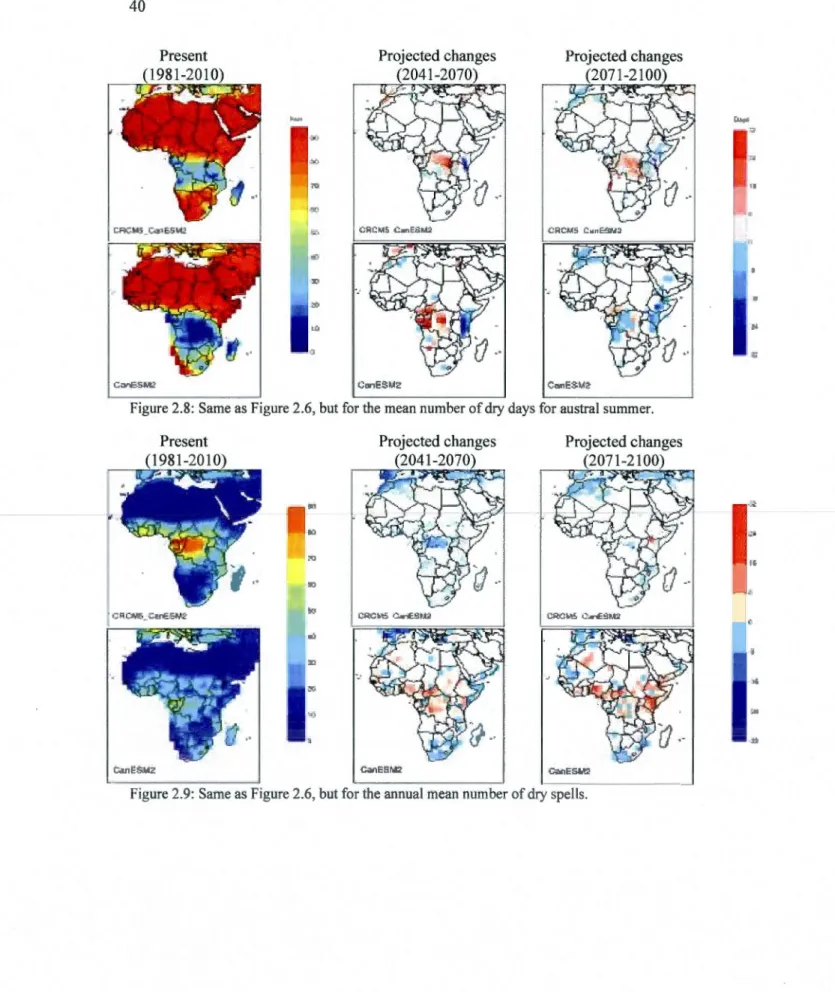
2.8 Same as Figure 2.6, but for the mean number of dry days for austral summer.. ... 40
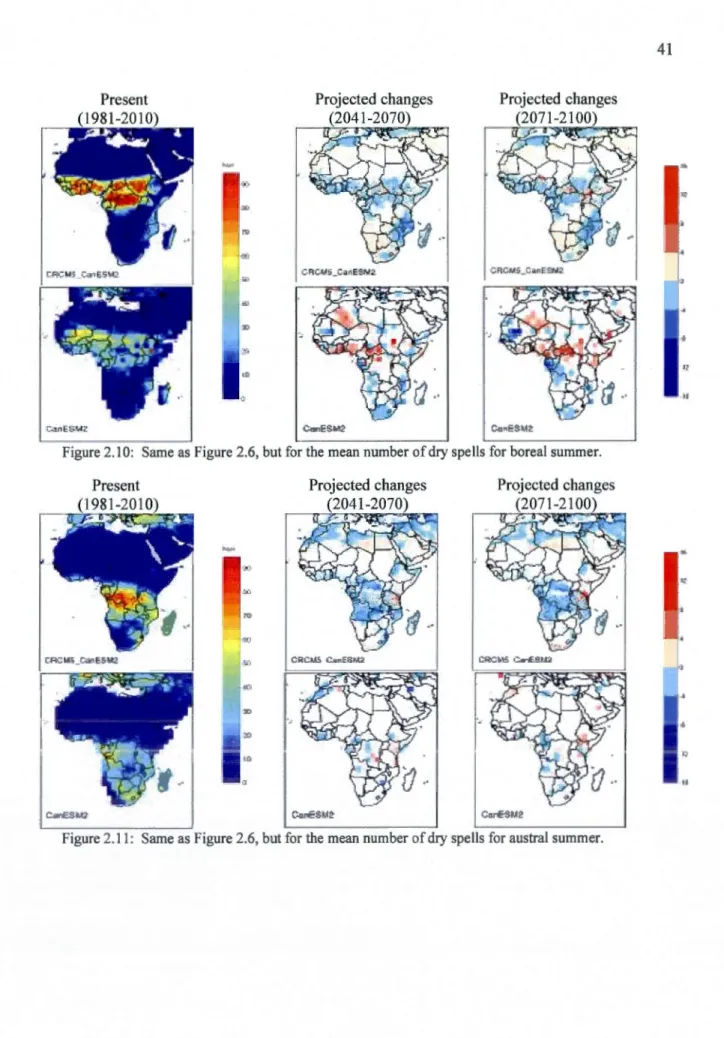
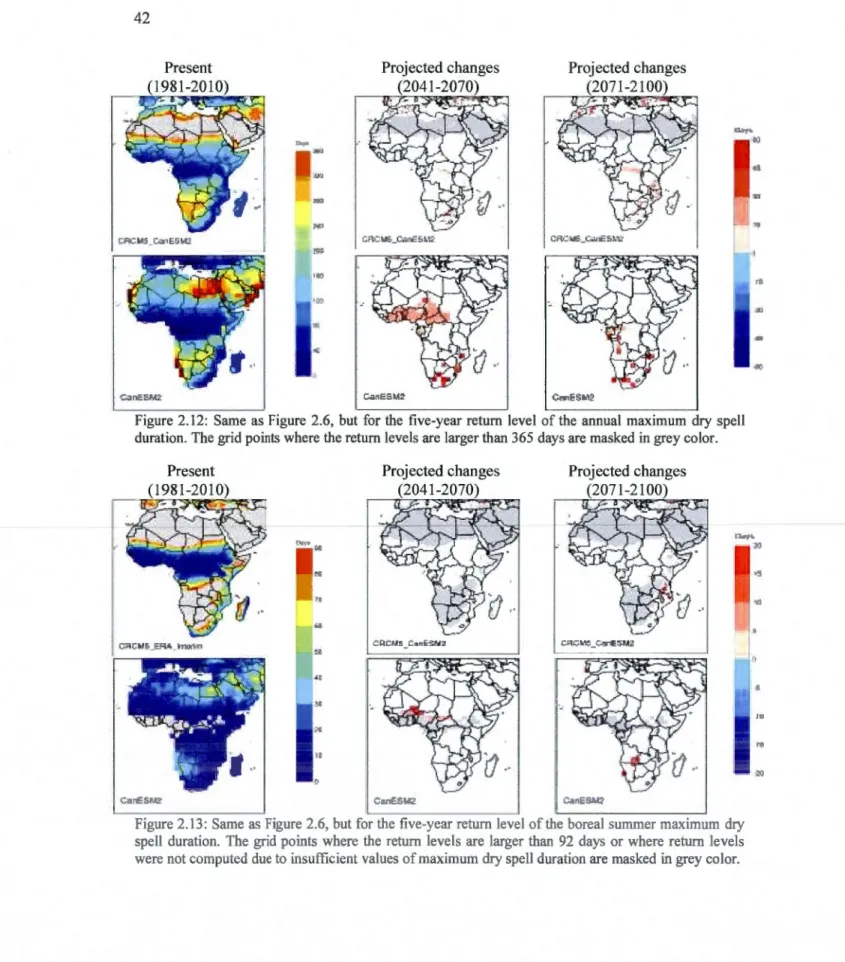
2.10 Same as Figure 2.6, but for the mean number of dry spells for boreal summer... 41 2.11 Same as Figure 2.6, but for the mean number of dry spells for austral summer. .... 41 2.12 Same as Figure 2.6, but for the five-year retum level of the annual maximum dry
spell duration. The grid points where the retum levels are larger than 365 days
are masked in grey color... 42 2.13 Same as Figure 2.6, but for the five-year retum level of the boreal summer
maximum dry spell duration. The grid points where the retum levels are larger than 92 days or where the retum levels were not computed due to insufficient
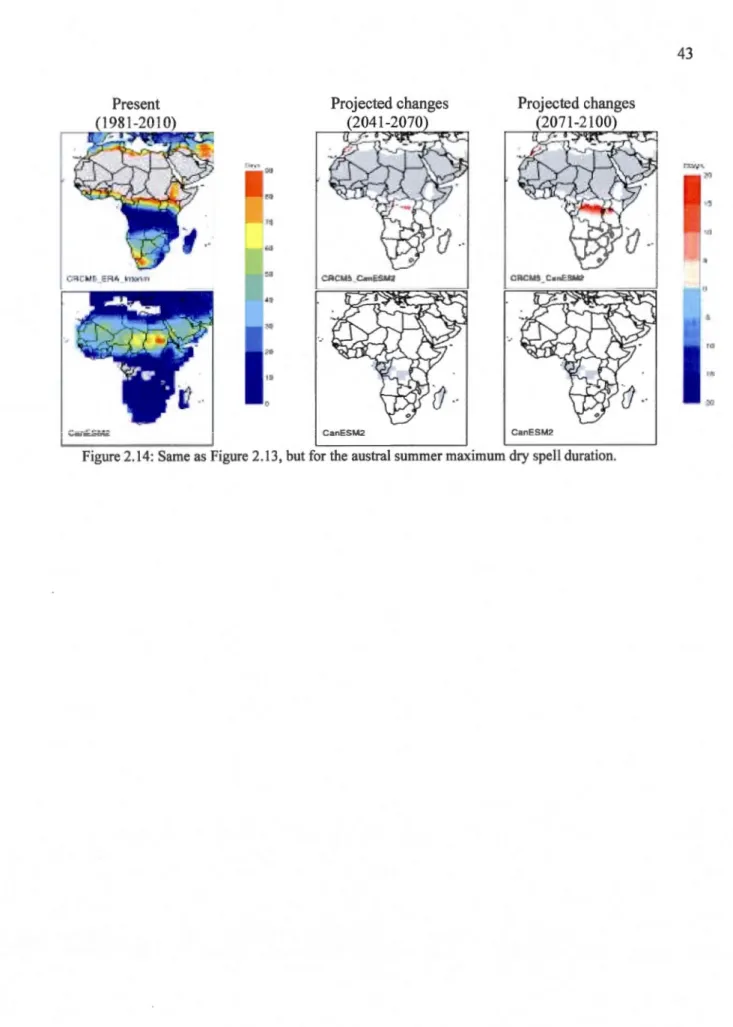
value of maximum dry spell duration are masked in grey color.. ... 42 2.14 Same as Figure 2. 13, but for the austral summer.. . .. . . .. . . 4 3
LISTE DES TABLEAUX
Tableau Page
Al Tableau représentant les 60 valeurs du nombre de jours consécutifs annuel sans précipitation (x) pour le point de grille ( 104,1 09) et pour un seuil de 2 mm. Les résultats sont montrés pour 3 périodes de 30 ans simulés par le MRCC5 piloté
A lB AIACC AFRMIP AMMA CanESM2 CGCM CLASS CO RD EX CRCM5 DARLAM ECMWF ERA-Interim GCM GEM GIEC GPCP GPCC GPD
Scénario d'émission de gaz à effet de serre
Assessment oflmpact and Adaptation to Climate Change
Greater Horn of AFRica Regional Mode! Intercomparison Project African Monsoon Multidisciplinary Analysis
2"d version of the Canadian Earth System Mode! Canadian Global Climate Mode!
Canadian Land Surface Scheme
COordinated Regional climate Downscaling EXperiment The 5th generation of the Canadian Regional Climate Mode!
Division of Atmospheric Research Limited Area Mode! European Centre for Medium-Range Weather Forecasts
European Centre for Medium-Range Weather Forecasts Re-Analysis Global Climate Mode!
Global Environment Multiscale
Groupe d'experts Intergouvernemental sur l'Évolution du Climat Global Precipitation Climatology Project
Global Precipitation Climatology Center Generalized Pareto Distribution
HadRM3H ITCZ IPCC MCG MRC MRCCS PNUE POT PWM RCM RCP RegCM3 SST WAMME WRF ZCIT
Hadley Regional Climate Mode! Inter Tropical Convergence Zone
Intergovemmental Panel on Climate Change Modèle de Circulation Générale
Modèle Régional du Climat
se
version du Modèle Régional Canadien du Climat Programme des Nation Unies pour l'Environnement Peak-Over-ThresholdProbability Weighted Moment Regional Climate Mode!
Representative Concentration Pathway
Regional Climat Mode! from the National Center for Atmospheric Research
Sea Surface Temperature
West African Monsoon Modeling and Evaluation Weather Research and Forecasting
a
N
RL
TLISTE DES SYMBOLES
Paramètre d'échelle
Estimateurs de la probabilité pondérés
Estimateurs théoriques de la probabilité pondérés Paramètre de localisation
Paramètre de forme
Nombre d'occurrence moyen de jour consécutif sans précipitation par année ou par saison
Nombre d'année disponible
Retum leve! (Événement de faible récurrence) Période de retour
Les conséquences des changements climatiques sur la fréquence ainsi que sur l'intensité des précipitations auront un impact direct sur les périodes de sécheresse et par conséquent sur différents secteurs économiques tels que le secteur de l'agriculture. Ainsi, dans cette étude, l'habilité du Modèle Régional Canadien du Climat (MRCC5) à simuler les différentes caractéristiques des périodes de sécheresse est évaluée pour 4 seuils de précipitation soit 0.5 mm, 1 mm, 2 mm et 3 mm. Ces caractéristiques incluent le nombre de jours secs, le nombre de périodes de sécheresse ainsi que le maximum de jours consécutifs sans précipitation associé à une récurrence de 5 ans. Les résultats sont présentés pour des moyennes annuelles et saisonnières. L'erreur de performance est évaluée en comparant le MRCC5 piloté par ERA-Interim aux données d'analyses du GPCP pour le climat présent ( 1997-2008). L'erreur due aux conditions aux frontières c'est-à-dire les erreurs de pilotage du MRCC5, soit par CanESM2 et parERA-Interim ainsi que l'évaluation de la valeur ajoutée du MRCC5 face au CanESM2 sont également analysées. L'analyse de ces caractéristiques est également faite dans un contexte de climat changeant pour deux périodes futures, soit 2041-2070 et 2071-2100 à l'aide du MRCC5 piloté par le modèle de circulation générale CanESM2 de même que par le modèle CanESM2 sous le scénario RCP 4.5. Les résultats suggèrent que le MRCC5 piloté par ERA-Interim a tendance à surestimer la moyenne annuelle du nombre de jours secs ainsi que le maximum de jours consécutifs sans précipitation associé à une récurrence de 5 ans dans la plupart des régions de l'Afrique et une tendance à sous-estimer le nombre de périodes de sécheresse. En général, l'erreur de performance est plus importante que l'erreur due aux conditions aux frontières pour les différentes caractéristiques de périodes de sécheresse. Pour les régions équatoriales, les changements appréhendés par le MRCC5 piloté par CanESM2 pour les différentes caractéristiques de périodes de sécheresse et pour deux périodes futures (2041-2070 et 2071-21 00), suggèrent une augmentation significatives du nombre de jours secs ainsi que du maximum de jours consécutifs sans précipitation associé à une récurrence de 5 ans. Une diminution significative du nombre de périodes de sécheresse est aussi prévue.
Mots clés : Modèle Régional du Climat; Changement climatique; Jours secs; Nombre de périodes de sécheresse; Événement de faible récurrence; Afrique
fNTRODUCTION
1.1 Problématique générale
Le climat sur le continent de l'Afrique est variable dans l'espace et le dans temps; dans l'espace car il est caractérisé par une grande variété dans les climats; équatorial au centre, aride au niveau des tropiques et tempéré à chaud en Afrique du Nord et en Afrique austral. Le climat est également variable dans le temps car il évolue à travers les saisons avec le déplacement de la Zone de Convergence Intertropical (ZCIT) générant les moussons. Cette zone transitoire migre à sa position la plus méridionale durant l'été austral (Janvier-Février-Mars) et atteint sa position la plus septentrionale pendant l'été boréal (Juillet-Aout-Septembre). Cette variation saisonnière de la ZCIT est complexe car celle-ci ne revient pas nécessairement à la même position d'une année à l'autre. Les régions semi-arides sont donc vulnérables à ces changements interannuels. L'étude de Matha et al. (1980) a d'ailleurs montré que lorsque la ZCIT ne remonte pas assez au nord, des répercussions notables sont présentes pour les récoltes au Sahel. En effet, en 1979 plus de 100 000 personnes sont décédées dû à une insuffisance alimentaire. Ainsi, comprendre et prévoir cette variation
saisonnière de la ZCIT fait partie des nombreux défis des spécialistes du climat.
Ces changements en termes de quantité et de distributions des précipitations peuvent
avoir un effet notable sur les périodes de sécheresse et de pluie ce qui affectera nécessairement plusieurs secteurs économiques tels que l'agriculture. En effet, dans plusieurs régions de l'Afrique, l'agriculture est très dépendante de l'apport quotidien de précipitation.
Par exemple dans la Come africaine, la vulnérabilité face à la demande en eau est amplifiée par le fait que la population vit essentiellement de l'agriculture et de l'élevage de bétails (Anyah et al., 201 0). Or dans cette région, les observations ainsi que les projections futures dénotent une diminution de la précipitation durant la saison sèche ce qui par conséquent pourrait causer plus d'événements de sécheresse.
En se basant sur 21 modèles globaux pour le scénario d'émission A1B, le 4e rapport du Groupe d'experts Intergouvernemental sur l'Évolution du Climat (GIEC) prévoit des changements de température et de précipitation entre la période future (2080-2099) et la période de référence (1980-1990). Pour le GIEC, le scénario d'émission A1B correspond à une croissance économique rapide s'appuyant sur des sources d'énergie équilibrées entre fossiles et autres (nucléaires, renouvelables). En ce qui concerne l'Afrique, la distribution spatiale de la température annuelle augmentera d'ici la fin du siècle et ce, de façon bien plus importante qu'ailleurs dans le monde. Dans ce scénario d'émission, les climats plus arides tels que les déserts se réchaufferont davantage que les zones plus humides de l'équateur. La précipitation annuelle va quant à elle diminuer dans les pays méditerranéens ainsi qu'au nord du Sahara. Un assèchement est également projeté pour l'Afrique du Sud ainsi que le long de la côte Ouest africaine alors qu'une augmentation de la précipitation est prévue en Afrique de l'Est. Ces conclusions restent toutefois précaires car selon le GIEC, les Modèles de Circulation Générale (MCG) ont de la difficulté à bien représenter les processus clés du climat présent africain. En effet, la surestimation des précipitations dans le sud de l'Afrique, la difficulté à simuler la migration latitudinale de la ZCIT, ainsi que la sous estimation des températures sur l'océan au large du désert de Kalahari, ne permettent pas d'avoir un bon niveau de confiance quant aux conséquences des changements climatiques (GIEC, 2007).
D'autre part, les changements projetés en termes de température et de précipitation vont également avoir un impact notable sur la gestion et la disponibilité des ressources en eau. Une étude faite par le Programme des Nation Unies pour l'Environnement (PNUE) (http://www.grida.no/publications/vg/africa-fr/page/3150.aspx) a montré que d'ici 2025, environ la moitié des pays africains feront face à des stress hydriques; c'est-à-dire que la demande en eau dépassera les ressources disponibles. Parmi ces pays, une partie se retrouvera
même sous le statut de pénurie en eau (moins de 1 000 m3 d'eau par habitant par année). C'est donc dans ce contexte que l'Afrique a été désignée comme le continent le plus vulnérable aux changements climatiques par le GIEC dans son 4e rapport.
Plusieurs études se sont intéressées aux changements appréhendés des précipitations en utilisant les MCG sur différents continents (Bamett et al., 2005; Dai, 2005, Tebaldi et al., 2006). Plus particulièrement, Tebaldi et al. (2006) se sont concentrés sur les extrêmes, en étudiant le nombre de jours secs à l'aide de 9 MCG. Dans cette étude, un jour sec est défini comme étant un jour où la précipitation est inférieure à 1 mm. Malgré les grandes différences entres les MCG, une diminution du nombre de jours secs à l'équateur ainsi qu'une augmentation dans les tropiques sont projetées d'ici la fin du siècle, sous le scénario A1B.
Les MCG sont souvent utilisés afin de simuler la circulation atmosphérique générale, toutefois lorsque l'intérêt est de faire des études d'impacts et d'adaptation, ceux-ci n'offrent pas une résolution adéquate. En effet, c'est particulièrement le cas dans les régions où l'on retrouve une grande diversité dans le type de terrain (montagne, côte, faune). Il a également été montré que les MCG ont de la difficulté à bien représenter les événements extrêmes tels que les fortes précipitations (Hudson and Jones, 2002). En effet, Sun et al. (2005) ont montré que la plupart des MCG surestiment les faibles précipitations (1-1 0 mm/jour) et sous-estiment les événements de fortes précipitations (> 10 mm/jour). Puisque les processus de précipitations convectifs ont lieu à plus fines échelles, l'utilisation d'un modèle à meilleure résolution, tel qu'un Modèle Régional du Climat (MRC) est plus adéquat pour les études d'impacts et d'adaptation.
L'utilisation d'un MRC sur le domaine de l'Afrique est encore aujourd'hui une approche en émergence dû entre autre au manque de ressources de plusieurs pays africains. Plusieurs études se sont tout de même intéressées à simuler le climat de certaines régions de ce continent. Sun et al. (1999) ont étudié la précipitation sur 1 'Est de 1' Afrique à 1 'aide d'un MRC de 60 km de résolution horizontale (RegCM2), Patricola and Cook (2006) se sont intéressés à la dynamique des moussons de l'ouest africain à l'aide du modèle Weather Reseach and Forecasting (WRF) à 90 km de résolution horizontale. Husdon and Jones (2002) ont, quant à eux, examiné le climat de l'Afrique du Sud avec le modèle Hadley Regional
Climate Mode! (HadRCM3) à 50 km de résolution horizontale. D'autres auteurs, tels que Pal et al. (2007), Sylla et al. (2009) et Hernandez et al. (20 12) ont évalué 1 'habilité des différents modèles climatiques régionaux à représenter les processus clés sur tout le domaine de l'Afrique.
Suite aux conclusions du 4e rapport du GIEC, qui font état de la vulnérabilité de l'Afrique face aux changements climatiques, plusieurs projets internationaux ont vu le jour: 1 'AIACC (The Assessment of Impact and Adaptation to Climate Change; Hewiston et al., 2003) ayant pour but de comprendre l'effet des changements climatiques des pays en voie de développement; ENSEMBLE (van der Linden and Mitchell, 2009) ayant, en outre, pour mandat de simuler le climat de l'Afrique de l'Ouest en contexte de changement climatique avec des MRC à 50 km de résolution horizontale; le projet AFRMIP (The Greater Hom of Africa Regional Mode! ; Anyah et al., 2010) ayant pour but d'investiguer les multiples incertitudes des simulations du MRC sur diverses régions d'Afrique; le projet AMMA (The African Monsoon Multidisciplinary Analysis; Redelsperger et al., 2002; Sultan et al., 2003; Van der Linden and Mitchell., 2009) visant à mieux comprendre les moussons africaines; le projet W AMME (West African Monsoon Modeling and Evaluation; Xue et al., 2010, Druyan et al., 2010) évaluant le rôle de l'interaction entre la terre et l'océan sur les moussons africaines en utilisant des MCG et des MRC et finalement, le projet CORDEX (COordinated Regional climate Downscaling EX periment; Giorgi et al., 2009; Jones et al., 2011) qui a été créé afin de fournir un cadre d'évaluation et de vérification de l'efficacité des modèles et de concevoir une série d'expériences destinée à obtenir des projections climatiques pouvant servir aux études d'impacts et d'adaptation, en ce concentrant tout d'abord sur le domaine de l'Afrique. Malgré le récent intérêt porté sur l'étude du domaine de l'Afrique à l'aide des MRC, à ce jour, il existe très peu d'informations portant sur les extrêmes.
Bref, peu d'études se sont intéressées à l'utilisation d'un MRC pour simuler les différentes caractéristiques des périodes de sécheresse sur le domaine de 1 'Afrique. Ainsi, la présente étude s'intéresse aux différentes caractéristiques des périodes de sécheresse incluant le nombre de jours secs, le nombre de périodes de sécheresse ainsi que le maximum de jours consécutifs sans précipitation associé à une récurrence de 5 ans. Le tout est évalué pour
différents seuils de précipitation soit 0.5 mm, 1 mm, 2 mm et 3 mm à l'aide de la
s
e
version du Modèle Régional du Climat Canadien (MRCC). Ces caractéristiques sont simulées de façon annuelle et saisonnière pour le climat présent et le climat futur. La description des différents aspects méthodologiques sont présentés dans la section 1.2 ainsi que les analyses dans le chapitre 3.1.2 Méthodologie
Dans la présente étude, l'analyse des différentes caractéristiques des périodes de sécheresse est réalisée en deux volets. Dans un premier temps, le MRCCS est évalué pour le climat présent (1997-2008), ce qui consiste à quantifier l'habilité du Modèle Régional du Climat (MRC) en termes d'erreur de performance ou bien en termes d'erreur due aux conditions aux frontières et de l'analyse de la valeur ajoutée. Dans un deuxième temps, les différentes caractéristiques des périodes de sécheresse provenant des mêmes simulations sont analysées pour deux périodes futures (2041-2070 et 2071-2100) sous le scénario d'émission de gaz à effet de serre RCP 4.5. Les résultats obtenus pour les deux périodes sont ensuite comparés avec la période de référence afin de saisir l'évolution de ces différentes caractéristiques dans un climat plus chaud.
L'analyse des différentes caractéristiques des périodes de sécheresse annuelle et saisonnière inclut le nombre de jours secs, le nombre de périodes de sécheresse ainsi que le maximum de jours consécutifs sans précipitation associé à une récurrence de 5 ans. Il est à noter que dans cette étude, une période de récurrence de 5 ans a été sélectionnée puisque le nombre d'années disponibles pour les observations est limité à 12 ans. Ainsi le choix d'une plus grande période de récurrence résulterait à une plus grande incertitude. Deux saisons ont été choisies afin de représenter la variation saisonnière des précipitations en Afrique : l'été boréal correspondant aux mois de juin, juillet et août et l'été austral correspondant aux mois de décembre, janvier et février. Dans cette étude, un jour sec est défini comme étant un jour où la quantité de précipitation est plus petite qu'un certain seuil préétabli. Dans le cas présent, les seuils de 0.5 mm, 1 mm, 2 mm ainsi que 3 mm sont sélectionnés. Ce choix méthodologique est toutefois subjectif puisque les seuils sélectionnés varient selon les
auteurs : Beniston et al. (2007) ont défini un seuil de 1.8 mm pour différencier un jour de pluie d'un jour sec sur le domaine de l'Europe; Eun-Soon and Kwon (2007) ont utilisé le seuil de 1 mm sur la Corée et Sushama et al. (20 1 0) ont choisi 0.5 mm, 1 mm, 2 mm et 3 mm sur le Canada. Le choix du seuil peut également être déterminé à l'aide de considérations physiques. Une période de sécheresse est définie comme étant une accumulation de jours secs pour un seuil préétabli. Dans cette étude, le minimum de jour sans précipitation requis pour avoir une période de sécheresse est d'un.
Le maximum de jours consécutifs sans précipitation associé à une récurrence de 5 ans est défini comme étant une estimation statistique du nombre de jours maximum consécutifs sans précipitation qui auraient lieu en moyenne une fois à tous les 5 ans (i.e., une probabilité de 1/5 de survenir à chaque année). Différentes approches existent pour calculer un événement de faible récurrence. Dans la présente étude, l'approche du « Peak-Over-Threshold (POT)» est utilisée. Cette méthode consiste à choisir tous les événements plus grands qu'un certain seuil ou, alternativement, à fixer à priori le nombre moyen d'occurrence de jours consécutifs sans précipitation (/...) par année ou par saison. C'est à partir du nombre d'année disponible (N) que les NÀ valeurs les plus extrêmes sont sélectionnées. Dans cette étude, À peut varier entre 1 et 2 dépendamment de la région d'intérêt. Par exemple, à l'équateur, /..=2 car le nombre d'occurrence de périodes de sécheresse est grand. Dans les régions subtropicales,/... varie entre 1 et 2 tandis que dans les régions désertiques, /...=1 puisque le nombre d'occurrence d'événement de périodes de sécheresse est petit. Ces données sont par la suite ajustées à la distribution statistique GPD (General Pareto Distribution) à l'aide de la méthode du Probability weighted moment (PWM) (Sushama et al., 2012). Un exemple de ce calcul est fournit dans l'annexe A.
1.2.1 Évaluation des erreurs de performance
Afin d'évaluer la performance du modèle, le MRCC5 piloté aux frontières parERA -Interim est comparé aux données d'analyses du Global Precipitation Climatology Project (GPCP) (Huffrnan et al., 2001). Puisque les données du GPCP ne commencent qu'en 1997, la période allant de 1997 à 2008 est utilisée à des fins de comparaison. Les différentes caractéristiques des périodes de sécheresse sont calculées de façon annuelle et saisonnière
mis à part pour le nombre total de périodes de sécheresse qui correspond au cumulatif sur 12 ans (1997-2008). Ce choix méthodologique permet d'inclure les périodes de sécheresse qui pourraient durer plus d'une année. En ce qui concerne le nombre d'événements de faible occurrence, puisque la période d'étude est de 12 ans (1997-2008), et que À varie entre 1 et 2, les valeurs du NÀ peuvent varier entre de 12 à 24. Les événements de récurrence de 5 ans sont calculés pour chacun des points de grille situé sur le continent à l'exception des points de grille où le maximum de jours consécutifs sans précipitation est plus grand que 365 (92) pour le cas annuel (saisonnier). L'analyse est faite pour les quatre seuils de précipitation soit 0.5 mm, 1 mm, 2 mm et 3 mm.
Les erreurs dues aux conditions aux frontières peuvent avoir une influence notable sur l'aptitude du MRCC5 à simuler le climat. Ainsi pour évaluer la dépendance des résultats des simulations aux conditions aux frontières, le MRCC5 piloté par ERA-Interim est comparé avec le MRCC5 piloté par CanESM2.
La valeur ajoutée du MRC est de déterminer si ces simulations améliorent la qualité des simulations climatiques par rapport à celle issue des Modèles de Circulation Général (MCGs) qui ont une faible résolution. Les différences entre les deux modèles se retrouvent généralement dans les régions marquées par une diversité de l'orographie, un contraste terre-mer, un changement de type de surface et également là où il existe certains processus atmosphériques qui doivent être résolus à plus fine échelle telle que la convection. Dans le cadre de la présente étude, la valeur ajoutée du MRCC5 est quantifiée en comparant le MRCC5 piloté par CanESM2 à CanESM2.
1.2.2 Changements projetés
Les changements projetés des différentes caractéristiques de périodes de sécheresse sont évalués pour deux périodes futures (2041 à 2070 et 2071 à 21 00) et sont par la suite comparés à la période de référence ( 1980-201 0). Ces comparaisons sont faites en se basant sur les simulations du MRCC5 piloté par CanESM2 ainsi que CanESM2. Pour le calcul des événements de récurrence de 5 ans, la période d'étude d'une durée de 30 ans permet de recenser de 30 à 60 événements extrêmes (pour ')..=2). L'évaluation des changements
appréhendés des différentes caractéristiques de périodes de sécheresse consiste également à savoir si ces changements sont statistiquement significatifs. Pour ce faire, le Student t-test pour un intervalle de confiance de 95% (Walpole and Myers, 1985) est utilisé pour les deux variables suivantes : le nombre de jours secs et le nombre de périodes de sécheresse. Pour les événements de récurrence de 5 ans, la méthode du bootstrap (Efron and Tibshirani, 1993; Davison and Hinkley, 1997) est employée. Cette approche consiste à calculer un intervalle à 95% de confiance pour des événements de récurrence de 5 ans. Pour ce faire, un r é-échantillonnage, calculé de façon aléatoire, est effectué 1000 fois, pour créer un nouvel échantillon d'événements. Finalement, l'écart type de cet échantillon est utilisé pour déterminer l'intervalle de confiance. Ces intervalles sont construits pour chacun des points de grille pour le climat de référence (1981-20 1 0) et le climat futur (2041-2070 et 2071-21 00). Si les intervalles de confiance du climat futur et du climat de référence ne se chevauchent pas, les changements sont dits statistiquement significatifs.
En résumé, la présente étude s'intéresse à l'analyse des différentes caractéristiques des périodes de sécheresse incluant le nombre de jours secs, le nombre de périodes de sécheresse ainsi que le maximum de jours consécutifs sans précipitation associé à une récurrence de 5 ans. Ces caractéristiques sont simulées à l'aide de la se version du Modèle Régional du Climat Canadien (MRCCS) ainsi que de la 2e génération du Modèle de Circulation Général Système Terre (CanESM2). Dans un premier temps, une analyse de la performance du modèle est faite en comparant le MRCCS piloté par les réanalyses ERA-Interim à 0.44 degré de résolution avec les analyses du Global précipitation Climatology Project (GPCP) à 1 degré de résolution horizontal pour la période courante (1997-2008). Par la suite, les erreurs dues aux conditions frontières sont analysées en comparant le MRCCS piloté par ERA-Interim avec le MRCCS piloté par CanESM2. Finalement, la valeur ajoutée du MRC est évaluée en comparant le MRCCS piloté par CanESM2 et le modèle global CanESM2. Finalement, les différentes caractéristiques des périodes de sécheresse sont évaluées pour un climat futur (2041-2070 et 2071-21 00) en comparaison avec un climat de référence (1980-201 0) à l'aide du MRCCS piloté par CanESM2 ainsi que CanESM2 sous le scénario de gaz à effet de serre RCP 4.5.
1.3 Objectifs du mémoire
Ce mémoire vise à estimer les changements appréhendés des différentes caractéristiques de précipitation sur le domaine de l'Afrique à l'aide du MRCC5 et du CanESM2. Il vise également à quantifier la valeur ajoutée du modèle régional en comparaison avec le modèle global. Pour y parvenir, voici les grandes étapes de ce mémoire : 1) Calculer le nombre de jours secs, le nombre de périodes de sécheresse ainsi que le nombre de jours consécutifs sans précipitation associé à une récurrence de 5 ans d'après les seuils de précipitation correspondant à 0.5 mm, 1 mm, 2 mm et 3 mm. Ainsi les erreurs de performances sont évaluées en comparant le MRCC5 piloté par ERA-Interim avec le GPCP.
2) Comparer les erreurs de pilotage entre les deux simulations du MRCC5 (ERA-Interim vs CANESM2)
3) Déterminer la valeur ajoutée du MRCC5 vs CanESM2
4) Estimer les changements appréhendés pour les différentes caractéristiques de périodes de sécheresse entre la période de référence (1980-2010) et les deux périodes futures (2041-2070 et 2071-21 00) pour le modèle régional et le modèle global de façon annuelle et saisonnière.
5) Vérifier si ces changements sont statistiquement significatifs en utilisant la méthode du t-test pour le nombre de jours secs et le nombre de périodes de sécheresse et la méthode du bootstrap pour les événements de récurrence de 5 ans.
Organisation du mémoire :
Tout d'abord, l'introduction est présentée au chapitre 1 et est subdivisée en 3 sections 1) Problématique générale 2) Méthodologie et 3) Objectifs du mémoire. Le chapitre II comprend l'article scientifique rédigé en anglais. Cet article est lui-même séparé en plusieurs sections : 1) 1' introduction, 2) la description des modèles ainsi que la configuration expérimentale, 3) la méthodologie, 4) l'évaluation des erreurs et de la valeur ajoutée ainsi que l'analyse des changements appréhendés et 5) la discussion des résultats et conclusions. Le dernier chapitre (III) contient la discussion des résultats et les conclusions du mémoire.
Finalement, quelques figures et tableaux ne se retrouvant pas dans l'article, sont présentés en complément en annexe A et B. L'annexe A est un exemple de calcul du maximum annuel de jour consécutif sans précipitation associé à une récurrence de 5 ans pour le climat présent (1981-2010). L'annexe B montre les changements appréhendés pour les différentes caractéristiques de périodes de sécheresse pour Je seuil de précipitation de 2 mm. Ces résultats diffèrent de ceux présentés dans l'article dans la mesure où les figures des changements appréhendés ne montrent pas seulement les valeurs qui sont statistiquement significatif à 95%.
ON THE CURRENT AND FUTURE DRY SPELL CHARACTERISTICS OVER AFRICA
Bessam Bouagila1, Laxmi Sushama1
'Centre ESCER (Étude et Simulation du Climat à l'Échelle Régionale), University of Quebec at Montreal, 201-President-Kennedy, Montreal, Quebec, Canada H3C 3P8.
*Corresponding author
Tel: +1 514-987-3000 ext. 2414 Fax:+l 514-987-6853
Email: [email protected]
Abstract
Changes in precipitation frequency and intensity distribution over Africa will have a direct impact on dry spells and, therefore, will affect various climate sensitive sectors. In this study, the ability of the fifth generation of the Canadian Regional Climate Model (CRCM5) in simulating annual and seasonal dry spell characteristics is assessed for four precipitation thresholds (0.5 mm, 1 mm, 2 mm and 3 mm) over Africa. The dry spell characteristics considered are the number of dry days, number of dry spells and five-year retum levels of maximum dry spell durations. The performance errors are assessed by comparing ERA-Interim driven CRCM5 with the Global Precipitation Climatology Project (GPCP) dataset, for the common 1997-2008 period. Lateral boundary forcing errors, i.e., errors in the CRCM5 simulation created by errors in the driving Canadian Earth System model (CanESM2) data-as weil as the added value-of CRCM5 over CanESM2 are also assessed for the current climate. This is followed by an assessment of projected changes to dry spell characteristics for two future climates (2041-2070 and 2071-2100) simulated by both
CRCM5 driven by CanESM2 and CanESM2 itself, for Representative Concentration
Pathway (RCP) 4.5. Results suggest that CRCM5 driven by ERA-Interim has a tendency to overestimate the annual mean number of dry days and the five-year retum level of the maximum dry spell duration in a majority of the regions wh ile it slightly underestimates the number of dry spells. In general, the CRCM5 performance errors associated with the annual and seasonal dry spell characteristics are found to be larger in magnitude compared to the lateral boundary forcing errors. Projected changes to the dry spell characteristics for the 2041-2070 and 2071-2100 periods, with respect to the 1981-201 0 period suggests significant changes in the tropics, with the mean number of dry days and the five-year retum levels of maximum dry spell duration increasing, while the mean number of dry spell days decreases.
2. 1 Introduction
According to the Intergovemmental Panel on Climate Change (IPCC, 2007), Africa is one of the most vulnerable continents to climate change and climate variability. Global Climate Models (GCMs) participating in IPCC's fourth Assessment Report suggest warmer temperatures, in the range of2-7
oc
for Africa by the end ofthe 21st century. This warming is non-uniform, with the drier subtropical regiOns projected to experience warmer temperatures than the moist tropical region. As for precipitation, annual amounts are expected to decrease in parts of Africa above 20°N and below 25°S, white an increase is expected in the Hom of Africa. For regions such as Sahel and the Guinean coast, annual and seasonal mean precipitation show no clear signal (IPCC, 2007).Changes in precipitation frequency and intensity distribution can have an impact on dry and wet spells and, therefore, will affect various climate sensitive sectors, primarily agriculture. For most parts of Africa, agriculture is predominantly rain fed and thus, very vulnerable to changes in precipitation. The uneven seasonal distribution of precipitation can expose crops to a range of mild to severe intra-seasonal dry spells, which may affect the yield (Barron et al., 2002). For example, for East Africa (Kenya-Uganda-Tanzania), Shongwe et al. (20 1 0) report a positive shi ft in the precipitation distribution, i.e., an increase in high intensity precipitation events, by the end of the century for the two wet seasons (October-December and March-May) based on GCM projections. Their study also suggests Jess severe droughts for East Africa.
Severa! previous studies such as Bamett et al. (2006), Dai (2006); Tebaldi et al. (2006) have assessed projected changes to global precipitation characteristics using GCMs. Tebaldi et al. (2006) studied projected changes to 10 indicators of climate extremes using an ensemble of nine GCMs according to a range of emission scenarios. Their study, despite the large spread in GCMs, showed on average a general decrease in the number of dry da ys (da ys with precipitation Jess than 1 mm) for the central east part of the tropics and an increase for the subtropics, over the African continent, for the A 18 scenario. The large spread in GCM projections, particularly over Africa, is an indication of the challenges in simulating climate characteristics of the continent. In fact, climatic models still represent the main characteristics in and around Africa with significant errors such as excessive precipitation in the south,
southward displacement of the Atlantic Inter-Tropical Convergence Zone (ITCZ), and insufficient upwelling near the Kalahari desert (IPCC, 2007), making it difficult to assess the changes in future climate with confidence.
Though GCMs provide better simulations for the atmospheric general circulation at a larger scale, they do not offer required detail for regional and local assessment. This is particularly true for heterogeneous regions, with important variations of topography, vegetation, soils and coastlines (Hudson and Jones, 2002). Extreme events such as heavy precipitation are often not well-captured by GCMs. In fact, Sun et al. (2005) showed that over land, most current GCMs overestimate light precipitation (1-10 mm/day) and underestimate heavy precipitation (> 10 mm/day). Since precipitation processes occur at finer resolution (Kundzewicz et al., 2007), the Regional Climate Mode! (RCM) is a more adequate tool for many regional impact and adaptation studies as reported by Gao et al. (2006), May (2008); Sushama et al. (20 1 0); Sanchez et al. (20 11) and Heinrich et al. (20 12).
Although the use of RCMs over Africa is still in its infancy (Hulme et al., 2001 ), efforts have been made to assess the main climatic features of Africa with regional models; Sun et al. ( 1999) used RegCM2 from the National Center for Atmospheric Research to investigate precipitation over East Africa, while Patricola et al. (2006) studied the dynamics of the West African Monsoon with the Weather Research and Forecasting (WRF) mode!, and Ibrahim et al. (20 12) used five RCMs for the same region. Joubert et al. (1999) used the Division of Atmospheric Research Limited Area Mode! (DARLAM) from Commonwealth Scientific and Industrial Research Organisation, and Hudson et al. (2002) used the Hadley Regional Climate Mode! (HadRM3H) to examine the climate of southem Africa.
In response to the vulnerability of Africa to climate change stated in the fourth Assessment Report of the IPCC (2007), many recent international projects such as the Assessment of Impact and Adaptation to Climate Change (AlACC) (Hewiston et al., 2003), the Greater Hom of Africa Regional Model Intercomparison Project (AFRMIP) (Anyah et al., 2011), the African Monsoon Multidisciplinary Analysis (AMMA) (Sultan et al., 2004; Redelsperger et al., 2006; Van der Linden and Mitchell, 2009) and the West African Monsoon Mode ling and Evaluation (W AMME) (Druyan et al., 201 0; Xue et al., 201 0) have focused on the application of RCMs over Africa. The latest in the series of international projects, CORDEX (Giorgi et al., 2009) was initiated to evaluate and improve the ability of
an ensemble of RCM simulations, including CRCM5 (Hemandez-Diaz et al., 2013; Laprise et al., 201 3) over selected domains, such as Africa. CO RD EX is also providing a standardized framework of Regional Climate Downscaling for improved regional climate change adaptation and impact assessment (http://wcrp.ipsl.jussieu.fr/cordex/about.html). Africa was selected as the first target region in order to improve simulation of key elements of current climate and theo providing climate-change projections with various RCMs. Despite this recent increase in RCM application over Africa, study of extreme events is still very limited for the region (IPCC, 2007).
So far, no studies on projected changes to dry spell characteristics over the African continent using RCMs are available. Such studies are required to aid develop adaptation strategies in the context of a changing climate. This article presents a thorough analysis of the annual and seasonal dry spell characteristics over Africa, as simulated by the fifth generation of the Canadian Regional Climate Model (CRCM5) in the current climate, and their projected changes for future periods. Projected changes based on the Canadian Earth System Mode] (CanESM2), which provides driving data at the CRCM5 lateral boundaries, are also investigated for the Representative Concentration Pathway (RCP) 4.5 scenario. The RCPs, which are based on simulations from a set oflntegrated Assessment Models (IAMs), provide both concentration and emissions of radiatively important greenhouse gases emissions for severa) aerosols and their precursor species, and associated land cover change scenarios. In total, a set of four pathways- RCPs 2.6, 4.5, 6 and 8.5-were produced that lead to radiative forcing levels of 2.6, 4.5, 6 and 8.5 W/m2 by the end of the century (Meinshausen et al., 2011 ).
The paper is organized as follows: section two describes CRCM5 experimental con 1guration, observation datasets used and the methodology followed. Assessment of performance and boundary forcing errors and added value of CRCM5 are presented in section three, followed by assessment of projected changes to dry spell characteristics for two future periods (2041-2070 and 2071-21 00) with respect to the current 1981-201 0 period, for RCP 4.5 scenario. Summary and conclusions are presented in section four.
2.2 Model, Experimental Configuration, Datasets and Methods
The RCM considered in the study is CRCM5 (Zadra et al., 2008), which is based on a limited-area version of the Global Environment Multiscale (GEM) madel used for Numerical Weather Prediction (NWP) at Environment Canada (Côté et al., 1998). GEM uses semi-Lagrangian transport and (quasi) fully implicit marching scheme. In its fully elastic non-hydrostatic formulation (Y eh et al., 2002), GEM uses a vertical coordinate based on hydrostatic pressure (Laprise, 1992). The following GEM parameterisations are used for CRCM5: deep convection following Kain et al.(1990), shallow convection based on a transient version of Kuo's (1965) scheme (Bélair et al., 2005), large scale condensation (Sundqvist et al., 1989), correlated-k solar and terrestrial radiations (Li and Barker, 2005), subgridscale orographie gravity-wave drag (McFarlane, 1987), low-1evel orographie blocking (Zadra et al., 2003), and turbulent kinetic energy closure in the planetary boundary layer and vertical diffusion (Benoît et al., 1989; Delage and Girard, 1992; Delage, 1997). In CRCM5, the usual GEM land-surface scheme has been replaced by CLASS version 3.4 (Verseghy, 2009) that allows a mosaic representation of land-surface types and a flexible number of soil layers in the vertical; in this article, 26 soil layers varying in thickness from 0.1 rn at the surface to 5 rn at the bottom are used.
A 150-year integration, spanning the 1951-2100 period on a 201 x 194 points gr id (Figure 2.1 a) covering the who le of Africa and the adjoining oceans at 45 km horizontal grid spacing and 56 levels in the vertical is considered in this paper. This integration performs dynamical downscaling of the CanESM2 simulation to produce climate projections at the regional scale. In this simulation, the Sea Surface Temperature (SST) is prescribed and corresponds to that of CanESM2. CanESM2 simulation grid has a horizontal resolution of 2.81° with 35 verticallayers (Figure 2.1 b), and follows RCP 4.5 scenario (Meinshausen et al., 2011) for the 2010-2100 period. Though the CRCM5 simulation spans the 1951-2100 period, this study foc uses on the current 1981-2010 and the future 2041-2070 and 2071 -2100 30-year periods.
In addition, a validation experiment, i.e., CRCM5 simulation forced at the lateral boundary by ERA-Interim (Simmons et al., 2007; Uppala et al., 2008) data from the European Centre for Medium-Range Weather Forecasts (ECMWF) for the 1984-2008 period is also considered. In this simulation, the prescribed SST follows ERA-Interim. According to IPCC, RCM simulations nested by reanalysis can reveal RCM 'performance errors' primarily
due to the dynamics and physics of the regional mode!, and should precede any attempt to make climate-change projections (Sushama et al., 201 0). Hereafter, the CRCMS driven by ERA-Interim and CRCM driven by CanESM2 will be referred to as CRCMS_ERA_Interim and CRCMS _ CanESM2, respectively.
2.2.2 Observational data
The observed dry spell characteristics used for evaluating CRCMS are derived from the Global Precipitation Climatology Project (GPCP) (Huffman et al., 2001) 1 x JO dataset (Figure 2.1c) covering 40°N to 40°S at three-hourly intervals. GPCP is based on geosynchronous satellite data and gauge measurements from the Global Precipitation Climatology Center (GPCC). The data set extends from October 1996 to present.
It should be noted though that the GPCP dataset may not be accurate for certain regions. For example, Nikulin et al. (2011), based on a detailed analysis of the number of gauge stations included in the GPCC product, and therefore in GPCP, found that almost no station observations over central Africa (Angola, Democratie Republic of the Congo, Tanzania and Mozambique) were used for any of the months for the 1998-2006 period. This may have influenced the quality of the dataset over this region.
2.2.3 Methods
The objective of this article is two-fold. The first objective is to assess performance and boundary forcing errors (discussed below) associated with CRCMS simulated dry spell characteristics and the added value of CRCMS over the driving GCM, i.e., CanESM2. The second objective is to assess projected changes to dry spell characteristics from CRCMS transient climate change simulations for the RCP 4.5 scenario. lt must be noted that ali analysis presented in this article are perforrned on respective grids. ln other words, CanESM2 and GPCP data were not interpolated to CRCMS grid, unless otherwise specified.
The dry spell characteristics considered in this study include the mean annual and seasonal number of dry days, dry spells and five-year return levels of annual and seasonal maximum dry spell duration, defmed as the statistical estimate of the annual and seasonal maximum dry spell duration that would occur on average once every five years. The seasons
considered correspond to the boreal (July-September; JAS) and austral (January-March;
less than a predefined threshold. This threshold is subjective and, in this study, 0.5 mm, 1 mm, 2 mm and 3 mm are considered. As in previous studies (Lana et al., 2006; Beniston et al., 2007; Sushama et al., 2010; She et al., 2012), dry spell is defined as an extended period of dry days, including those of one day duration.
The return levels of dry spell durations are computed using the peaks-over-threshold (POT) approach. The advantage of the POT over the annual/seasonal maximum approach is that it considers those extreme values that are larger than sorne of the annuallseasonal maximum extremes that will not normally be considered in the annual/seasonal maximum approach (Sushama et al., 201 0; She et al., 20 12). In this approach, the average number of dry spell durations per year/season (say À) are set a priori and the largest nÀ values are selected, from the n years considered. In this study, À varies from 1 to 2 depending on the region. For the tropics where the number of dry spells is large, À is set to 2, while for the subtropics, À varies from 1 to 2 and for the Sahara À is set to 1 since the number of dry spells are small though they are of very long durations. This approach strategy is equivalent to fixing the threshold at the, say, 95th or 98th percentile value (Coles, 2001). For probabilistic modelling of POT values, the General Pareto Distribution (GPD) is used (Sushama et al., 2010).
2.2.3 .1 Performance Errors
The performance errors are assessed by comparing dry spell characteristics, i.e., number of dry days, number of dry spells and return levels of maximum dry spell durations derived from the ERA-lnterim driven CRCM5 simulation, for the current 1997-2008 climate, with tho se derived from GPCP (Huffman et al., 2001) analysis. The 1997-2008 period was chosen since GPCP is only available for this period. The performance errors are assessed for various characteristics at annual and seasonal time scales, except for the number of dry spells where, the total number of dry spells for the 12-year period is considered; this is to include the dry spells that will extend from the end of a given year to the beginning of the next year. For the computation of return levels, since the comparison period is the 12-year period, with
À for the POT analysis varying from 1 to 2, 12 to 24 maximum dry spell durations are
considered. The five-year return levels of maximum duration of dry spell are computed for ali land points, and are masked in grey at those grid points where the return levels of maximum
19
duration of dry spells are found larger than 365 (92) days in the case of annual (seasonal) maximum dry spells. The five-year retum period is chosen since the number of years for which observation data is available is only 12 years. Retum levels corresponding to higher retum periods will have larger uncertainties given the small sample size and are therefore not considered. Though analysis has been performed for ali four thresholds, validation results will be presented only for 0.5 mm and 3 mm threshold for the dry spell characteristics. Where appropriate, results for other thresholds, i.e., 1 mm and 2 mm are discussed.
2.2.3.2 Boundary Forcing Errors
In addition to performance errors, the CRCM5 CanESM2 simulations will have additional errors due to errors in the nesting CanESM2 data since RCMs are strongly influenced by the large-scale circulation from driving GCMs (Christensen et al., 1997). These errors, referred to as boundary forcing errors, are assessed by comparing CRCM5 driven by CanESM2 with CRCM5 driven by ERA-Interim. Reducing boundary forcing errors requires that the GCM provides more realistic boundary values.
2.2.3.3 Added Value
The added value of the RCM is the ability to improve the representation of the regional to local climate compared to the more coarsely resolved global climate models. In other words, RCM can provide additional details for regions with important orography, land-sea contrasts and changes in surface type. The small-scale atmospheric features such as convective cells that are not weil represented in the global climate models are better captured in RCMs. The added value is assessed by comparing the CRCM5 _ CanESM2 simulation with CanESM2 simulation.
2.2.3.4 Projected changes
The projected changes to dry spell characteristics for two future time slice windows, i.e., 2041-2070 and 2071-2100 are assessed by comparing the future dry spell characteristics with th ose for the current 1981-20 10 period of the CRCM5 _ CanESM2 simulation. Ali figures corresponding to projected changes show absolute changes, i.e., Xr- X0 where Xf and Xc are the future and current values of the variable of interest X. However, reference in terms of percentage changes is also used where required, which is computed as (x1- Xc)/
Xc. Projected changes are also assessed based on CanESM2 simulation for the same two future periods. For the computation of retum levels, using POT, for the current and future 30-year time slices, the values of maximum dry spell durations considered can vary from 30 up to 60. Projected changes for grid points where the retum levels of maximum duration of dry spells are found larger than 365 (92) days in the case of annual (seasonal) maximum dry spells for current and/or future climates are masked in grey color. The results related to projected changes are presented only for the 2 mm threshold and other thresholds are discussed as required.
The statistical significance of projected changes to the mean number of dry days and dry spells is assessed using the Student's t-test (Walpole and Myers, 1985) at 95% confidence leve!, while the nonparametric bootstrap resampling method (Efron and Tibshirani, 1993; GREPHYS, 1996; Khaliq et al., 2009) is used for retum levels of maximum dry spell duration. The 95% confidence interval for retum levels is calculated as: RO ± 1.96SE, where RO is the sample retum leve! and SE is the standard error of the retum leve! estimated using 1000 bootstrap resamples. Such confidence interva1s for retum levels are calculated for each grid-point for both future and current climates. The statistical significance of the difference between the future and current period values is assessed using these confidence intervals, i.e., the change (positive/negative) is considered significant if these confidence intervals do not overlap.
2.3 Results
2.3.1 Assessment ofErrors and Added Value
2.3.1.1 Performance Errors
As discussed under the methods section, performance errors are assessed by comparing CRCM5 _ ERA _Interim and GPCP for the 1997-2008 period. Figure 2.2a shows the spatial distribution of annual mean number of dry days for the precipitation thresholds of 0.5 mm and 3 mm. GPCP shows minimum values of dry days in the tropics where strong convective precipitation occurs. The lowest values of annual number of dry days in the 120-240 days range is located in the Democratie Republic of Congo, along the South-East coast of Africa and in the mountainous regions of the eastern Madagascar, the East Africa
Highlands and the elevated terrain of Ethiopia and Sudan. The maximum number of dry days are, as expected, in the subtropics where the deserts are located. For northern-most and southern-most parts of Africa, the values of dry days are generally regulated by the passage
-of mid-latitude fronts (IPCC, 2007). Annually, CRCM5 _ ERA _Interim overestimates the mean number of dry days in the tropics and in the sub-tropics compared to GPCP, while it underestimates along the eastern coast of Africa starting from South Africa and extending to the south of Somalia. As the precipitation threshold increases, the number of dry days increases. For example, in the Central African Republic, the number of dry days in the 180-210 range for 0.5 mm increases to the 210-240 range for the 3 mm threshold. The spatial patterns are more similar at the 2 mm and 3 mm threshold for GPCP and CRCM5 ERA Interim.
The seasonal number of dry days in the tropics changes with the migration of the Inter Tropical Convergence Zone (ITCZ) from its northern most position in boreal summer to its southern position during the austral summer. Figure 2.2b shows that in the boreal summer, GPCP shows a minimum number of dry days to the north of the equator, where it precipitates the most, due to the northerly position of ITCZ during this season. In the sub-tropics, i.e., the regions of Sahara and Kalahari deserts, the values of dry days are found larger. As the threshold is increased from 0.5 mm to 3 mm, the number of dry days increases especially in the ITCZ region; dry days in the 10-25 range at 0.5 mm increase to the 25-40 range at a 3 mm threshold. ln the austral summer (Figure 2.2c), GPCP shows minimum values in the ITCZ region, i.e., south of the Equator during this season, and higher values are located in the Sahara desert. For boreal summer, CRCMS_ERA_Interim overestimates the number of dry days in the Sahel (Mali, Niger, Chad) compared to GPCP. This is due to the southward bias
in th position of the Saha a Heat Lo that does not move enough north, which results in a
narrower West African Monsoon rainfall band (Hernandez-Dfaz et al., 2013). For both austral and boreal summers (Figure 2.2b,c), CRCMS_ERA_Interim generally underestimates the number of dry days especially in the tropics compared to GPCP. However, Hernandez-Dfaz et al. (2013) showed that for sorne regions such as the Gabon, Democratie Republic of Congo and Madagascar, CRCMS driven by ERA-Interim simulates more realistic precipitation than GPCP. ln these regions, GPCP misses the rainfall peak.
CRCM5_ERA_Interim are now compared with GPCP (Figure 2.3a) for the 1997-2008 period. GPCP shows high values of number of dry spells in the tropics where there are many days with precipitation, which leads to severa! short dry spells. GPCP shows in the subtropics small number of dry spells because of the small number of precipitation days that leads to longer dry spells. High values of the number of dry spells are also seen along the northern coast of the Maghreb (Morocco-Algeria-Tunisia) and the southeast coast of South Africa, particularly at 0.5 mm. Figure 2.3a shows that CRCM5 _ ERA _Interim underestimates the values in the Kalahari desert and in the tropics but overestimates the number of dry spells along the eastern coast of Africa extending from the South of Somalia to the South of Africa and also the Guinean coast of Africa compared to GPCP. In fact, for the south coast of South Africa, CRCM5_ERA_Interim shows number of dry spells in the 700-800 range, white GPCP has dry spells in the 400-500 range at 0.5 mm threshold. These results are consistent with the underestimation of the mean number of dry days (Figure 2.2) linked with the mode! tendency to precipitate more, for instance, frequent change between wet and dry spells in the madel simulation. As the threshold increases, the mean number of dry spells decreases.
For the boreal summer (Figure 2.3b), the observed (i.e., GPCP based) maximum number of dry spells are collocated with the position of the ITCZ at around 1 0°N latitude, white in the austral summer (Figure 2.3c), the observed maximum of number of dry spells shift with the position of the ITCZ to around l0°S latitude. For the boreal summer, CRCM5 _ ERA _Interim represents the narrow ra in belt in the tropics reasonably weil. At 0.5 mm and 3 mm thresholds, CRCM5_ERA_Interim overestimates the mean number of dry spells along the eastern coast of Africa extending from South of Somalia to South Africa. In the tropics, CRCM5_ERA_Interim generally overestimates the mean number of dry spells. Annually and seasonally, CRCM5_ERA_lnterim agrees better with GPCP with maximum values located in the Democratie Republic of Congo and lower values in the desert regions (Sahara and Kalahari).
As mentioned earlier, the return levels of maximum annual/seasonal dry spell duration are computed using the POT approach, with À varying from 1 to 2 (Figure 2.4). Grey
colors are used for grid cells where the annual (seasonal) maximum dry spell duration is higher than 365 (92) days. lt should be noted that the points that are masked vary for GPCP and madel simulations. The GPCP based ftve-year return levels of annual maximum dry spell
durations have low values in the tropics (where it rains the most), which is consistent with the large number of dry spells of shorter duration for that region. High return values are found in the southern part of Africain the vicinity of the Kalahari Desert (Angola, Botswana). Eastern Madagascar, East Africa Highlands and the elevated terrains of Ethiopia and Sudan also have low values of dry spell duration since it rains more frequently.
For the five-year retum levels of annual maximum dry spell duration (Figure 2.4a),
GPCP shows that the values are in the range of 40 consecutive days in the tropical region, white in the subtropics, the values are larger. In general, CRCM5_ERA_Interim overestimates the annual maximum dry spell duration compared to GPCP. The differences are larger in both Sahara and Kalahari deserts where CRCM5 _ ERA _Interim has too many consecutive dry days. For boreal summer (Figure 2.4b), CRCM5_ERA_Interim overestimates the five-year return levet especially in the north of the Democratie Republic of Congo. In fact, CRCM5_ERA_Interim shows values in the 50-70 range, white GPCP values are Jess than 30 at the 3 mm threshold. CRCM5 ERA Interim also overestimates return levels in the Mediterranean region.
In austral summer (Figure 2.4c), CRCM5 _ERA_Interim overestimates the return levels in the Sahara desert and in the Sahel compared to GPCP. As the threshold increases from 0.5 to 3 mm, the maximum dry spell duration increases. The annual and boreal summer figures for the Guinean coast (near Gabon and Liberia) shows that the difference between the 3 mm and 0.5 mm threshold is very small which means that the daily precipitation rate is often higher than 3 mm threshold.
2.3.1.2 Boundary Forcing Errors
As discussed previously, boundary-forcing errors are assessed by comparing CRCM5_CanESM2 and CRCM5_ERA_Interim simulations. Since precipitation will have a
direct influence on the dry spell characteristics, precipitation in CRCM5 _ ERA _Interim and CRCM5_CanESM2 are first compared. Figure 2.5 shows that the boreal summer (annual) precipitation is larger (smaller) for CRCM5_CanESM2 compared to CRCM5_ERA_Interim for the Guinean coast, but there are a number of other differences in the two experiments.
The CRCM5 CanESM2 is wetter over the north-eastern southern Africa in the annual mean.
hand, the CRCM5 _ CanESM2 is dryer over north-western equatorial/tropical Africa (notably in Liberia and Sierra Leone) and in Ethiopia, especially in the boreal summer. It was also
shown in a previous study of La prise et al. (20 13) th at CRCM5 _ CanESM2 has difficulties in
representing the precipitation over the West African Monsoon region, and that only
CRCM5_ERA_lnterim was able to reproduce the seasonal migration of the West African Monsoon precipitation. The inability of CRCM5 _ CanESM2 to well simulate the rainy season
in the West African Monsoon is related to the misrepresentation of the seasonal cycle of the
GCM-simulated SSTs in the equatorial Atlantic Ocean (Laprise et al., 2013).
The difference between CRCM5 CanESM2 and CRCMS ERA Interim simulated
dry spell characteristics show that, in general, CRCM5 _ CanESM2 has positive boundary
forcing errors, i.e., more number of dry days, along the Guinean coast for the annual mean
(Figure 2.2a), while for the same region, negative boundary forcing errors are noted for the
boreal summer (Figure 2.2b ). CRCMS _ CanESM2 has positive boundary forcing errors over
the north-eastern southem Africa, while negative errors are noted over the north-western
equatorial region in austral summer (Figure 2.2c). For the number of dry spells,
CRCMS _ CanESM2 exhibits negative boundary forcing errors, i.e., Jess number of dry spells
in the Guinean coast for the annual mean (Figure 2.3a), while for the same region,
CRCMS_CanESM2 shows positive errors for boreal summer (Figure 2.3b). In austral
summer (Figure 2.3c), positive boundary forcing errors over the north-western equatorial
region can be seen. For the five-year retum levels associated with annual and austral summer
maximum dry spell duration (Figure 2.4a,c), CRCMS_CanESM2 has a positive boundary
forcing errors in south central Africa and in the Ethiopian highlands compared to
CRCM5 _ ERA _Interim wh ile in boreal summer (Figure 2.4b ), positive boundary forcing
errors are found for the Hom of Africa and Maghreb regions.
Comparing the lateral boundary forcing errors of the three dry spell characteristics
considered here, those associated with the retum levels of maximum dry spell duration are
larger than those for the mean number of dry days and mean number of dry spells, especially over south central Africa. Comparison of performance errors and lateral boundary errors show that, in general, performance errors associated with the annual and seasonal dry spell
characteristics are larger in magnitude compared to the lateral boundary forcing errors,