Influence of tree cover on the performance of Betula glandulosa
Michx., an abundant shrub species in subarctic Québec
Mémoire
Caroline Mercier
Maîtrise en biologie
Maîtrise ès sciences (M. Sc.)
Québec, Canada
© Caroline Mercier, 2014
Résumé
Au Nunavik, Betula glandulosa (Michx.) est en pleine expansion en milieu ouvert, que ce soit par la densification des peuplements préétablis ou la colonisation de nouveaux sites. Mais qu’en est-il en milieu forestier où le couvert arborescent peut avoir un effet supérieur au climat sur la croissance de B. glandulosa? L’objectif de ce projet était d’évaluer la performance de B. glandulosa le long d’un gradient de fermeture de couvert forestier à l’écotone forêt-toundra. Les résultats démontrent que le couvert forestier influence négativement celui de B. glandulosa mais qu’il a un impact limité sur la hauteur, le nombre de chatons et la germination des graines de cette espèce. L’analyse dendrochronologique révèle une relation entre la croissance radiale et les températures printanières et automnales. Toutefois, l’absence d’un signal climatique fort pour les mois d’été, contrairement aux observations effectuées en milieu ouvert, suggère que la présence d’un couvert forestier peut masquer les effets du climat.
Table des matières
RESUME ... III
TABLE DES MATIERES ... V
LISTE DES TABLEAUX ... VII
LISTE DES FIGURES ... IX
REMERCIEMENTS ... XI
AVANT-PROPOS ... XIII
INTRODUCTION ... 1
ARTICLE ... 7
RÉSUMÉ ... 9
A
BSTRACT... 11
I
NTRODUCTION... 13
M
ATERIAL AND METHODS... 15
Study area... 15
Site selection ... 16
Vegetation surveys ... 17
Dendrochronological analyses ... 17
Seed viability ... 18
Statistical analyses for cover, height and reproductive output ... 19
R
ESULTS... 21
Betula glandulosa cover and height ... 21
Radial growth ... 22
Response functions ... 26
Reproduction ... 29
D
ISCUSSION... 31
Betula glandulosa cover and height ... 31
Betula glandulosa radial growth ... 32
Betula glandulosa reproduction ... 34
C
ONCLUSION... 35
A
CKNOWLEDGEMENTS... 37
CONCLUSION ... 39
Recouvrement et hauteur ... 39 Croissance radiale ... 40 Reproduction ... 42BIBLIOGRAPHIE ... 45
Liste des tableaux
Table 1. Cover percentage of tree and shrub species and mean height of B. glandulosa at
every site. Percentage values are obtained from vegetation surveys, which give a
single measurement with no variability for every species. Mean heights come from 20
individuals per site. ... 21
Table 2. Length, number of individuals and statistical validity of B. glandulosa mean radial
growth chronologies. Mean chronologies are calculated with annual growth ring
measurement curves of B. glandulosa individuals successfully crossdated. ... 23
Table 3: Pearson correlations between mean radial growth chronologies of B. glandulosa
and the length of growth season in days, considered as the number of days where
temperature was >5°C. Bold values are significant at P < 0.05. ... 26
Liste des figures
Figure 1. Study site in Nunavik, Québec (57°45’ N, 76°09’ W). The Boniface River
research station of the Centre d'études nordiques is located 10 km south of the
subarctic treeline. ... 15
Figure 2. Mean annual temperatures for 1945 – 2009 from Inukjuak’s meteorological
station. The onset of warming of air temperature in the region is shown with two
different regression lines (before and after 1995) and their equation and regression
coefficients. ... 16
Figure 3. Regressions between height and/or cover of the shrub species B. glandulosa and
E. hermaphroditum and the tree species P. mariana for the 9 forest sites. Significant
relations are illustrated with solid-line regressions, marginally significant relations
with dashed lines and non significant relations show no regression line. ... 22
Figure 4. Mean radial growth chronologies of B. glandulosa on all sites. Histograms show
the number of individuals included in the curves at every year. The detrending method
used to calculate radial growth ring indexes was a horizontal line fitted to the mean
curve, to keep as much climatic signal variability as possible. ... 24
Figure 5. Regressions between growth ring indexes of B. glandulosa mean radial growth
chronologies and growth degree-days (>5°C). All circles (empty and filled) and
dashed lines represent full chronologies, and filled circles and solid lines represent the
1995 – 2009 period, when warming started in the region. ... 25
Figure 6. Response coefficients for mean monthly temperature from September of the
previous year to August of the current year for the 12 mean radial growth chronologies
of B. glandulosa. Positive coefficients indicate the positive influence of mean
temperature of the corresponding month on radial growth, and vice-versa. Black bars
are forest sites and grey bars are open sites, and bars are ordered by site number.
Asterisks indicate months having a significant coefficient at P < 0.05. The 95%
confidence intervals of the bootstrapped response functions are not shown. 1990 –
2009 was the shortest period that could be analyzed with this set of data. ... 27
Figure 7. Response coefficients for minimal monthly temperature of previous September to
August. See Figure 6 for details. 1988 – 2009 was the shortest period that could be
analyzed with this set of data. ... 28
Figure 8. Regressions between B. glandulosa mean number of catkins on a single stem,
mean germination percentage and tree cover of P. mariana. Catkins were counted on
20 individuals and germination percentage was calculated from germination of seeds
harvested from 10 individuals on every site. Error bars are not shown. ... 29
Remerciements
Ce projet a été l’une des aventures les plus enrichissantes de ma vie, personnellement et professionnellement, et m’a fait tomber profondément amoureuse du nord du Québec. Je tiens à remercier mon directeur de recherche, Stéphane Boudreau, pour sa présence généreuse et ses conseils judicieux et formateurs, pour la belle ambiance au labo et pour m’avoir fait confiance dans ce projet et permis de vivre cette expérience fabuleuse. Je remercie également Serge Payette de m’avoir fait entrevoir le nord et menée à ce projet par son enseignement inspirant. Merci à Sandra Angers-Blondin, Marie-Pier Denis, Mélanie Jean, Pascale Ropars, Francis St-Amour et Alexandre Truchon-Savard pour leur grande aide sur le terrain, leur amitié et leur humour. Merci à Barbara Joyet et Claude Tremblay pour la coordination à Kuujjuarapik-Whapmagoostui, à Séphanie Bédard, Annie Girard et Mélissa Paradis pour l’aide en labo, Luc Cournoyer et (maman) Ann Delwaide pour leur aide précieuse en dendrochronologie, Louise Lapointe, Jocelyne Roy, Caroline Vallée et Josée Verret pour le soutien administratif dévoué, Katherine Gavrilchuk et Sevan Houston pour leur révision préliminaire de l’article, et Vanessa Duclos, Geneviève Dufour-Tremblay, Marie-Pascale Villeneuve-Simard pour leur amitié, leur présence, leur aide et leurs conseils au sein du LaBoudreau. Merci à mes amis, parents et famille qui m’ont toujours soutenue durant mes études, peu importe leur durée. Finalement, merci à la Fondation Richard-Bernard et aux collaborateurs financiers sans qui ce projet n’aurait pas été possible : le Conseil de recherche en sciences naturelles et en génie du Canada (CRSNG), le Programme de formation scientifique dans le Nord (PFSN) et le Centre d’études nordiques (CEN).
Avant-propos
Ce projet de recherche a tenté de quantifier l’influence du couvert forestier sur la dynamique arbustive à la limite des arbres au Nunavik. Spécifiquement, nous avons évalué si la présence de l’épinette noire (Picea
mariana (Mill.) B.S.P.) a un effet sur la croissance et la reproduction du bouleau glanduleux. Ce projet a
nécessité deux campagnes de récolte de données sur le terrain, ainsi que plusieurs mois de manipulations et d’analyses en laboratoire. Ce projet était de prime abord divisé en deux parties. La première partie descriptive traitait de la dynamique du bouleau glanduleux en milieu naturel, et est présentée dans le cadre de ce mémoire de maîtrise. La seconde partie était une étude expérimentale sur l’effet de changements climatiques simulés sur la croissance de plantules de bouleau glanduleux en milieu forestier. Cette expérience a été menée de front avec la cueillette de données de la partie descriptive, mais l’analyse des données a été transformée en projet d’initiation à la recherche de Mélissa Paradis. Un article intitulé “Response of Betula
glandulosa seedlings to simulated increases in nutrient availability, temperature and precipitation in a lichen
woodland at the forest-tundra ecotone” a d’ailleurs été publié en 2014 dans la revue Plant Ecology, vol. 215, p. 305-314. Je suis le 2e auteur de cet article, ayant contribué à la conception et à la réalisation de l’expérience ainsi qu’à la rédaction de l’article (auteurs : Mélissa Paradis, Caroline Mercier et Stéphane Boudreau).
Ce mémoire est constitué d’un article en anglais encadré d’une introduction et d’une conclusion en français. J’ai effectué les travaux de terrain, de laboratoire, d’analyse et de rédaction de l’article, et mon implication dans toutes les étapes du projet me place comme premier auteur de l’article. Le tout a été réalisé sous la supervision de mon directeur Stéphane Boudreau, second auteur, et l’article sera soumis à la revue Botany.
Introduction
Il est maintenant accepté par une vaste majorité de scientifiques que les changements climatiques actuels sont attribuables à une augmentation des gaz à effet de serre d’origine anthropique. Le réchauffement de l’atmosphère et des océans au niveau planétaire en est sans doute la conséquence la plus ressentie. Outre l’augmentation de 0,85°C de la température globale depuis 1880 (GIEC 2013), de nombreux autres effets sont également observés : fonte accélérée de la glace, élévation du niveau moyen de la mer, augmentation du nombre et de l’intensité de plusieurs phénomènes météorologiques tels que les cyclones et ouragans, etc. Sans changement dans le niveau d’émissions de GES, cette tendance devrait se maintenir et pourrait même s’accélérer (Serreze et al. 2000; Hinzman et al. 2005).
Les changements climatiques ne sont toutefois pas spatialement homogènes. En effet, les conséquences des changements climatiques observées depuis 1950 dans les régions de hautes latitudes, tant en Arctique qu’en Antarctique, sont déjà plus importantes que celles observées ailleurs sur la planète (ACIA 2005; GIEC 2013). De plus, alors que la température a augmenté de 1°C à 2°C par décennie au cours des 30 dernières années dans certaines régions de l’Arctique (Serreze et al. 2000), d’autres régions, dont le nord du Québec, montraient une inertie thermique, voire même un refroidissement (Serreze et al. 2000). Toutefois, depuis les années 1990, la tendance observée au Québec subarctique est au réchauffement (Chouinard et al. 2007).
Une telle élévation de température moyenne a de nombreuses conséquences pour la dynamique des écosystèmes terrestres et aquatiques. Parmi les plus importants, notons la fonte du couvert nival, des glaciers, des calottes glaciaires et du pergélisol, et l’allongement de la saison sans neige (Serreze et al. 2000; ACIA 2005; Hinzman et al. 2005). Cette absence prolongée du couvert nival pourrait avoir un effet rétroactif sur le réchauffement régional en réduisant l’albédo de la surface du sol, ce qui augmenterait l’absorption du rayonnement solaire et accélèrerait le réchauffement de la basse atmosphère (Sturm et al. 2005).
Toutes ces modifications découlant des changements climatiques ont évidemment des répercussions sur les communautés végétales des régions froides. Les espèces nordiques doivent composer avec une saison de croissance courte, des températures annuelles généralement basses, des conditions hivernales rigoureuses et un milieu relativement pauvre en nutriments (Press et al. 1998). Toutefois, ces conditions sont et seront modifiées par les changements climatiques actuels. De nombreuses études ont d’ailleurs montré que les espèces végétales des régions nordiques sont particulièrement sensibles aux changements climatiques, que ce soit par rapport à l’expression de leur phénologie ou à leur répartition géographique (Chapin et al. 2005; Hinzman et al. 2005; Hollister et al. 2005).
Les changements climatiques entraînent des modifications dans la phénologie, la répartition géographique et la forme de croissance des espèces végétales à leur limite septentrionale (Walther 2004). Plusieurs espèces voient actuellement leur saison de croissance devancée ou retardée de quelques jours à quelques semaines (Wookey et al. 1993; Badeck et al. 2004; Andrews et al. 2011). Il est d’ailleurs reconnu que la fonte accélérée du couvert nival permet aux plantes de débuter leur croissance plus tôt en saison, lorsque l’eau est abondante et le rayonnement solaire presque à son maximum annuel (Hinzman et al. 2005). De plus, de nombreuses remontées et densifications des limites altitudinales et latitudinales des arbres en milieu subarctique ont été remarquées durant le dernier siècle, par exemple chez l’épinette blanche (Picea mariana (Mill.) B.S.P.) au Yukon (Danby et Hik 2007), en Alaska (Hinzman et al. 2005) et au Québec (Caccianiga et Payette 2006), ainsi que chez le mélèze (Larix laricina (du Roi) Koch) au Québec (Dufour-Tremblay et al. 2012a). De plus, de nombreux travaux sur des espèces arborescentes montrent un passage de la forme prostrée à la forme érigée à la limite des arbres, passage qui s’accompagne généralement d’une production accrue de graines viables, augmentant ainsi la probabilité de colonisation future au-delà de la limite de répartition actuelle des espèces (Caccianiga et Payette 2006; Dufour-Tremblay et Boudreau 2011). Toutefois, à l’échelle planétaire, le constat actuel suggère que les limites des arbres ne sont pas toutes en progression, plusieurs limites montrant une forte inertie dans le contexte des changements climatiques actuels (Harsch et al. 2009). Du côté des espèces arbustives, des travaux dans plusieurs régions de l’hémisphère nord ont révélé des changements de forme de croissance et ont mis en évidence que des espèces basses et rampantes pouvaient passer à une forme de croissance érigée entre autres à cause des changements du climat (Myers-Smith et al. 2011).
Les espèces de la strate arbustive seraient particulièrement aptes à répondre positivement et rapidement aux changements climatiques, tel que le suggère un nombre croissant d’études (Sturm et al. 2001b; Sturm et al. 2005; Aerts et al. 2006). Plusieurs suivis à long terme ont permis de détecter une augmentation de l’abondance des arbustes (Hudson et Henry 2009; Forbes et al. 2010; Danby et al. 2011; Hallinger et Wilmking 2011; Hedenas et al. 2011; Naito et Cairns 2011; Rundqvist et al. 2011). Des études dendrochronologiques ont aussi montré que l’augmentation récente de la croissance radiale de plusieurs espèces d’arbustes est positivement corrélée aux températures plus chaudes et aux précipitations sous forme de neige (Forbes et al. 2010; Hallinger et al. 2010; Schmidt et al. 2010; Weijers et al. 2010). Cette densification des arbustes, si importante que le terme shrubification est maintenant utilisé dans la littérature (Callaghan et al. 2011; Myers-Smith et al. 2011), se manifeste de trois façons, soit par une densification des peuplements existants, par une augmentation de la croissance ou par une avancée de la limite de répartition arbustive ou une colonisation de nouveau milieux (Callaghan et al. 2011; Myers-Smith et al. 2011).
Il est généralement admis que la densification de la strate arbustive actuellement en cours dans les régions arctiques et subarctiques serait due à un ensemble de facteurs, dont les changements du climat (Tape et al.
2006; Myers-Smith et al. 2011). Toutefois, il est difficile d’identifier précisément tous les facteurs responsables de cette augmentation arbustive. En effet, selon certains auteurs, elle pourrait être liée au réchauffement constant qui a lieu depuis la fin de l’Holocène plutôt qu’au réchauffement climatique récent (Tape et al. 2006; Kammer et al. 2007). De plus, certaines études mentionnent que le relâchement de la pression de broutement causé par les herbivores pourrait aussi avoir déclenché ou favorisé l’augmentation de la densité des arbustes (Olofsson et al. 2005; Olofsson et al. 2009; Tremblay et al. 2012), car il est reconnu que les herbivores tels que le caribou (Rangifer tarandus), le lemming (Lemmus lemmus) et les larves des papillons de la famille des
Geometridae peuvent réduire la densité des arbres et arbustes (Olofsson et al. 2009; Van Bogaert et al. 2009;
Van Bogaert et al. 2011; Grau et al. 2012).
Il est également reconnu que les changements climatiques peuvent modifier la richesse spécifique, la diversité, la productivité ou la hauteur des communautés végétales, en favorisant, dans la majorité des cas, les espèces arbustives (Chapin et al. 1995; Callaghan et al. 2011). Des expériences de réchauffement et des suivis de communautés à long terme ont d’ailleurs mis en évidence que ces changements pouvaient se produire en quelques années seulement (Walker et al. 2006; Wilson et Nilsson 2009; Odland et al. 2010; Danby et al. 2011). Il peut aussi arriver qu’aucun changement de diversité ne soit observé, mais que les arbustes aient causé une augmentation de la hauteur du couvert végétal et de la biomasse de la communauté (Hudson et Henry 2009). Toutefois, il a aussi été remarqué que le couvert végétal et la densité peuvent augmenter sans que les arbustes ne deviennent nécessairement dominants dans l’écosystème (Danby et al. 2011).
La densification des arbustes déjà observée en milieu nordique devrait se poursuivre avec l’augmentation de la température (Johnson et al. 2011). À l’échelle du paysage, cette modification de la structure verticale de la végétation aurait plusieurs conséquences sur le couvert nival, sur les échanges de nutriments ainsi que sur l’albédo (Myers-Smith et al. 2011). En effet, l’augmentation du couvert de végétation augmente l’absorption de l’énergie solaire et réduit l’albédo, ce qui pourrait causer un mécanisme de rétroaction en allongeant la saison sans neige et en augmentant davantage le réchauffement atmosphérique (Hinzman et al. 2005). Un autre mécanisme de rétroaction possible avec l’augmentation du couvert arbustif implique l’activité des microorganismes sous le couvert nival en saison hivernale (Sturm et al. 2005). Ces décomposeurs augmentent de façon non négligeable la quantité de nutriments disponibles au printemps pour la végétation. Comme les arbustes interceptent et retiennent la neige balayée par le vent, la couche isolante sous-jacente devient plus importante (par accumulation mais aussi par diminution de la sublimation), ce qui peut réduire les impacts négatifs de la dessiccation et de l’abrasion par le vent et les cristaux de glace. L’augmentation de la température du sol qui en résulte peut également favoriser l’activité des microorganismes et la minéralisation. De plus, les feuilles et la matière organique ont aussi tendance à s’accumuler sous les arbustes, apportant
potentiellement une source supplémentaire de nutriments. Ce mécanisme pourrait ainsi stimuler davantage la croissance des arbustes en milieu nordique (Sturm et al. 2001a; Sturm et al. 2005). Toutefois, il est encore difficile de prédire dans quelle mesure et dans quelle direction tous ces mécanismes de rétroaction pourraient survenir, et il est probable que différents processus exercent des influences opposées sur la végétation. Il est toutefois convenu qu’une densification de la strate arbustive altèrerait la structure et le fonctionnement des écosystèmes nordiques (Myers-Smith et al. 2011).
L’augmentation de la densité ou de l’aire de répartition des arbustes à cause des changements climatiques est bien documentée pour les milieux ouverts mais très peu en milieu forestier. Bien que les arbustes fassent partie intégrante du paysage forestier et puissent influencer grandement la dynamique des écosystèmes subarctiques, seules quelques études mettent en lumière des interactions arbres - arbustes. Par exemple, des expériences en serre et sur le terrain ont montré que la présence d’Empetrum hermaphroditum Hagerup (Böcher) réduit la germination, l’établissement et la croissance de Pinus sylvestris L., Populus tremula L. (Zackrisson et Nilsson 1992) et Betula pubescens ssp. Czerepanovii (Orl.) Hämet-Ahti (Weih et Karlsson 1999), toutes des espèces de limites des arbres en Europe. Une autre expérience menée par Grau et al. (2012) en Suède a montré que la présence de l’arbuste Vaccinium myrtillus L. a augmenté la survie de plantules de Betula pubescens mais a réduit leur performance (diminution du nombre et de la surface des feuilles, diminution du diamètre des tiges). De plus, la performance des plantules de ce bouleau arborescent a été plus grande en forêt qu’à la limite des arbres, mais leur réaction au réchauffement et à l’ajout de nutriments a été plus prononcée à la limite des arbres. Un autre exemple d’interaction arbre - arbuste a aussi été mis en évidence entre le pin arbustif Pinus mugo ssp. Murghus [Scop.] Domin et l’épinette Picea excelsa [Lam.] Link qui forme souvent la limite altitudinale des arbres en Europe. Le pin réduit le recrutement et la croissance de l’épinette, tout en la protégeant des herbivores (Dullinger et al. 2005). De plus, bien que l’épinette puisse s’établir en présence de pin en basse altitude, les branches basses de ce dernier empêchent la reproduction par marcottage de l’épinette en haute altitude et marquent la fin de sa répartition altitudinale (Plesnik 1973). Les interactions arbres - arbustes sont donc un important moteur de la dynamique des limites des arbres subarctiques (Grau et al. 2012), mais beaucoup de travail reste à faire pour comprendre la dynamique de la strate arbustive et son rôle à la limite des arbres dans le contexte actuel des changements climatiques.
En milieu arctique et subarctique, les arbustes sont d’une grande importance et peuvent former des peuplements très denses et dominants sous de bonnes conditions. Les différentes espèces d’arbustes n’ont cependant pas toutes la même capacité à atteindre la dominance dans les milieux nordiques. Certaines espèces possèdent des avantages compétitifs par rapport aux autres plantes arctiques et subarctiques, par exemple en ayant une meilleure capacité à acquérir leurs ressources (Sturm et al. 2005; Myers-Smith et al.
2011). Un bon exemple est Betula nana L., qui, soumis à un réchauffement expérimental ou une augmentation de nutriments, montre une forte augmentation de sa croissance axiale et une augmentation de sa biomasse (Bret-Harte et al. 2001; Bret-Harte et al. 2002). Cette espèce de bouleau arbustif atteint un niveau de dominance compétitive notamment par sa capacité à produire de longues tiges et de nouveaux méristèmes, ce qui lui permet de réduire la croissance des espèces sous-jacentes (Chapin et Shaver 1996; Hobbie et Chapin 1998). Cette dominance d’une seule espèce arbustive peut freiner le recrutement des espèces des strates inférieures par diminution de la lumière et par compétition accrue pour l’eau et les nutriments, causant ainsi un changement important de la composition et de la succession de la communauté (Royo et Carson 2006). L’abondance et les caractéristiques des arbustes leur confèrent donc un rôle structurant dans ces écosystèmes, ce qui explique l’engouement scientifique récent pour l’étude de leur dynamique.
Au Québec, la principale espèce arbustive structurante à l’écotone forêt boréale - toundra (EFT) est le bouleau glanduleux (Betula glandulosa Michx.; Boudreau et Villeneuve-Simard 2012). À Kangiqsualujjuaq par exemple, il recouvre près de la moitié du territoire (Tremblay et al. 2012). Sa grande amplitude écologique se reflète dans le fait qu’on le retrouve dans tous les types d’habitats, que ce soit dans les milieux humides ou tourbeux, dans les milieux forestiers ou sur les sommets dénudés, rocheux et exposés. On le retrouve du centre des États-Unis jusqu’au nord du Canada, et à travers tout le continent de l’Alaska jusqu’au Groenland. Le bouleau glanduleux peut croître sous forme érigée (jusqu’à 2,5 mètres de hauteur) ou prostrée selon son degré d’exposition au vent (de Groot et Wein 2004). Depuis quelques décennies, son expansion a été observée en milieu subarctique en réponse aux changements climatiques, par la densification de peuplements existants ou par la colonisation de nouveaux sites. Cette expansion s’est effectuée soit par le biais d’une augmentation de la croissance clonale, soit par une augmentation de la reproduction sexuée (Myers-Smith et al. 2011). En effet, en région tempérée et subarctique, le bouleau glanduleux peut produire jusqu’à 13 000 graines par mètre carré (Weis et Hermanutz 1988). Les graines de bouleau, des samares, contiennent un seul embryon et sont dispersées par le vent.
Toutefois, Betula glandulosa n’apparaît que depuis peu dans les études portant sur les changements climatiques, sur la dynamique des milieux nordiques et sur les limites des arbres, comparativement à ses homonymes génériques Betula nana L. et Betula pubescens Ehrh. Deux études de comparaison de photos aériennes ont toutefois mis en évidence la forte augmentation des arbustes dans les milieux ouverts au Québec subarctique durant les dernières décennies, une à l’est (Tremblay et al. 2012) et l’autre à l’ouest (Ropars et Boudreau 2012). Ces travaux montrent que le bouleau glanduleux est lui aussi en pleine expansion en réponse aux changements climatiques récents.
Vu l’importance écologique du bouleau glanduleux en milieu subarctique et particulièrement dans le nord du Québec, une meilleure compréhension de sa réponse face aux changements environnementaux est nécessaire pour prédire l’évolution du paysage subarctique. Les quelques travaux effectués sur le bouleau glanduleux ont concentré leurs efforts sur les milieux ouverts, bien que cette espèce soit également une composante importante des écosystèmes forestiers subarctiques. Boudreau et Villeneuve-Simard (2012) ont d’ailleurs mis en évidence que la performance du bouleau glanduleux serait probablement limitée par la présence de l’épinette. En effet, après suppression du couvert forestier dans une pessière à lichens à l’EFT, la croissance radiale du bouleau glanduleux s’est trouvée fortement accrue et davantage corrélée aux degrés-jours, alors qu’en milieu forestier la croissance du bouleau ne semblait pas reliée à la température. Ceci suggère qu’en milieu forestier, le bouleau souffre probablement de la compétition avec l’épinette pour l’eau et les nutriments, en plus des contraintes climatiques, alors qu’en milieu ouvert, seules les contraintes climatiques semblent importantes.
L’objectif de ce projet de recherche est donc d’évaluer l’influence du couvert forestier sur la performance du bouleau glanduleux à la limite des arbres, afin de tenter de mieux comprendre l’écologie du bouleau glanduleux à l’EFT. Pour ce faire, l’abondance, la reproduction et la croissance du bouleau ont été évalués le long d’un gradient de couvert forestier, en posant l’hypothèse que la présence de l’épinette diminue la performance du bouleau. Nos prédictions sont que plus le couvert arborescent est important, plus la germination des graines, le nombre de chatons et le recouvrement de Betula glandulosa devraient être faibles. De plus, il est postulé que plus le couvert forestier est abondant, plus la croissance radiale des tiges de bouleau devrait être faible, et devrait s’accompagner d’une relation moins forte avec la température, tel qu’observé dans l’étude de Boudreau et Villeneuve-Simard (2012). Toutefois, comme nous croyons que le couvert forestier peut apporter une plus grande protection hivernale des arbustes (contre l’abrasion par la neige et la glace), nous postulons qu’un plus fort couvert arborescent devrait s’accompagner d’une hauteur plus importante des individus de Betula glandulosa.
Article
INFLUENCE OF TREE COVER ON THE PERFORMANCE BETULA GLANDULOSA MICHX., AN ABUNDANT SHRUB SPECIES IN SUBARCTIC QUÉBEC
Authors: Caroline Mercier and Stéphane Boudreau
Résumé
Au Nunavik, Betula glandulosa Michx. est en pleine expansion en milieu ouvert, que ce soit par la densification des peuplements préétablis ou la colonisation de nouveaux sites. Mais qu’en est-il en milieu forestier où le couvert arborescent peut avoir un effet supérieur au climat sur la croissance de B. glandulosa? L’objectif de ce projet était d’évaluer la performance de B. glandulosa le long d’un gradient de fermeture de couvert forestier à l’écotone forêt-toundra. Les résultats montrent que le couvert forestier influence négativement celui de B.
glandulosa, mais qu’il a un impact limité sur la hauteur, le nombre de chatons et la germination des graines.
L’analyse dendrochronologique révèle une relation entre la croissance radiale et les températures printanières et automnales. Toutefois, l’absence d’un signal climatique fort pour les mois d’été, contrairement aux observations effectuées en milieu ouvert, suggère que la présence d’un couvert forestier peut masquer les effets du climat.
Abstract
Shrubs are one of the most abundant functional groups within arctic and subarctic ecosystems. At the forest – tundra ecotone (FTE), shrubs are found in open tundra as well as in forested ecosystems. In this region, dwarf birch (Betula glandulosa Michx.), the most abundant deciduous shrub species, has increased in abundance in the tundra sites over the last 50 years. There is however no evidence that such trend has occurred in forested stands, where it has been observed that the presence of a black spruce cover (Picea mariana (Mill.) B.S.P., ca. 25%) might influence dwarf birch growth more than the local climatic conditions. A better characterization of B. glandulosa growth and reproduction in forests is therefore essential to improve our understanding of the FTE dynamics. Thus, the objective of this project is to evaluate B. glandulosa performance along a tree cover gradient at the FTE in the context of a rapid climate change. We hypothesize that tree cover reduces the performance of B. glandulosa, and we predict that cover, radial growth, growth-climate relationship and reproductive output of B. glandulosa will decrease with an increasing tree cover. Spruce-lichen woodlands with varying tree cover were selected in the Boniface River area (Nunavik, Québec, Canada, 57°45’ N, 76°09’ W). Stems of B. glandulosa were sampled for dendrochronological analyses, vegetation was surveyed, catkins were counted and germination trials were conducted. Results show that B. glandulosa abundance is lower when forest cover is higher, but tree cover has only a limited effect on height, catkin abundance or seed germination. Mean radial growth chronologies revealed a rather weak climatic signal for all sites, but a stronger relationship with climate and growth season length was observed during the 1990 – 2009 period. The main climate drivers of radial growth were the mean and minimal temperatures in October of the previous year, and in March and May of the current year. Association with high spring temperatures might be related to earlier snowmelt and a longer growth season, and high fall temperatures can be synonymous with delayed protection by snow cover. The relation between radial growth and recent temperatures may be related to climate warming, but also to a better common signal between all chronologies for the recent period due to the young age of our samples. The climate signal is not function of tree cover, a possible sign of competition with trees even a low density. Phenology differences may occur between forest and open sites, but further analyses are necessary to explain the low differences seen in reproductive output.
Introduction
The structural complexity of forested ecosystems generally decreases with increasing latitudes (Terborgh 1985). While tropical forests tend to harbour a complex vertical structure with up to six well-developed vegetation layers (Gurevitch et al. 2002), boreal forests are much simpler, with only two or three vegetation layers. One vegetation layer common to many forested ecosystems worldwide is the shrub layer. When abundant, shrub species can form a dense recalcitrant understory layer, which can alter ecological interactions between different plant species or even inhibit natural succession of forested ecosystems (Royo and Carson 2006). Such shrub layers can inhibit the recruitment and growth of other species through a significant increase in resource competition, litter accumulation or favoured seed/seedlings predators (Cater and Chapin 2000; Schreiner et al. 2000; Nilsen et al. 2001). In boreal ecosystems, where nutrients are believed to be more limiting than light, dense understories can interfere with other species by increasing belowground competition (Hartman and McCarthy 2007). Moreover, some shrub species are known to release allelopathic compounds that inhibit seed germination and establishment of other species (Nilsson 1994; Jaderlund et al. 1997; Dufour-Tremblay et al. 2012b).
Over the last decades, tundra plant communities submitted to extensive warming have undergone significant changes in their composition (species diversity and equitability), structure (cover and height) and productivity (Myers-Smith et al. 2011; Naito and Cairns 2011). These changes are thought to be associated with recent increases in temperature and snowfall (Kammer et al. 2007; Wilson and Nilsson 2009; Odland et al. 2010; Callaghan et al. 2011; Danby et al. 2011). Another prominent change is the expansion of shrub species, also called shrubification, observed in the circumpolar region (Sturm et al. 2001b; Tape et al. 2006; Myers-Smith et al. 2011; McManus et al. 2012; Ropars and Boudreau 2012; Tremblay et al. 2012) through infilling of existing shrub patches, increase in growth (both radial and vertical) or shrubline shift (Myers-Smith et al. 2011). For example, shrub expansion in Nunavik (subarctic Québec) has been mainly associated with the expansion of
Betula glandulosa Michx. (dwarf birch; Ropars and Boudreau 2012; Tremblay et al. 2012), a very abundant
species occupying a broad ecological niche, as it is found in almost all habitats, from dry and exposed hilltops to wet and peaty valleys. Although experimental studies have shown that shrub species can respond rapidly to warming temperatures (Chapin et al. 1995; Grau et al. 2012; Walker et al. 2006), it has also been argued that shrubification may result from a long-term and constant warming since the beginning of the Holocene (Tape et al. 2006) or to a release of the grazing pressure (Olofsson et al. 2009; Van Bogaert et al. 2009; Van Bogaert et al. 2011).
Most reports of shrub species expansion have been observed in the open tundra, while observations of shrub species dynamics in forested ecosystems are scarce or inexistent. To our knowledge, the only study on B.
glandulosa dynamics in an open forest ecosystem is from Boudreau and Villeneuve-Simard (2012). In this
study, the authors took advantage of an old experimental clear-cut (1200 m2, 1987) in a lichen woodland at the forest tundra ecotone (FTE) to evaluate B. glandulosa performance. The sudden temperature-related increase in radial growth following tree removal, combined with the lack of response of individuals located in an adjacent undisturbed forest, strongly suggests that B. glandulosa suffers from competitive interactions from the tree cover.
The objective of this study is to characterize B. glandulosa performance in forest environments at the treeline, in order to better understand dynamics of the FTE in the context of rapid climate change. To do so, B.
glandulosa abundance, growth and reproduction were characterized along a Picea mariana (Mill.) B.S.P.
(black spruce) cover gradient. We hypothesize that tree cover reduces B. glandulosa’s performance, and based on findings from Boudreau and Villeneuve-Simard (2012), we predict that cover, radial growth and reproductive output of B. glandulosa will be lower with a more important P. mariana cover. We also predict that the climatic signal in B. glandulosa radial growth chronologies will be depleted with abundant tree cover. However, we expect that a more important tree cover will provide greater protection to shrub species during the winter season (from snow and ice abrasion), so we predict that a denser P. mariana cover will promote higher B. glandulosa individuals.
Material and methods
Study area
The study area is located near the Boniface River research station of the Centre d’études nordiques in Nunavik (57°45’ N, 76°09’ W), 48 km east of the Hudson Bay coast and 10 km south of the subarctic treeline (Figure 1). According to Inukjuak’s meteorological station (58°47’ N, 78°08’ W), located approximately 140 km to the northwest, mean annual temperature between 1970 and 2009 was -6.5°C and February and July were respectively the coldest (-25.5°C) and the warmest (10.2°C) months (Environment Canada 2012). The 1995 – 2009 period was the warmest since 1946 (Figure 2), and this warming coincides with the beginning of an increase in B. glandulosa radial growth in the Boniface River area (P. Ropars, pers. obs.). The same temperature pattern with a significant increase during the last decade is observed in the Whapmagoostui- Kuujjuarapik region (55°15’ N, 77°45’ W) located 300 km southwest (Bhiry et al. 2011). According to Payette (2000) and Pereg (1998), annual precipitation averages 550 mm of which 35% falls as snow, and the growth season without frost events lasts ca. 60 days, from mid-June until mid-August.
Figure 1. Study site in Nunavik, Québec (57°45’ N, 76°09’ W). The Boniface River research station of the Centre d'études nordiques is located 10 km south of the subarctic treeline.
Figure 2. Mean annual temperatures for 1945 – 2009 from Inukjuak’s meteorological station. The onset of warming of air temperature in the region is shown with two different regression lines (before and after 1995) and their equation and regression coefficients.
The landscape of the region is characterized by afforested hilltops colonized by shrub and lichen species while forest stands, dominated by P. mariana, are confined to less exposed sites. The most abundant shrub species (B. glandulosa, Empetrum hermaphroditum Hagerup (Böcher) (black crowberry), Salix spp., Vaccinium spp. and Rhododendron spp.) are found in both open and forest ecosystems. Overall, the landscape physiognomy results from the interactions between harsh climatic conditions and the fire regime over the last few millennia (Payette and Gagnon 1985; Payette et al. 1989). For example, post-fire P. mariana regeneration was inhibited over the last thousand years by cooler temperatures (Sirois and Payette 1991; Asselin and Payette 2005), which resulted in a gradual deforestation at the landscape level.
Site selection
In order to study how B. glandulosa performance (abundance, growth, reproductive output) varies in forest ecosystems along a P. mariana cover gradient, we identified 23 potential P. mariana stands in June 2010 with aerial photographs and field observations. All forested sites were well-drained, spruce-lichen woodlands with similar wind-exposition, drainage, slope and altitude. All trees had an erect growth form (>3 m high). Sites were classified according to their approximate tree cover: ca. 1-10% (5 sites), ca. 10-20% (11 sites) and ca. 20% and more (7 sites). Three sites in each cover class were randomly selected, for a total of nine forested sites. Three unforested sites located on well-drained, low altitude sandy terraces along the Boniface River were also randomly selected out of 50 terraces previously identified on aerial photographs (Ropars P., unpubl. data). y = -0.01x + 20.35 R² = 0.03 y = 0.05x - 97.85 R² = 0.03 -12 -10 -8 -6 -4 -2 0 1945 1955 1965 1975 1985 1995 2005 Me an temp er at u re( °C) Year
Vegetation surveys
Cover of B. glandulosa and P. mariana were evaluated at each site in 2010. To do so, three parallel 50 m transects (10 m apart, total of 150 m) were randomly laid down and surveyed. The starting point of the first transect was the landing point of an object thrown randomly in the site, and the other transects were displayed systematically after the first one. Along the transect lines, B. glandulosa and P. mariana cover were recorded for every cm. In 2011, additional vegetation surveys were conducted (3 x 25 m transects) to evaluate the cover of other shrub species, except Vaccinium vitis idaea L. that was excluded from the surveys due to its very diffuse growth form. Height of B. glandulosa was measured for 20 individuals systematically every 4 m along the three transects.
Dendrochronological analyses
To evaluate B. glandulosa growth along the P. mariana cover gradient, we sampled stems for dendrochronological analyses. We sampled the largest stem of the nearest individual every 3 m perpendicularly along the survey lines. Stems were cut as low as possible. If no individual was located at the pre-determined location, another individual was sampled within 2 m. This procedure was performed until 40 stems were sampled. In the few instances where less than 40 stems were sampled along the lines, individuals located between the survey lines were sampled to reach 40 stems.
All of the stems collected were processed at their base for dendrochronological analyses. Because B.
glandulosa growth rings cannot be easily seen with traditional dendrochronological methods, all stems were
mounted on microscope slides. To do so, samples were boiled for at least two hours, sliced (ca. 25 µm) using a rotary microtome (Otto C. Watzka, Montréal) stained in a 1% safranin solution (Safanin O, Fischer Science Education), dried and permanently mounted between a slide and a glass cover with a 66% toluene solution (SHUR/mountTM liquid cover glass, Triangle biomedical sciences, Durham, NC, USA). On each sample, annual rings were counted and measured under a dissecting microscope (40 X) along two radii. Growth rings measurements were made using a Velmex sliding stage micrometer with a digital encoder having a precision of 0.02 mm (Velmex Inc., Bloomfield, New York).
A mean tree-ring growth chronology was built for every site. First, the width curves of the two radii measured on every sample were visually crossdated, which means the patterns of wide and narrow rings were matched. These mean individual tree-ring width curves were associated to calendar years by statistical crossdating between individuals using the software COFECHA (Grissino-Mayer 2001). The tree-ring widths were standardized to allow comparison between individuals and to remove variability due to factors other than climate, such as growth trends related to age or disturbances like insect outbreaks. The detrending method used was a horizontal line fitted to the mean of the width curve. This standardization method was chosen
because there was no general growth trend among our individuals, and because we were interested in keeping the variability associated with the climatic signal as much as possible (Weijers et al. 2010). By dividing the widths by their corresponding values on the line, we obtained dimensionless indexes calculated with the ARSTAN software (Cook and Holmes 1986). The quality of the chronologies was verified with the expressed population signal (EPS) and the signal-to-noise ratio (SNR; Fritts and Swetnam 1989; Wigley et al. 1984). The EPS quantifies how a chronology made with a certain number of individuals reflects the whole population or the true hypothetical chronology, and the signal-to-noise ratio reveals the proportion between the common signal and the noise among a chronology. There is no significance threshold for this last statistic, since the noise present in a chronology is different between species and locations (Fritts and Swetnam 1989; Cook and Pederson 2011).
Response functions were used to determine the presence and nature of growth-climate relationships (Guiot 1986; Fritts and Swetnam 1989). Growth chronology indexes were regressed to Inukjuak’s mean, maximum and minimum monthly temperatures, growing degree-days and total monthly precipitation from 1947 – 2009. Bootstrapped confidence intervals were used to estimate the significance of the response coefficients in the
BootRes package for the R software (R Development Core Team, 2012) described by Zang et Biondi (2013).
The period analysed extended from September of the previous growth year to August of the current growth year, because radial growth is influenced by climatic conditions several months prior to ring formation (Fritts 1976). Analyses were run either with the full chronologies or with only the last two decades to verify if there was an effect of recent warming. The shortest period that could be analysed with the BootRes package differed between climatic parameters due to missing data, so the recent periods varied from 1990 – 2009 for mean temperature, 1988 – 2009 for minimal and maximal temperature and 1986 – 2005 for precipitations.
Pearson correlation coefficients were used to compare radial growth to the length of the growth season and the annual number of growing degree-days. The growth season was calculated as the number of days where the mean temperature reached 5°C or higher between May and September. Growing degree-days were the sum of degrees above 5°C, considered as the minimal threshold at which photosynthetic activity occur. Regressions were also made between radial growth and degree-days, and paired t-tests were used to assess differences between regressions for the full chronologies and for the 1995 – 2009 period.
Seed viability
To evaluate the reproduction potential of B. glandulosa, catkins were counted and harvested on 20 individuals at each site. The individuals were chosen systematically every 4 m along two parallel transects located between the vegetation survey transects. For each individual, all female catkins were counted on the largest stem. Later in the season, at least 10 mature catkins were collected on 10 of the 20 pre-identified individuals.
Back in the laboratory, a germination trial was conducted. For every individual, 50 seeds were randomly collected among the 3 – 4 most mature catkins. Seeds were placed in a 100 mm Petri dish over a 90 mm wet filter paper and incubated in a growth chamber at 25/15°C with a 16 h photoperiod. Seeds were watered when needed and germination was recorded every second day for 7 weeks.
Statistical analyses for cover, height and reproductive output
Regressions were used to verify the significance of relationships between different parameters: cover of P.
mariana, B. glandulosa, E. hermaphroditum, and height of B. glandulosa. All regressions were validated with
ANOVAs, but only for forest sites, as terraces are more exposed environments with different edaphic conditions. All calculations were performed using the R software.
Results
Betula glandulosa cover and height
Picea mariana was the only tree species recorded along the vegetation survey lines. Its cover ranged from
5.1% to 28.5% in the forest ecosystems (Table 1). Nine shrub species were also recorded (B. glandulosa, E.
hermaphroditum, Rhododendron groenlandicum (Oeder) Kron & Judd, Vaccinium uliginosum L., Rhododendron tomentosum Harmaja, Salix sp., Phyllodoce caerulea (L.) Bab., Kalmia procumbens (L.) Gift,
Kron, & P.F. Stevens ex Galasso, Banfi & F. Conti, Arctostaphylos alpina (L.) Spreng). Cover of B. glandulosa varied from 0%, in a site where birch was scarce and no individuals were recorded on the survey lines, to 69.4% in a site where it was largely dominant. There was a significant negative relationship between B.
glandulosa and P. mariana cover (Figure 3 A, F1, 7 = 25.3, P = 0.002), while the cover of the second most abundant shrub species, E. hermaphroditum, was positively associated to P. mariana cover (Figure 3 B, F1, 7 =
9.67, P = 0.02).
Dwarf birch mean height was 52.4 ± 17.6 cm on the terraces and 111.8 ± 29.6 cm in the forests (Table 1). No relationship was found between birch height and tree cover (Figure 3 C, F1, 7 = 1.66, P = 0.24), although there
was a marginally significant positive relationship between birch height and birch cover (Figure 3 D, F1, 7 = 4.51, P = 0.07).
Table 1. Cover percentage of tree and shrub species and mean height of B. glandulosa at every site. Percentage values are obtained from vegetation surveys, which give a single measurement with no variability for every species. Mean heights come from 20 individuals per site.
Site mariana Picea
(%) Betula glandulosa (%) Empetrum hermaphro- ditum (%) Other shrub species† (%) Betula glandulosa mean height (cm) Forest 1 23.2 5.6 37.7 6.0 90.3 ±42.7 Forest 2 28.5 7.5 28.4 11.2 94.6 ±35.8 Forest 3 25.1 0.0 36.2 19.5 119.5 ±31.2 Forest 4 18.8 21.5 19.5 3.8 108.2 ±31.4 Forest 5 21.6 18.8 37.5 16.6 114.7 ±32.2 Forest 6 23.6 28.7 23.4 19.7 112.2 ±24.5 Forest 7 10.6 69.4 0.0 3.1 129.8 ±28.1 Forest 8 11.3 61.5 12.6 15.6 132.9 ±21.5 Forest 9 5.1 53.4 14.9 20.0 103.7 ±18.6 Terrace 1 0.0 60.7 0.6 7.0 51.9 ±20.8 Terrace 2 0.0 46.6 0.2 5.6 63.3 ±19.5 Terrace 3 0.0 14.3 1.3 16.0 41.9 ±12.5
† Rhododendron groenlandicum, Vaccinium uliginosum, Rhododendron tomentosum, Salix sp., Phyllodoce caerulea,
Figure 3. Regressions between height and/or cover of the shrub species B. glandulosa and E. hermaphroditum and the tree species P. mariana for the 9 forest sites. Significant relations are illustrated with solid-line regressions, marginally significant relations with dashed lines and non-significant relations show no regression line.
Radial growth
Of the 463 individuals sampled for dendrochronological analyses, 323 were successfully crossdated and included in the mean growth chronologies (
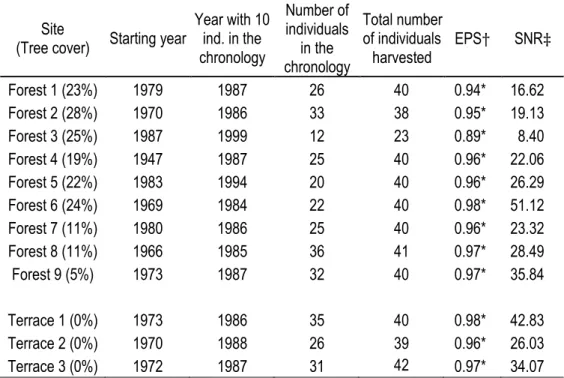
Figure 4). The oldest stems in the chronologies were 63 yr-old (1947 – 2009), though older stems (>98 years) were found but not successfully crossdated. For all sites except site 3, mean chronologies started between 1947 and 1983, but valid chronologies (at least 10 individuals) started from 1984 to 1994. All mean chronologies showed high EPS and SNR, suggesting the presence of a common signal within sites and overall good quality chronologies, with the exception of forest 3 chronology (Table 2). For that particular site, no B.
glandulosa individuals were recorded in the vegetation survey and only 26 individuals were found nearby.
y = -2.90x + 83.62 R² = 0.78 0 10 20 30 40 50 60 70 80 0 5 10 15 20 25 30 B. gl an du los a cove r (%) P. mariana cover (%)
A
y = 1.26x - 0.09 R² = 0.58 0 5 10 15 20 25 30 35 40 0 5 10 15 20 25 30 E. he rm ap hrodit u m cove r (%) P. mariana cover (%)B
80 90 100 110 120 130 140 0 5 10 15 20 25 30 B. gl an du los a mea n h eig h t (cm) P. mariana cover (%)C
y = 0.35x + 101.31 R² = 0.39 80 90 100 110 120 130 140 0 10 20 30 40 50 60 70 80 B. gl an du los a mea n h eig h t (cm) B. glandulosa cover (%)D
Consequently, growth-ring chronology was built with only the 12 samples that were successfully crossdated, resulting in a weaker common signal and a lower EPS and SNR.
Regressions and correlations between growth ring indexes and degree-days showed differences between the whole chronologies and the 1995 – 2009 period (Figure 5). The R2 and regression slopes of the 1995 – 2009
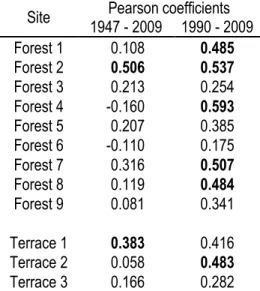
period were significantly higher than those for the whole chronologies (R2: T = -6.690, P < 0.001; regression slopes: T = -8.399, P < 0.001). Correlation between radial growth and the length of the growth season also revealed different responses for the whole and truncated chronologies. For the 1947 – 2009 period, chronologies of only two sites were correlated to growth season length, compared to 6 sites for the 1990 – 2009 period (Table 3).
Table 2. Length, number of individuals and statistical validity of B. glandulosa mean radial growth chronologies. Mean chronologies are calculated with annual growth ring measurement curves of B. glandulosa individuals successfully crossdated.
Site
(Tree cover) Starting year
Year with 10 ind. in the chronology Number of individuals in the chronology Total number of individuals harvested EPS† SNR‡ Forest 1 (23%) 1979 1987 26 40 0.94* 16.62 Forest 2 (28%) 1970 1986 33 38 0.95* 19.13 Forest 3 (25%) 1987 1999 12 23 0.89* 8.40 Forest 4 (19%) 1947 1987 25 40 0.96* 22.06 Forest 5 (22%) 1983 1994 20 40 0.96* 26.29 Forest 6 (24%) 1969 1984 22 40 0.98* 51.12 Forest 7 (11%) 1980 1986 25 40 0.96* 23.32 Forest 8 (11%) 1966 1985 36 41 0.97* 28.49 Forest 9 (5%) 1973 1987 32 40 0.97* 35.84 Terrace 1 (0%) 1973 1986 35 40 0.98* 42.83 Terrace 2 (0%) 1970 1988 26 39 0.96* 26.03 Terrace 3 (0%) 1972 1987 31 42 0.97* 34.07
† EPS: Expressed Population Signal, significant when > 0.85. ‡ SNR: Signal-to-Noise Ratio.
Figure 4. Mean radial growth chronologies of B. glandulosa on all sites. Histograms show the number of individuals included in the curves at every year. The detrending method used to calculate radial growth ring indexes was a horizontal line fitted to the mean curve, to keep as much climatic signal variability as possible.
Years R adi al grow th ring in de x N umbe r of i ndi vid ua ls
Figure 5. Regressions between growth ring indexes of B. glandulosa mean radial growth chronologies and growth degree-days (>5°C). All circles (empty and filled) and dashed lines represent full chronologies, and filled circles and solid lines represent the 1995 – 2009 period, when warming started in the region.
0 1 2 3 0 200 400 600 800 Forest 1 0 1 2 3 0 200 400 600 800 Forest 2 0 1 2 3 0 200 400 600 800 Forest 3 0 1 2 3 0 200 400 600 800 Forest 4 0 1 2 3 0 500 1000 Forest 5 0 1 2 3 0 500 1000 Forest 6 0 1 2 3 0 500 1000 Forest 7 0 1 2 3 0 500 1000 Forest 8 0 1 2 3 0 500 1000 Forest 9 0 1 2 3 0 500 1000 Terrace 1 0 1 2 3 0 500 1000 Terrace 2 0 1 2 3 0 500 1000 Terrace 3 Degree-days R adi al grow th ring in de x
Table 3: Pearson correlations between mean radial growth chronologies of B. glandulosa and the length of growth season in days, considered as the number of days where temperature was >5°C. Bold values are significant at P < 0.05.
Site 1947 - 2009 1990 - 2009 Pearson coefficients
Forest 1 0.108 0.485 Forest 2 0.506 0.537 Forest 3 0.213 0.254 Forest 4 -0.160 0.593 Forest 5 0.207 0.385 Forest 6 -0.110 0.175 Forest 7 0.316 0.507 Forest 8 0.119 0.484 Forest 9 0.081 0.341 Terrace 1 0.383 0.416 Terrace 2 0.058 0.483 Terrace 3 0.166 0.282
Response functions
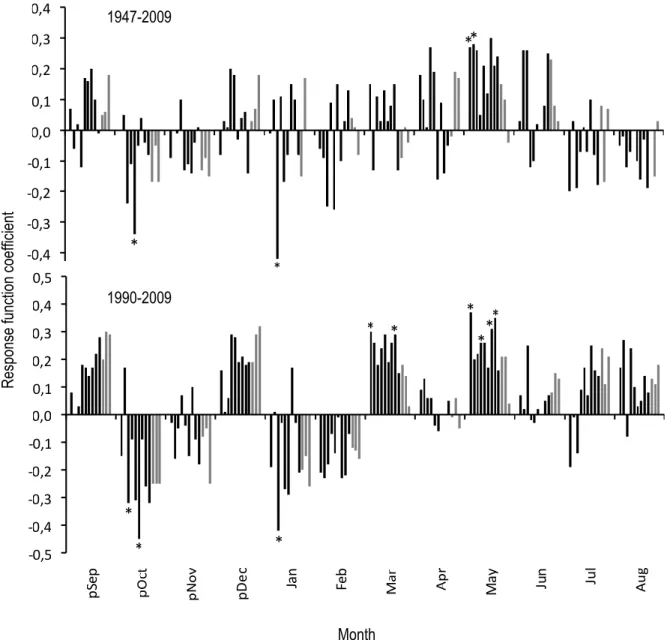
Response functions revealed that radial growth chronologies are not strongly and consistently associated with monthly temperatures. Moreover, responses are slightly different between the whole and the truncated chronologies. For the whole chronologies (1947 – 2009), significant function responses identified two sites for which the growth was negatively associated with either the mean temperatures in October or January, while the growth chronologies of two other sites were positively associated with mean temperatures in May (Figure 6). When looking at the truncated growth chronologies (1990 – 2009), sites 3 and 6 were negatively affected by October mean temperatures, while site 3 was negatively affected by January mean temperatures. Growth chronologies in four sites (#1, #4, #7, #8) were positively associated with the mean temperatures in May for the 1990 – 2009 period. When compared to the minimal mean temperature, this trend becomes even clearer since five sites (#1, #4, #7, #8, #9) were positively influenced by the mean minimal temperatures in May, compared to only one site for the whole chronologies (
Figure 7). There was no relationship between radial growth and monthly precipitations, maximal monthly temperatures or degree-days, regardless of the time period considered.
Figure 6. Response coefficients for mean monthly temperature from September of the previous year to August of the current year for the 12 mean radial growth chronologies of B. glandulosa. Positive coefficients indicate the positive influence of mean temperature of the corresponding month on radial growth, and vice-versa. Black bars are forest sites, grey bars are open sites, and bars are ordered by site number. Asterisks indicate months having a significant coefficient at P < 0.05. The 95% confidence intervals of the bootstrapped response functions are not shown. 1990 – 2009 was the shortest period that could be analyzed with this set of data.
R es pons e func tion coeff ic ient Month 1947-2009 1990-2009 *
Figure 7. Response coefficients for minimal monthly temperature of previous September to August. See Figure 6 for details. 1988 – 2009 was the shortest period that could be analyzed with this set of data.
R es pons e func tion coeff ic ient Month 1947-2009 1988-2009
Reproduction
B. glandulosa’s catkin abundance on a single stem ranged from 1 to 672, showing great stem-to-stem
variability. Mean catkin number per stem was 101 ± 94 in forest sites, and 154 ± 126 in terraces. However, catkin abundance was not function of forest cover (Figure 8 A, F1, 7 = 1.564, P = 0.251;).
Germination started in the first three days of the germination trial and stopped almost completely before the end of the third week. Seed germination ranged from 27.8% to 43.1%, with a mean of 38,2 ± 9,6% in forest sites and 41,6 ± 7,4% in terraces. There was no relationship between P. mariana cover and seed germination (Figure 8 B, F1, 7 = 0.359, P = 0.568).
Figure 8. Regressions between B. glandulosa mean number of catkins on a single stem, mean germination percentage and tree cover of P. mariana. Catkins were counted on 20 individuals and germination percentage was calculated from germination of seeds harvested from 10 individuals on every site. Error bars are not shown. 0 20 40 60 80 100 120 140 160 180 0 5 10 15 20 25 30 N u mber of ca tkin s p er st em P. mariana cover (%)
A
0 5 10 15 20 25 30 35 40 45 50 0 5 10 15 20 25 30 B. gl an du los a ger mina tio n (%) P. mariana cover (%)B
Discussion
The aim of this study was to assess if the performance of B. glandulosa, the dominant shrub species at the forest tundra ecotone in Nunavik, is influenced by the tree cover observed in lichen woodland. Previous work by Boudreau and Villeneuve-Simard (2012) strongly suggests that competition with trees exerts a stronger effect than climate on B. glandulosa performance. However, in this study, we only found that dwarf birch cover was negatively associated with P. mariana cover. Radial growth, for which we found only a weak climatic signal, and reproduction were not a function of the tree cover.
Betula glandulosa cover and height
The negative relationship between B. glandulosa and P. mariana cover suggests a possible competitive interaction between the two. As advanced by Boudreau and Villeneuve-Simard (2012), the presence of P.
mariana may reduce the availability of resources for other species like B. glandulosa. Such a hypothesis is
also supported by the results of Rundqvist et al. (2011), who monitored tree and shrub cover at an altitudinal tree line and a forest line. When comparing two different vegetation surveys 34 years apart, they found that the smaller increase in Betula nana L. cover occurred at sites where the tree cover was greater. In our study sites, competition for soil resources (nutrients and water) seems more likely than competition for light since the tree cover rarely exceeds 25 %, resulting in open forest stands with an important proportion of photosynthetically active radiation reaching the forest floor. It is also possible that a low tree cover could facilitate the presence of
B. glandulosa by a compromise between competition and protection. A low tree cover, which would generate
lower competitive interactions with shrubs, may offer some protection to the shrub layer during winter.
Alternatively, because vegetation surveys revealed that the sites are not saturated with woody species, i.e. that shrub and tree cover is below 100%, other factors can influence B. glandulosa cover in lichen woodlands. For example, lichens, which cover ranges between 5% and 30% in our study sites, are known to limit the establishment and growth of other species (Houle and Filion 2003). Therefore, they could limit B. glandulosa seed germination and growth. Also, the cover of E. hermaphroditum increases with increasing forest cover in our sites, a phenomenon that might be associated to the age of the forest stands as E. hermaphroditum is often associated with older forests (Nilsson and Wardle 2005). Most importantly, this species can produce and release allelopathic compounds that may impede the germination and growth of other species. For example, Dufour-Tremblay et al. (2012b) showed that this species could significantly reduce the germination of P.
mariana, and Nilsson (1994) revealed a reduction of growth in seedlings of Pinus sylvestris L. growing with E. hermaphroditum. Therefore, a possible allelopathic effect, resulting in a lower B. glandulosa establishment and
Height of B. glandulosa was not a function of the tree cover. Moreover, height of B. glandulosa was associated with the presence of B. glandulosa itself, as suggested by the marginally significant relationship between B.
glandulosa height and cover. It has been reported by Sturm et al. (2001a) that higher and denser Betula spp.
are associated to greater snow accumulation, which can lead to more protection from winter desiccation and wind abrasion. Greater snow accumulation can also trigger a positive feedback loop in increasing soil humidity during the growth season, resulting in higher decomposition rate and nutrient availability. On the other hand, greater snow accumulation could also result in a significant shortening of the growth season, which could limit elongation of new shoots and total height of individuals.
Betula glandulosa radial growth
In this study, growth chronologies were built from samples taken in nine forest ecosystems. Chronologies display a similar growth pattern and ring width. For all sites, the relation between radial growth and temperature was stronger for the last two decades than over the whole chronologies. This might be related to the important warming of ca. 2°C observed in the region over that time frame. This supports findings of Boudreau and Villeneuve-Simard (2012), who showed a stronger relationship between growth of B. glandulosa and temperature in a forest after tree removal, which also coincides with the onset of climate warming in the region. This is similar with work on shrub expansion and experimental warming, which can partially attribute the growth increase of shrubs to temperature (Walker et al. 2006). However, the greater relationship with recent temperatures may also be related to a better accuracy of the common signal in our chronologies for this period, during which more individuals were available to build the chronologies.
Based on the results of Boudreau and Villeneuve-Simard (2012), we predicted that the strength of the climatic signal, i.e. the relation between radial growth and degree-days, would decrease with an increasing tree cover. Our results do not support our prediction since the strength of the climatic signal was not a function of tree cover. Such results might suggest that, even at low density, trees can exert significant competition for the shrub species. Alternatively, it can suggest that other factors or interactions might be as important as climate in the control of B. glandulosa radial growth. For example, microtopographic differences in temperature, wind and snow cover between sites may hide the effect of tree cover on B. glandulosa growth. Bär et al. (2006) reported such suppressed climatic signal due to microsite differences. However, we noted that crossdating was easier for open sites, revealing that the common signal between individuals growing on terraces was more noticeable and perhaps stronger than in forests. These results suggest that forest environments (via competition with trees) decrease, at least partially, the influence of climate on B. glandulosa radial growth.
Response functions revealed that the main climate drivers of B. glandulosa radial growth are monthly mean and minimal temperatures, especially in March and May. Mean temperatures in the month of October of the