HAL Id: pastel-00985468
https://pastel.archives-ouvertes.fr/pastel-00985468
Submitted on 29 Apr 2014
HAL is a multi-disciplinary open access
archive for the deposit and dissemination of
sci-entific research documents, whether they are
pub-lished or not. The documents may come from
teaching and research institutions in France or
abroad, or from public or private research centers.
L’archive ouverte pluridisciplinaire HAL, est
destinée au dépôt et à la diffusion de documents
scientifiques de niveau recherche, publiés ou non,
émanant des établissements d’enseignement et de
recherche français ou étrangers, des laboratoires
publics ou privés.
Degradation modeling of concrete submitted to biogenic
acid attack
Haifeng Yuan
To cite this version:
Haifeng Yuan. Degradation modeling of concrete submitted to biogenic acid attack. Other. Université
Paris-Est, 2013. English. �NNT : 2013PEST1148�. �pastel-00985468�
Présentée pour obtenir le grade de
DOCTEUR DE
L’UNIVERSITÉ PARIS–EST
Domaine : Génie Civil
Présentée par :
Haifeng Yuan
Sujet de la thèse :
Degradation modeling of concrete submitted to biogenic acid
attack
Modélisation de la dégradation du béton due aux attaques acides biogéniques.
Mémoire provisoire Jury :
Dr. Laurent de WINDT Maître de recherche HDR Mines-ParisTech Rapporteur
Prof. Gilles ESCADEILLAS Professeur INSA de Toulouse Rapporteur
Prof. Denis DAMIDOT Professeur Ecole des Mines de Douai Examinateur
Dr. Patrick DANGLA IFSTTAR, U. Paris-Est Directeur de thèse
Dr. Patrice CHATELLIER IFSTTAR Conseiller d’études
Dr. Thierry CHAUSSADENT IFSTTAR Conseiller d’études
Résumé
La biodétérioration du béton, très courante dans les systèmes d’égouts et de traitement des eaux usées, entraîne une dégradation significative de la structure. Normalement, le processus peut être décrit par les deux étapes suivantes : 1) Des réactions biochimiques produisent des espèces agressives dans les biofilms qui tapissent la surface du béton. L’un des plus importants acides biogéniques que l’on trouve dans les canalisations d’égout est l’acide sulfurique (H2SO4) que est produit par des bactéries sulfo-oxydante (BSO) à partir de l’hydrogène sulfuré (H2S). 2) Les réactions chimiques entre les espèces agressives biogéniques et les produits d’hydratation du ciment sont responsables de la détérioration du béton.
Un modèle de transport réactif est proposé afin de simuler les processus des détériorations chimique et biochimique des matériaux cimentaires en contact avec les BSO et le H2S ou une solution d’acide sulfurique. L’objectif de ce modèle est de résoudre simultanément le transport et la biochimie / chimie dans les biofilms et les matériaux cimentaires par une approche globale couplée.
Afin de fournir un environnement approprié pour la croissance des BSO, la neutralisation de la surface du béton (i.e., l’absorption de H2S et la corrosion aqueuse de H2SO4) est considérée. Pour obtenir la quantité de H2SO4 biogénique, la bio-oxydation du H2S par l’activation des bactéries est simulée par un modèle simplifié. Puis, pour alimenter un environnement convenable pour la croissance des BSO, la réduction abiotique du pH du béton est introduite. Le taux de production de H2SO4 est régi par la valeur du pH dans les biofilms et la quantité de H2S dans le gaz.
On fait l’hypothèse que tous les processus chimiques sont en équilibre thermodynamique. La dissolution de la portlandite (CH) et du silicate de calcium hydratés (C-S-H), ainsi que la précipitation de gypse (C¯SH2) et du sulfure de calcium sont décrites par la loi d’action de masse et le seuil des produits d’activité ionique. Pour prendre en compte la décroissante continue du rapport Ca/Si lors de la dissolution de la C-S-H, une généralisation de la loi d’action de masse est appliquée.
En simplifiant le processus de précipitation du gypse, un modèle d’endommagement est introduit pour caractériser la détérioration du béton due au gonflement du gypse. Ainsi, l’évolution de la porosité et de la profondeur de la détérioration pendant le processus de dégradation sont pris en compte.
II September 16, 2013
Seule la diffusion des espèces aqueuses est considérée. Différents coefficients de diffusion sont utilisés pour divers ions et l’équation de Nernst-Planck est implémentée. L’effet, pendant la détérioration, de la modification de la microstructure sur les propriétés de transport est aussi considéré. Pour les biofilms et les matériaux cimentaires, les équations d’équilibre de masse totale de chaque atome (Ca, Si, S, K, Cl) sont utilisées pour coupler les équations de transport et les réactions (bio) chimiques.
Le modèle est implémenté dans un code volumes finis, Bil. Grâce à l’introduction de la méthode des volumes finis, on illustre le couplage du processus bio-chimie dans les biofilms et le processus de la chimie des matériaux cimentaires.
Par ce modèle, certaines expériences rapportées dans la littérature, dont des tests d’immersion chim-iques (condition de la solution statique et condition de la solution d’écoulement) et des simulations micro-biologiques, sont simulées. Les résultats numériques et les observations expérimentales sont comparés et discutés. L’influence des propriétés des matériaux cimentaires (porosité initiale, couche carbonatée, etc.) et les facteurs d’environnement (concentration de H2SO4 quantité de H2S etc) sont aussi étudiés par ce modèle. En outre, une prédiction à long terme est menée.
Mots-clés:
Bio-détérioration, Canalisations d’égout, Béton, Acide sulfurique, Biofilm, Modélisation du transport réac-tif, Portlandite, C-S-H, Gypse
Abstract
Bio-deterioration of concrete, which is very common in sewer system and waste water treatment plant, results in significant structure degradation. Normally, the process can be described by the two following parts: 1) Biochemistry reactions producing biogenic aggressive species in biofilms which are spread on the surface of concrete. As one of the most significant biogenic acid in sewer pipes, sulfuric acid (H2SO4) is produced by sulfur oxidizing bacteria (SOB). 2) Chemical reactions between biogenic aggressive species and cement hydration products which is responsible for concrete deterioration.
A reactive transport model is proposed to simulate the bio-chemical and chemical deterioration processes of cementitious materials in contact with SOB and H2S or sulfuric acid solution. This model aims at solving simultaneously transport and biochemistry/chemistry in biofilms and cementitious materials by a global coupled approach.
To provide an appropriate environment for SOB to grow, the surface neutralization of concrete (i.e., the absorption of H2S and aqueous H2S corrosion) is considered. To obtain the amount of biogenic H2SO4, the bio-oxidation of H2S by the activation of bacteria is simulated via a simplified model. To provide a suitable environment for SOB to grow, the abiotic pH reduction of concrete process is introduced. The production rate of H2SO4 is governed by the pH in the biofilms and the content of H2S in gas.
It is assumed that all chemical processes are in thermodynamical equilibrium. The dissolution of portlandite (CH) and calcium silicate hydrates (C-S-H) and the precipitation of gypsum (C¯SH2) and calcium sulfide are described by mass action law and threshold of ion activity products. To take into account the continuous decrease of the Ca/Si ratio during the dissolution of C-S-H a generalization of the mass action law is applied.
By simplifying the precipitation process of gypsum, a damage model is introduced to characterize the deterioration of concrete due to the swelling of gypsum. Thus, the porosity evolution and deterioration depth during deterioration process are taken into account.
Only diffusion of aqueous species are considered. Different diffusion coefficients are employed for var-ious ions and Nernst-Planck equation was implemented. The effect of the microstructure change during
IV September 16, 2013
deterioration on transport properties is considered as well. For both biofilms and cementitious materials, the balance equations of total mass of each atom (Ca, Si, S, K, Cl) are used to couple transport equations and (bio-)chemical reactions.
The model is implemented within a finite-volume code, Bil. Following the introduction of principle of the finite volume method, the coupling of the bio-chemistry process in biofilms and chemistry process in cementitious materials is illustrated.
By this model, some experiments reported in literature, including chemical immersion tests (statical solution condition and flow solution condition) and microbiological simulation tests, are simulated. The nu-merical results and the experimental observations are compared and discussed. The influence of properties of cementitious materials (initial porosity, carbonated layer, etc.) and environmental factors (concentration of H2SO4, content of H2S, etc.) are investigated by this model as well. Furthermore, a long term prediction is conducted.
Keywords:
Bio-deterioration, Sewer pipe, Concrete, Sulfuric acid, Biofilm, Reactive transport modelling, Portlandite, C-S-H, Gypsum
Contents
1 Introduction 1
1.1 Background . . . 1
1.2 Mechanisms of biodeterioration of sewer pipes . . . 3
1.3 Recent research works about biodeterioration of cementitious materials . . . 6
1.4 Research objectives . . . 10
1.5 Outline of thesis . . . 10
2 The production of H2SO4 by micro-organisms in biofilm 13 2.1 Introduction . . . 13
2.2 Neutralization of pipe surface during early stage . . . 14
2.3 The production of H2SO4 by sulfur-oxidizing bacteria . . . 18
2.4 Conclusions . . . 25
3 Degradation of cementitious materials subjected to sulfuric acid attack 27 3.1 Introduction . . . 27
3.2 Chemical reactions in pore solution . . . 28
3.3 Dissolution of portlandite . . . 30
3.4 Decalcification of calcium silicate hydrates (C-S-H) . . . 32
3.5 Examples of the evolution of pH and solid compositions . . . . 36
3.6 Conclusion . . . 39
4 Porosity evolution and damage of cementitious materials 41 4.1 Introduction . . . 41
4.2 Porosity change during H2S attack . . . 42
4.3 Expansion of gypsum precipitation . . . 43
4.5 Examples of the evolution of porosity and solid volume . . . 49
4.6 Conclusion . . . 52
5 Reactive transport modeling and numerical procedures 53 5.1 Introduction . . . 53
5.2 Field equations . . . 54
5.3 Transport of aqueous species . . . 55
5.4 Introduction of numerical procedures . . . 57
5.5 Examples of bio-deterioration modeling . . . 60
5.6 Conclusion . . . 70
6 Simulation in the case of constant H2SO4 solution 73 6.1 Introduction . . . 73
6.2 High H2SO4concentration condition (pH = 1) . . . . 74
6.3 Low H2SO4concentration condition (pH = 2) . . . . 84
6.4 Analysis of the discrepancy between simulation results and experimental results . . . 89
6.5 Long-term prediction . . . 94
6.6 Conclusion . . . 95
7 Simulation in the case of biofilms condition 97 7.1 Introduction . . . 97
7.2 Immersion test condition . . . 99
7.3 Simulation reactor condition . . . 109
7.4 Effect of H2S gas level . . . 114
7.5 Conclusion . . . 115
8 Conclusions and further discussion 117 8.1 Summary of the thesis . . . 117
8.2 Further discussion and perspective . . . 120
A Introduction of discrete and solid solution models of C-S-H dissolution 135
List of Figures
1.1 Examples of biodeterioration . . . 1
1.2 Examples of MICC of sewer pipe . . . 3
1.3 Schematic of biogenic sulphuric acid attack in a sewerage (Herisson et al.,2013)). . . 3
1.4 Theoretical changes in the biological and physical properties of concrete with time during the deterioration process, (Islander et al.,1991). . . 4
1.5 (a) Concrete coupons exposed to the sewer atmosphere (Okabe et al., 2007); (b) Scanning electron microphotograph of gypsum crystals in the cement paste (Monteny et al.,2000). . 6
2.1 Schematic outline of the H2S production process. (Jensen et al., 2008) . . . 14
2.2 Schematics of the pilot scale reactors. (Vollertsen et al.,2008) . . . 15
2.3 H2S absorption rate at different H2S gas content. . . 16
2.4 Decrease in surface pH (pH(initial)- pH(exposed)) after 1 year. . . 18
2.5 Succession of SOB in different pH range (Herisson,2012) . . . 19
2.6 Sulfur oxidation states typical in sewer. (Biologic pathway is shown with full lines; chemical, with dashed lines.) (Islander et al.,1991) . . . 19
2.7 H2SO4 production rate and pH . . . . 21
2.8 The pathway used to describe the hydrogen sulfide and oxygen consumption pattern observed in the experiments on biotic hydrogen sulfide oxidation (Jensen,2008). . . 22
2.9 Oxidation rate : (a) H2S ; (b) element S. . . 24
2.10 The pH evolution in pure SOB media with different H2S level. . . 24
3.1 Stability domains of portlandite and gypsum . . . 31
3.2 A typical pattern of the relationship between QSHt KSHt and QCH KCH . . . 35
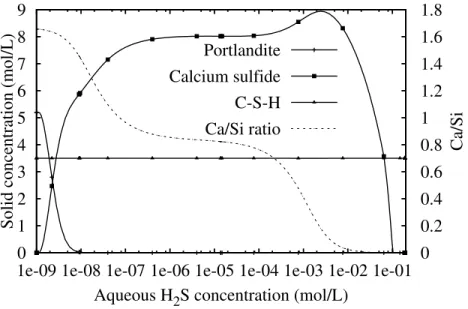
3.3 Composition of a calcium-silicon solution in equilibrium with its solid phase vs. Ca/Si ratio. 35 3.4 Concentration of H2S species and pH vs. time in REV of cement paste . . . . 36
3.6 Concentration of H2SO4 species and pH vs. time in REV of cement paste . . . . 38
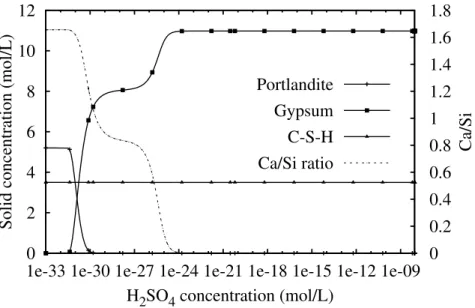
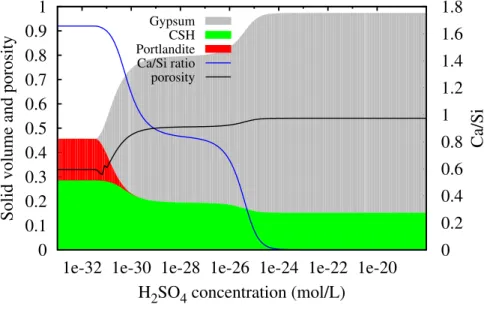
3.7 Evolution of the solid composition vs. H2SO4 concentration in REV of cement paste . . . . 38
4.1 VC-S-H and H2O/Si ratio z vs. Ca/Si ratio x. . . . 43
4.2 (a) OPC Mortar after 350 Days of biogenic sulfuric acid corrosion in simulation chamber. Samples on left side is reference sample,whereas on right side sample exposed to corrosion condition. (Ehrich et al., 1999); (b) The appearance of concrete coupons exposed to the sewer atmosphere for 1 year. (Okabe et al.,2007) . . . 44
4.3 Schematics of the microstructure of cementitous materials with uncompressed gypsum inclu-sion: (a) Through-solution mechanism (Beddoe and Dorner,2005); (b) Deposition in pores mechanism (Kawai et al.,2005) . . . 44
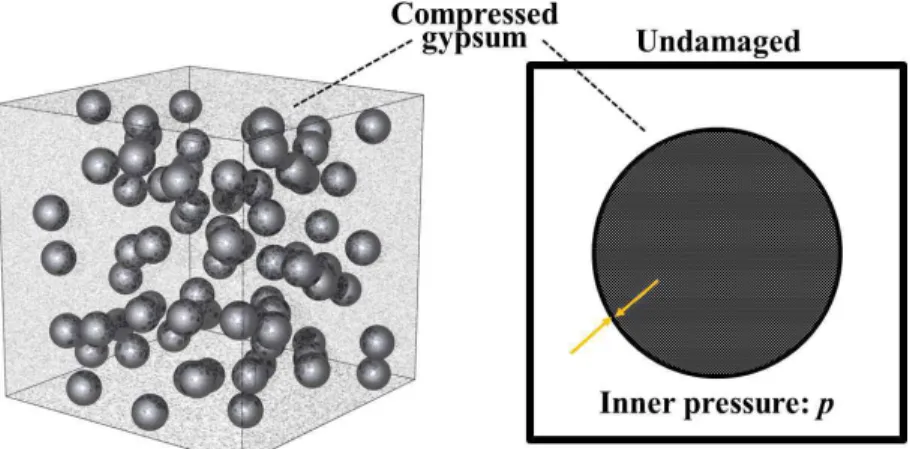
4.4 Schematics of the microstructure of cementitous materials with uncompressed gypsum inclusion 46 4.5 Schematics of the microstructure of cementitous materials with compressed gypsum inclusion 46 4.6 Schematics of the relationship between the saturation degree of gypsum and inner pressure. 47 4.7 Elastic-Brittle behaviour of cementitious materials . . . 48
4.8 Schematics of the microstructure of damaged cementitous materials . . . 49
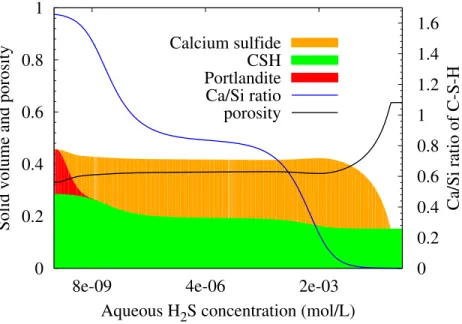
4.9 Evolution of the solid volume and porosity vs. H2S concentration in REV of cement paste . 50 4.10 Evolution of the solid volume and porosity vs. H2SO4 concentration in REV of cement paste 51 4.11 Evolution of inner pressure vs. content of CH and C¯SH2 in REV of cement paste . . . 51
4.12 Concrete coupons exposed to the sewer atmosphere [H2S, 30 ppm] for 42 days (A), 102 days (B), and 1 year (C and D), showing the progression of concrete corrosion. (Okabe et al.,2007) 51 5.1 H2SO4 concentration profiles from 0 day to 60 days. . . 61
5.2 pH value profiles from 0 day to 60 days. . . . 62
5.3 Solid profiles after 15 days immersion . . . 63
5.4 Evolution of porosity and solid compositions of material versus immersion time. . . 63
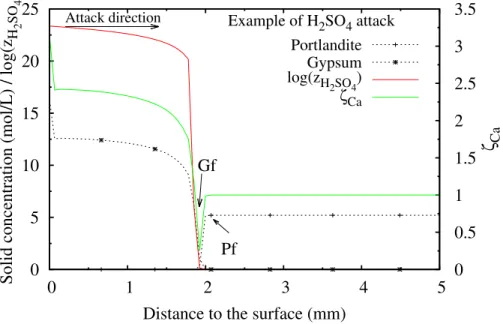
5.5 CH and C¯SH2 content, ζCa and log(zH2SO4) after 15 days immersion . . . 64
5.6 Concentration of SO2−4 and Ca2+ and ζ Ca after 15 days immersion . . . 65
5.7 Flow of calcium and sulfur and ζCa after 15 days immersion . . . 65
5.8 Ca/Si ratio of C-S-H and log(qCH) after 15 days immersion . . . 66
5.9 VC-S-H of C-S-H and log(qCH) after 15 days immersion . . . 67
5.10 In SOB solution without cement paste: (a) pH and the concentration of total sulfate ions ; (b) Concentration of H2SO40, HSO−4 and SO2−4 . . . 67
LIST OF FIGURES V
5.12 Flow of aqueous species across the interface at 1 day . . . 69
5.13 pH value profiles from 0 day to 60 days. . . . 69
5.14 Solid profiles after 15 day . . . 70
6.1 After 90 days immersion test: (a) Observation of deterioration of sample; (b) XRD patterns of surface area of sample. (Method 1, pH = 1) (Kawai et al.,2005) . . . 75
6.2 The calculated penetration of H2SO4 and pH evolution profiles from 0 days to 90 days: (a) H2SO4 concentration; (b) pH value. (Method 1, pH = 1) . . . . 76
6.3 After 10 days of immersion: (a) Solid concentration and porosity ; (b) Solid volume and Ca/Si ratio of C-S-H . DSimulation and DExperiment represent the degradation depth of the sample in simulation and experiment individually. (Method 1, pH = 1) . . . . 77
6.4 After 30 days of immersion: (a) Solid concentration and porosity ; (b) Solid volume and Ca/Si ratio of C-S-H . DSimulation and DExperiment represent the degradation depth of the sample in simulation and experiment individually. (Method 1, pH = 1) . . . . 77
6.5 After 90 days of immersion: (a) Solid concentration and porosity ; (b) Solid volume and Ca/Si ratio of C-S-H . DSimulation and DExperiment represent the degradation depth of the sample in simulation and experiment individually. (Method 1, pH = 1) . . . . 78
6.6 At 5 mm depth of sample (a) Solid concentration, Ca/Si ratio of C-S-H and porosity ; (b) Solid volume and inner pressure . (Method 1, pH = 1) . . . . 78
6.7 The predicted evolution of porosity and corrosion depth profiles from 0 days to 90 days: (a) Porosity; (b) Corrosion depth. (Method 1, pH = 1) . . . . 79
6.8 After 90 days immersion test: (a) Observation of deterioration of sample; (b) XRD patterns of surface area of sample. (Method 2, pH = 1) (Kawai et al.,2005) . . . 79
6.9 The calculated penetration of H2SO4 and pH evolution profiles from 0 days to 90 days: (a) H2SO4 concentration; (b) pH value. (Method 2, pH = 1) . . . . 80 6.10 After 10 days of immersion: (a) Solid concentration and porosity ; (b) Solid volume and
Ca/Si ratio of C-S-H . DSimulation and DExperiment represent the degradation depth of the sample in simulation and experiment individually. (Method 2, pH = 1) . . . . 81
6.11 After 30 days of immersion: (a) Solid concentration and porosity ; (b) Solid volume and Ca/Si ratio of C-S-H . DSimulation and DExperiment represent the degradation depth of the sample in simulation and experiment individually. (Method 2, pH = 1) . . . . 81
6.12 After 90 days of immersion: (a) Solid concentration and porosity ; (b) Solid volume and Ca/Si ratio of C-S-H . DSimulation and DExperiment represent the degradation depth of the sample in simulation and experiment individually. (Method 2, pH = 1) . . . . 82
6.13 The calculated Ca2+concentration profiles during immersion: (a) Method 1 ; (b) Method 2 . (pH = 1) . . . . 82
6.14 The calculated diffusion of calcium during immersion: (a) Method 1 ; (b) Method 2 . (pH = 1) . . . 83
6.15 The predicted evolution of porosity and corrosion depth profiles from 0 days to 90 days: (a) Porosity; (b) Corrosion depth. (Method 2, pH = 1) . . . . 83
6.16 The concentration of HSO−
4 and SO2−4 in the sample after 70 days immersion. (Method 2,
pH = 1) . . . . 84
6.17 The calculated penetration of H2SO4with different pH: (a) Method 1; (b) Method 2. . . . . 85
6.18 The evolution of pH with different pH: (a) Method 1; (b) Method 2. . . . 85
6.19 The evolution of solid volume, Ca/Si ration of C-S-H and porosity after 10 days immersion : (a) Method 1; (b) Method 2. (pH = 2) . . . . 86
6.20 The evolution of solid volume, Ca/Si ration of C-S-H and porosity after 30 days immersion
: (a) Method 1; (b) Method 2. (pH = 2) . . . . 86
6.21 The evolution of solid volume, Ca/Si ration of C-S-H and porosity after 90 days immersion : (a) Method 1; (b) Method 2. (pH = 2) . . . . 87
6.22 The concentration of HSO−
4 and SO2−4 after 90 days immersion with different pH: (a) Method 1; (b) Method 2. . . 87
6.23 The flux of sulfur after 90 days immersion with different pH: (a) Method 1; (b) Method 2. . 88
6.24 After 90 days immersion : (a) The concentration of Ca2+1; (b) Flux of calcium (Method 1) 88
6.25 The evolution of pH from 10 days to 90 days for the sample with carbonated layer: (a) Method 1; (b) Method 2. (pH = 1) . . . . 91
6.26 The evolution of solid volume, Ca/Si ration of C-S-H and porosity of samples with carbonated layer after 10 days immersion : (a) Method 1; (b) Method 2. (pH = 1) . . . . 91
6.27 The corrosion depth profiles of simulation and experiments from 10 days to 90 days: (a) Method 1; (b) Method 2 . . . 92
6.28 Solid compositions, Ca/Si ratio of C-S-H and porosity profiles after 30 days of immersion under high H2SO4 concentration condition (pH = 0.5): (a) W/C = 0.35; (b) W/C = 0.5 . . 93
6.29 Solid compositions, Ca/Si ratio of C-S-H and porosity profiles after 30 days of immersion high H2SO4 concentration condition (pH = 2): (a) initial porosity = 0.3; (b) initial porosity = 0.4 . . . 93
LIST OF FIGURES VII
7.1 Experiment setup of immersion test of biodeterioration: (a) (Vincke et al.,2000); (b) (De Be-lie et al.,2004). . . 98
7.2 Experiment setup of biodeterioration by simulation reactors: (a) (Mori et al., 1992); (b) (Herisson,2012). . . 98
7.3 A sample of the concrete before (A) and after (B) eight cycles of the microbiological test. A loss of cement paste is clearly visible, while the aggregates remain relatively unaffected. (De Muynck et al.,2009). . . 100
7.4 The calculated absorption of H2S and pH evolution profiles from 0 days to 2 days: (a) Aqueous H2S concentration; (b) pH value. (H2S level = 200 ppm) . . . 101
7.5 The calculated absorption of H2S profiles from 0 days to 2 days: (a) Aqueous H2S concen-tration and pH evolution at surface; (b) Diffusion of sulfur. (H2S level = 200 ppm) . . . 101
7.6 After 1 day of exposure: (a) Solid concentration and porosity ; (b) Solid volume and Ca/Si ratio of C-S-H. (H2S level = 200 ppm) . . . 102
7.7 After 2 days of exposure: (a) Solid concentration and porosity ; (b) Solid volume and Ca/Si ratio of C-S-H. (H2S level = 200 ppm) . . . 103
7.8 The concentration of CaS and aqueous H2S at surface from 0 days to 2 days (H2S level =200 ppm) . . . 103
7.9 After 10 days of exposure: (a) Solid concentration and porosity ; (b) Solid volume and Ca/Si ratio of C-S-H. (H2S level = 200 ppm) . . . 104
7.10 The evolution of pH in pure SOB suspension from 0 days to 10 days . . . . 105
7.11 Initial concrete sample with neutralized surface: (a) pH and porosity ; (b) Solid volume and Ca/Si ratio of C-S-H. . . 106
7.12 The calculated H2SO4 and pH evolution profiles in SOB suspension and concrete from 0 days to 10 days: (a) H2SO4concentration; (b) pH value. . . . 106
7.13 The pH evolution and production rate of H2SO4from 0 to 10 days: (a) bulk SOB suspension; (b) SOB closed to concrete surface. . . 107
7.14 After 10 days of immersion in SOB suspension: (a) Solid concentration and porosity ; (b) Solid volume and Ca/Si ratio of C-S-H. DSimulation represents the degradation depth of the sample in simulation . . . 108
7.15 The predicted and measured corrosion depth. . . 108
7.16 Mortar specimens exposed to H2S gas: (a) Water; (b) Sewage. (Mori et al.,1992). . . 109
7.17 When surface pH decreases to 9.5: (a) Aqueous H2S concentration and pH evolution at surface; (b) Solid concentration and porosity of mortar sample. (H2S level = 400 ppm) . . . 110
7.18 The oxidation of H2S and S versus their concentration in the biofilms: (a) Aqueous H2S ;
(b) Element S. (H2S level = 400 ppm) . . . 112
7.19 The calculated pH evolution profiles (a) pH evolution in biofilms ; (b) pH change in biofilms and mortar. (H2S level = 400 ppm) . . . 112
7.20 After 40 days of test in simulation reactor: (a) Solid concentration and porosity ; (b) Solid volume and Ca/Si ratio of C-S-H. (H2S level = 400 ppm) . . . 113
7.21 After 80 days of test in simulation reactor: (a) Solid concentration and porosity ; (b) Solid volume and Ca/Si ratio of C-S-H. (H2S level = 400 ppm) . . . 113
7.22 After 180 days of test in simulation reactor: (a) Solid concentration and porosity ; (b) Solid volume and Ca/Si ratio of C-S-H. (H2S level = 400 ppm) . . . 114
7.23 After 1 year of test in simulation reactor: (a) Solid concentration and porosity ; (b) Solid volume and Ca/Si ratio of C-S-H. (H2S level = 400 ppm) . . . 114
7.24 The lag time of surface neutralization process with different H2S level. . . 115
A.1 Stability domains of jennite and amorphous silica gel. . . 136
A.2 Stability domains of jennite, tobermorite and amorphous silica gel. . . 137
List of Tables
1.1 Some problems associated with the presence of biofilms on materials (Allsopp et al.,2004) . 2
1.2 Biodeterioration rate of concrete in sewage systems . . . 2
1.3 Characteristics of T hiobacillus in biofilm (Islander et al.,1991) . . . 6
2.1 Definition of the parameters in WATS model . . . 23
2.2 Value of the parameters in H2SO4 production model. (Jensen et al.,2008) . . . 23
3.1 Chemical reactions taking place in the aqueous solution . . . 29
5.1 Concentration of each element . . . 54
5.2 Diffusion coefficients of different aqueous species at T=298 K . . . 56
5.3 The key parameters of CH-C¯SH2 equilibrium at different stable states . . . 58
5.4 Governing equations and primary variables in the model . . . 60
5.5 Boundary and initial conditions of the H2SO4attack example . . . 61
5.6 Boundary and initial conditions of the biogenic H2SO4 attack example . . . 66
6.1 Boundary and initial conditions of the H2SO4attack with Method 1 . . . 75
6.2 Boundary and initial conditions of the H2SO4attack with Method 2 . . . 80
6.3 Boundary and initial conditions of the H2SO4attack with (pH = 2) . . . . 84
6.4 Boundary and initial conditions of the H2SO4attack of the sample with carbonated layer . 90 7.1 Boundary and initial conditions of the H2S attack (200 ppm) . . . 100
7.2 Boundary and initial conditions of biodeterioration by SOB suspension . . . 105
7.3 Boundary and initial conditions of biodeterioration by biofilms . . . 111
A.1 Different C-S-H type proposed by (Lothenbach et al.,2008). . . 135
Chapter 1
Introduction
1.1
Background
During the service life of materials, biodeterioration is an important cause of the reduction of the performance and durability of materials as well as physical and chemical deterioration. Hueck (Hueck,
1968) first proposed that biodeterioration is "any undesirable change in the properties of a material caused by the vital activities of organisms".
In biodeterioration, the organisms vary widely, such as marine borers (including mollusks and crus-taceans), insects, fungi, prokaryotes (including bacteria and archea) and plants (Sanchez-Silva and Rosowsky,
2008). They form specific communities that interact with materials and external environment in many dif-ferent ways. As organisms exist everywhere, they can accelerate deterioration of a wide range of materials (as shown in Fig. 1.1), including inorganic minerals (Mitchell and Gu, 2000), concrete (Gu et al., 1998;
Cwalina, 2008), stones (Warscheid and Braams, 2000; Perry IV et al., 2005), metals (Cragnolino and Tuovinen,1984), and natural and synthetic polymers (Guezennec et al.,2006;Flemming,1998).
Figure 1.1: Examples of biodeterioration
Specifically, microorganisms play major role in deterioration. According to US estimation, the contri-bution of microbiologically induced corrosion (MIC) to the deterioration of materials as a whole is about 30% (Sand, 2008). In many cases, MIC is due to the presence of a surface layer of microorganisms and
their products. Such microbial layers are known as biofilms and are defined as surface accumulations of the organic products of biological activity. Generally, biofilms are in direct contact with the material rather than dispersed in the surrounding environment. Thus, the aggressive products of microorganisms are concentrated and result in severe damage of materials. Some examples are shown in Table1.1.
Table 1.1: Some problems associated with the presence of biofilms on materials (Allsopp et al.,2004)
.
Biofilm location Effects
Teeth Tooth decay, caries
Sewer pipe Decreased durability, reduced flow
Cooling towers Degradation of material, reduced heat transfer
Drinking water distribution systems Decreased water quality, health risks
Oil industry pipelines Blockage and corrosion
As one of the most widely used materials, concrete suffers from biodeterioration. The first mention of microbiologically induced concrete corrosion (MICC) in literatures was by Olmstead and Hamlin (Olmstead and Hamlin, 1900). Most of MICC were detected in constructions like sewer pipes (Diercks et al., 1991;
Mori et al.,1992;Cho and Mori,1995), waste water treatment facilities (Redner et al.,1991), cooling towers (Zherebyateva et al.,1991), gas and oil platforms (Edyvean,1987), marine structures (Hughes et al.,2013), and many others where various microorganisms (like bacteria, microscopic fungi, algae and lichen) are usually present at high concentrations (Viitanen et al.,2010).
The most rapid cases of deterioration always occur in the places with high H2S concentration, moisture, and oxygen in the atmosphere. Such conditions are commonly found in sewage collection systems (as shown in Table1.2).
Table 1.2: Biodeterioration rate of concrete in sewage systems
.
Location of samples Biodeterioration rate (mm/year) Reference
Sewer pipe in treatment plant 4.3-4.7 (Mori et al.,1992)
Manhole in treatment plant 5.7-7.6 (Hudon et al.,2011)
Urban sewer pipe in Houston 3.1 (Davis et al.,1998)
Urban sewer pipe in Hamburg 8-10 (Milde et al.,1983)
Besides sewer pipes, approximately 40% of a wastewater system is made up of concrete structures. About 40% of the damage in concrete pipeline is caused by biodeterioration (Kaempfer and Berndt,1999). As shown in Fig.1.2, MICC in sewerage system can lead to fragmentation of pipe surface, debonding of concrete, collapse of the physical and mechanical properties of structures. Thus, huge money is being spent on the repair and maintenance of sewerage collection system. For Germany, a cost of approximately 100 billion Euros is estimated for maintenance and repair of private and public sewage systems (Kaempfer and Berndt, 1998). ASCE’s report also estimates that the United States will need 390 billion dollars during
1.2 Mechanisms of biodeterioration of sewer pipes 3
the next 20 years to repair and replace the existing wastewater infrastructure and construct new facilities, including collection systems (Gutiérrez-Padilla et al.,2010).
Figure 1.2: Examples of MICC of sewer pipe
Thus, there is great interest in predicting the corrosion rate and the service life of sewer pipes. To simulate the biodeterioration process, it is necessary to understand the mechanisms of biodeterioration of sewer pipe including the bio-activity in biofilm as well as the chemical reactions between concrete and biogenic sulfuric acid.
1.2
Mechanisms of biodeterioration of sewer pipes
Because of the alkalinity of concrete and the acidity of environment in sewer pipes, the main cause of biodeterioration of these structures is biogenic sulphuric acid attack (BSA). According to experimental observations, the process of BSA of cementitious materials in sewer pipes can be divided into two parts which are schematically indicated in Fig.1.3.
Figure 1.3: Schematic of biogenic sulphuric acid attack in a sewerage (Herisson et al.,2013)).
A) Hydrogen sulfide (H2S) formation in wastewater.
Sulfate is commonly present in wastewater. At the bottom of pipe where water is anoxic, sulfate can be converted into hydrogen sulfide (H2S). This conversion is performed by sulfate-reducing bacteria (SRB),
which are heterotrophic bacteria found in almost any environmental sample (Barton and Tomei, 1995). SRB can use oxidized sulfur compounds as electron acceptor by following reactions (Wood et al.,2005).
SO2−4 + 4H2O + 8e− SRB−−−→ S2−+ 8OH− (1.1a)
SO2−4 + organic substance−−−→ SSRB 2−+ H
2O + CO2 (1.1b)
HS− ⇋H++ S2− (1.1c)
H2S(aq)⇋H++ HS− (1.1d)
In normal sewage, pH is between 5 and 6. Since H2S is poorly soluble (pK= 7.05), it is degassed in the arcal part of the pipe following Henry’s Law.
B) Biodeterioration of concrete in the arcal part of pipes. The deterioration process can be described by the following three steps as shown in Fig.1.4.
Figure 1.4: Theoretical changes in the biological and physical properties of concrete with time during the deterioration process, (Islander et al.,1991).
Step 1: Abiotic pH reduction of concrete.
The pH of fresh concrete (11-13) is too high for the sulfur-oxidizing bacteria (SOB) to survive. CO2 and H2S are both present in the arcal part of sewer pipes. Experiment observations (Ismail et al.,1993;
Joseph et al.,2012) revealed that such acidic gases can reduce the pH of concrete surface to less than 9 as described in reaction (1.2a) and (1.2b).
CH + CO2⇋CaCO3+ H2O (1.2a)
1.2 Mechanisms of biodeterioration of sewer pipes 5
Step 2: Microbial colonization and production of H2SO4 by biofilm.
Once the pH of the surface of concrete is reduced to 9, with sufficient nutrients (element sulfur), moisture and oxygen, some species of SOB like T hiobacillus sp. can grow on the concrete surface and form biofilms (Rigdon and Beardsley,1956;Mori et al.,1992). Although the bio-activity in biofilms is not fully understood, it is generally believed that firstly H2S in biofilms is oxidized to element sulfur by metal catalyst (Zivica and Bajza,2002) or neutrophilic sulfur-oxidizing microorganisms (NSOM) (Bielefeldt et al.,
2009) as follows: H2S + 1 2O2 NSOM −−−−−−−−→ metalcatalyst S 0+ H 2O (1.3)
Not only element sulfur, but also a few sulfuric acid is produced by NSOM. After pH has decreased to 4-5, acidophilic sulfur-oxidizing microorganisms (ASOM) like T.thiooxidans can use element sulfur to produce large amounts of sulfuric acid as reaction (1.4), which makes the main contribution to the biodeterioration of sewer pipe (Parker,1945,1951). With sufficient sulfur source, the pH of concrete surface can be reduced to 1 by T.thiooxidans (Mori et al.,1992). That is destructive to concrete.
S0+ H2O + 3 2O2
ASOM
−−−−→ SO2−4 + 2H+ (1.4)
Step 3: Chemical reaction between H2SO4and concrete.
During the final step of the biodeterioration process, the biogenic sulfuric acid penetrates into concrete and reacts with portlandite (CH)1 and calcium silicate hydrate (C-S-H) which are the main Portland cement hydrates. This step is characterized by the production of a corroded layer on the surface of concrete. XRD patterns (Davis et al.,1998;Kawai et al.,2005), and other experimental observations (as Fig.1.5) of corroded layer revealed that corrosion products consist of gypsum (CaSO4·2H2O, noted as C¯SH2), silica gel (SiO2, noted as S) and moisture. Thus, during deterioration CH and C-S-H are dissolved, while gypsum and silica gel precipitate as reactions (1.5a) and (1.5b).
CH + H2SO4⇋C¯SH2 (1.5a)
CxSyHz+ xH2SO4⇋xC¯SH2 + ySiO2+ (z − x)H2O (1.5b)
Since gypsum is swelling while it has barely no strength, H2SO4 attack could reduce the performance of concrete, and even lead to the eventual structural failure of the facility.
(a) (b)
Figure 1.5: (a) Concrete coupons exposed to the sewer atmosphere (Okabe et al., 2007); (b) Scanning electron microphotograph of gypsum crystals in the cement paste (Monteny et al.,2000).
1.3
Recent research works about biodeterioration of
cementitious materials
To understand and to fight against such a biodeterioration process involving a succession of bacterial in biofilms and resulting in a change of concrete properties, many research works were conducted focusing on different aspects. Not only experimental (in-situ/laboratory) researches, but also modeling researches were conducted.
Samples of biofilm taken from sewer or cultured in laboratory, were monitored. The type, number and succession of SOB were measured by conventional culture-dependent techniques (Harrison Jr, 1984), conventional cultivation techniques and molecular tools (Vincke et al., 2001), and gene-cloning analysis (Herisson et al.,2013). The understanding of microbial community structures of SOB and their activities in biofilm has been improving continuously. It is generally believed that five species of T hiobacillus play important roles: T.thioparus, T.novellus, T.neapolitanus, T.intermedius and T.thiooxidans. The characteristics of these SOB are listed in Table1.3. Since (Kempner, 1966) has found that the activity of
T.thiooxidans is slowed at pH below 0.9, it is expected that if sulfur source is sufficient, the pH of biofilm
would be limited around 1.
Table 1.3: Characteristics of T hiobacillus in biofilm (Islander et al., 1991)
.
Species pH range for growth Products
T.thioparus 4.5-10 Sulfur, polythionic acids
T.novellus 5- 9.2 Sulfur
T.neapolitanus 4-9 Polythionic acids, sulfuric acid
T.intermedius 1.7-9 Polythionic acids, sulfuric acid
T.thiooxidans 0.5-4 Sulfur, sulfuric acid
1.3 Recent research works about biodeterioration of cementitious materials 7
(Davis et al., 1998), samples of concrete were drilled from the Houston’s sewage collection pipes. Several tests revealed that the average compressive strength of the concrete undergoing degradation was reduced by more than 20%. The mineralogical analysis found that the corrosion layer of concrete contained large amounts of gypsum, which is expansive and has no strength, and yet ettringite was not present. Such obser-vations were reported by other experimental laboratory researches (Ehrich et al.,1999;Vincke et al.,2000) as well. It was explained that ettringite forms at pH ranging from 12.5 to 12, while it starts decomposing into gypsum when pH < 10.6 (Allahverdi and Skvára,2000).
To study the consequences of gypsum precipitation, C3S mortar and paste specimens were exposed to Na2SO4 solution (Tian and Cohen, 2000). The physical properties and chemical composition of samples after corrosion were tested. The experimental results suggest that during gypsum formation tensile stresses may play a role in expansion and subsequent cracking.
To study the behaviour of cementitious materials corroded by H2SO4, researchers (Jahani et al.,2001;
Bassuoni and Nehdi, 2007;Kawai et al., 2005) conducted experiments to simulate the chemical corrosion process of concrete in contact with H2SO4solution.
In the experiment of (Kawai et al., 2005) ordinary Portland cement cubes were immersed in H2SO4 solution with pH=1 in order to simulate the chemical corrosion process in sewer pipe. To keep the con-centration of H2SO4in the solution constant, H2SO4 was added suitably to the solution, and the solution was statical (Method 1) or circulated with a pump and flew into the tank (Method 2). In method 2, the specimens were subjected to the shearing force of the solution flow. Therefore the reaction products were driven out by the flow of solution without precipitating on the sample surfaces. During the tests, the corrosion depth was measured. In Method 1, a layer of reaction products was observed on the surface of the mortar samples. The XRD patterns of this degraded layer showed that reaction products of sulfuric acid attack are mainly gypsum and silica gel. With method 2, few products can be seen on the sample surfaces since most of the reaction products were swept by the solution flow. The solution flow washed the new surface of reaction, thus the samples immersed with Method 2 degraded much deeper and faster than those with the Method 1. In Kawai’s experiment, an immersion test using a solution with low H2SO4 concentration solution (pH=2) was carried out as well. It turned out that corrosion process is very sensitive to H2SO4concentration: all of the samples immersed in H2SO4 solution of pH=2 were almost uncorroded either with Method 1 or Method 2.
In order to investigate the effect of biofilm on the bio-degradation process, some experiments have been done to simulate the biodeterioration process of sewer pipe (De Muynck et al., 2009; Gutiérrez-Padilla et al.,2010;Alexander and Fourie,2011).
8 cycles of accelerated test. Each cycle consisted in 4 steps: (1) incubation in H2S (200 ppm) for 2 days; (2) submersion in 1.5 L of mixed cultures of SOB obtained from a sewer pipe biofilm (medium composition: 10 g/L element sulfur, 3 g/L KH2PO4, 0.1 g/L NH4Cl, 0.1 g/L MgCl·H2O) for 10 days; (3) submersion in distilled water for 2 days; (4) drying at room temperature for 1 day. In the second and third steps, the SOB suspension and water were rotated. The degradation products were removed at the third step. The last step could eliminate SOB remaining on the concrete surface. During the second step, the pH in the SOB suspensions was measured frequently. In the experiment, as a result of the conversion of element sulfur to sulfuric acid by cultures of SOB, a decrease of pH was observed 3-4 days after submersion. The
pH continued to decrease to around 1 after 10 days of testing.
In the works of (Gutiérrez-Padilla et al., 2010), the biodeterioration of low and high quality concrete under conditions simulating sewer pipes were compared with laboratory experiments. With the same conditions of H2S and bacteria, the concrete with low W/C (0.33) showed higher resistance to biogenic sulfuric acid attack than the concrete with high W/C (0.42). While in another research work (Ehrich,1998), the weight loss of mortar samples with different W/C ratio of 0.35, 0.40, 0.45, 0.5, 0.55 were measured respectively. The results of that experiment stated that the lowest weight losses were determined on samples with a W/C ratio of 0.5 and the resistance of mortars was reduced for both high and low W/C ratios. This can be explained as the concrete with a high W/C has larger and more pores. The pores play the role of a capacity to absorb expansion caused by the production of gypsum (Kawai et al.,2005). The influence of W/C of concrete is discussed in Chapter6 of this thesis as well.
It is necessary to improve the understanding of the specific influence of environmental variables, such as H2S level, temperature, and relative humidity. (Joseph et al., 2012) examined changes in the surface chemistry of concrete during the early stages of corrosion by exposing concrete coupons to thirty-six in-dependent conditions in well-controlled laboratory chambers that simulated conditions typically found in various sewer environments across Australia. The results indicated that the role of CO2 on initial surface
pH reduction is insignificant as compared to the influence of H2S. Within the first 12 months, a decrease in surface pH by 4.8 units was observed for coupons exposed to 30◦C and 50 ppm H
2S while significantly lower pH reductions of 3.5 and 1.8 units were detected for coupons exposed to 25◦C and 18◦C respectively, and 50 ppm H2S. However, (Ismail et al., 1993) claimed that under quite high CO2 gas concentration, bio-corrosion rate would decrease due to formation of much calcite which could reduce the porosity of pipe surface. The role of carbonation layer is investigated in Chapter6.
Furthermore, some works have been done to improve the biodeterioration resistance of sewer pipes. A set of in-situ experiments to determine the biochemical parameters influencing the behaviors of ordinary Portland cement (OPC) and calcium aluminate cement (CAC) materials was conducted by (Herisson
1.3 Recent research works about biodeterioration of cementitious materials 9
et al.,2013). It has been found that CAC materials perform better than those with OPC, and the biomass that develops on the surface of the former is different and less abundant. The good behavior of CAC materials could be due to their high aluminum content, which could inhibit the growth of microorganisms. (De Muynck et al., 2009) investigated the effectiveness of different admixtures, and surface treatments towards biogenic sulfuric acid corrosion of concrete. The best protective method is epoxy coating, while the strongest degradation was observed for the cementitious coating. The addition of hydrous silicate failed to improve the resistance performance.
In addition to experiments, some researches have been done on modeling. Existing models mainly focus on the biochemical process or the chemical process separately.
For the chemical corrosion process, which directly results in the degradation of materials, (Jahani et al.,
2001) proposed a diffusion-reaction based model with a moving boundary to predict the corrosion rate. (Chalupeck`y et al., 2012) consider a two-scale reaction diffusion system containing one microscopic scale (pore scale) and one macroscopic scale (sewer pipe scale). In both of them, only dissolution of portlandite or calcite was considered. As another important solid component in cementitious materials, decalcification of C-S-H gel was absent. In addition, only the front of acid neutralization and gypsum formation were captured by the modeling.
In such a biogenic degradation process, the concentration of sulfuric acid is not constant or given, but imposed by the biochemical reactions in the SOB community. Thus the modeling of biochemistry reactions taking place in the biofilm is needed as well.
To simulate the biochemical process, models such as "Wastewater Aerobic/anaerobic Transformations in Sewer (WATS)" model (Jensen et al.,2009) and sulfide oxidation modelling (Nielsen et al., 2005) were developed. Based on experiment data, kinetics and stoichiometry of sulfur oxidation by biofilm were inves-tigated, while rate equations and stoichiometry constants were proposed. These simulations indicated that oxidation of accumulated slowly degradable element sulfur could cause a steady production of sulfuric acid, even when hydrogen sulfide is not present. However, the relationship between pH and H2SO4 production in biofilm is not found in previous research results.
Few modeling focus on the coupling of biochemical process and chemical corrosion process. With HYTEC, (De Windt and Devillers,2010) simulate a bioleaching test applied to ordinary Portland cement pastes during 15 months. By coupling of (bio)chemical alteration, porosity and diffusion evolutions, the long term performance of cementitious materials subjected to biodeterioration was assessed. Various species were considered in this work, and yet their diffusion coefficient were uniform. Moreover, a continuous approach of C-S-H dissolution is absent in this modeling and the effect of swelling of gypsum on the microstructure of concrete was not considered either.
1.4
Research objectives
Apparently, there is a lot of financial implications to change or reinforce the networks of pipes. Thus, it is necessary to develop a tool to address questions such as the service life of current pipes, or the durability of the new pipes made of other materials or protected by new methods. Since the present modeling are still imperfect, the objectives of this PhD study are to improve the understanding of the biogenic acid attack of concrete, and propose a method to predict the performance of concrete servicing in such extreme conditions. The biochemistry process in biofilm and the chemical process in cement paste are investigated and coupled with each other. A reactive transport model to predict the behaviour of cement paste in contact with H2SO4 solution or sulfur-oxidizing bacteria community is expected to be proposed. Therefore, the main parts of biogenical acid attack should be included in this model as follows:
1. Production variation of H2SO4 with pH in biofilm.
2. Dissolution and precipitation reactions of portlandite (CH) and gypsum (C¯SH2).
3. Continuous variation (decrease) of the Ca/Si ratio during the dissolution reaction of C-S-H.
4. Diffusion of different species and thermodynamical equilibrium.
5. Changes of porosity and damage of materials induced by the production of gypsum.
6. Coupling of H2SO4 production, transport equations and chemical reactions.
7. Effect of pore clogging resulting from carbonation on the biodeterioration rate during early time.
The model is implemented within a finite-volume code Bil (http://perso.lcpc.fr/dangla.patrick/bil). Coupled with the H2SO4degradation modeling of concrete, the change of pH in biofilm and the composition of cement paste are expected to be calculated during the biodeterioration process. Furthermore, the degradation rate of concrete submitted to biogenic acid attack will be predicted. Simulations results of a set of chemical exposure tests (external sulfuric acid solution attack, conducted by (Kawai et al.,2005;
Vincke et al., 1999)) and accelerated micro-biological tests conducted by (De Muynck et al., 2009) are presented and compared with experimental results. Due to the lack of bacteria activity data (such as the relationship between H2SO4 production rate of various bacteria and pH in biofilm), this study only simulates the biological process of biofilm by fitting on the measured experimental data.
1.5
Outline of thesis
Since this thesis focuses on the biodeterioration of cementitious materials induced by an existing SOB community in an environment containing H2S gas, the incubation process of bacterial and the production process of H2S in wastewater is not addressed. In Chapter 2, some details of the mechanisms of H2SO4 production in the biofilm are presented. The influence of environmental factors, such as temperature,
1.5 Outline of thesis 11
concentration of H2S in atmosphere, pH are considered. The modeling of H2SO4 production in biofilm is described in detail. The inhibition/promotion of H2SO4 production by the change of pH during the microbial metabolic process is introduced in the modeling. The H2SO4 production modeling is verified at the end of Chapter 2.
After H2SO4 production is described, the deterioration of cementitious materials subjected to H2SO4 attack is taken into account. Chapter 3 introduces the major chemical reactions taking place during H2SO4 attack. Since the cementitious minerals are expected to completely dissolve, dissolution and precipitation reactions of CH and gypsum (C¯SH2) are described by mass action laws and threshold of ion activity products. An innovative approach for the C-S-H is applied to explain the continuous decalcification and facilitate the numerical modeling.
Resulting from the precipitation-dissolution of the various minerals, the porosity of cementitious ma-terials will change. Thus the diffusion of species would be influenced as well. Regarding the swelling of gypsum, Chapter 4 introduces a simplified damage model of the microstructure of cement paste. Based on the balance of volume, the microstructure evolution is accounted for by adjusting the porosity using different methods during different damage stages.
Chapter 5 introduces the reactive transport modeling and numerical procedures. To both of the biofilm
and cement paste, the field equations are presented. Different diffusion coefficients are employed for various ions, yet only transport of aqueous species are considered. Following the introduction of principle of the finite volume method, coupling of the bio-chemistry process in biofilm and chemistry process in cement paste is illustrated.
In Chapter 6, several calculations are carried out to simulate experimental works from (Kawai et al.,
2005;Vincke et al., 1999) where cement samples are directly immersed in H2SO4 solution with constant or cyclical variable concentrations. Simulation results of different conditions, e.g., statical solution and circulated solution, are compared with experiment observations. The sensitivity of H2SO4 concentration, initial porosity, and damage criterion are analyzed. The effect of initial porosity and carbonation layer in early time are investigated as well.
After the modeling of chemical deterioration has been verified, in Chapter 7 the experiment conducted by (De Muynck et al.,2009) is simulated to predict the bio-degradation process. The simulation results of
pH evolution in biofilm and the change of cement paste properties are compared with experimental results.
Effect of environmental factors (such as H2S content) is discussed and a long term prediction is presented. Finally, the conclusion of this thesis and some future improvements are presented in Chapter 8.
Chapter 2
The production of H
2
SO
4
by
micro-organisms in biofilm
2.1
Introduction
For biogenic sulfuric acid attack, H2SO4production is a fundamental process, which provides the strong corrosion medium causing the deterioration of concrete. Thus, the first step to simulate the bio-deterioration of sewer pipes is the calculation of the production of H2SO4 in biofilms. As the major issue associated with the corrosion of concrete, the relationship between H2S gas level and the corrosion rate of the sewer pipes is still a major research question (Apgar et al., 2007). As introduced in Chapter 1, H2S absorption by biofilms and concrete surface provides the sulfur source of H2SO4 production, whose rate is controlled by the oxidation of H2S in biofilms (see Fig.2.1). In this paper, the generation and emission of H2S from wastewater is not considered and the level of H2S gas in sewer pipes is constant.
For sulfur-oxidizing bacteria (SOB), the initial pH of ordinary Portland cement concrete is too high to grow. (Mori et al.,1992;Rigdon and Beardsley,1956) proposed that the microbial activity on the concrete surface is initiated at pH around 9 and thereafter, a succession of microbial communities develops, which can utilize sulfide and/or its oxidized forms, such as element sulfur (Joseph et al., 2012). The abiotic
pH reduction of concrete surface results to an initial lag period before the start of active corrosion phase
(Islander et al.,1991).
Therefore, the primary stage is the reduction of pH at the concrete surface, where pH decreases from about 12.5 to 9 by chemical acid reactions of CO2 and H2S with concrete. The experimental researches of (Joseph et al.,2012) suggested that H2S gas is the major factor for the surface pH reduction in sewers during early stages of exposure rather than carbonation.
Figure 2.1: Schematic outline of the H2S production process. (Jensen et al.,2008)
According to literatures (Harrison Jr,1984;Islander et al., 1991;Herisson et al.,2013), different types of SOB are involved in H2S oxidation process which is influenced by various factors, such as the amount of sulfur source, pH and temperature. For such a complex process, there is a lack of fundamental understanding of the quantitative relationship among these factors. However, the kinetics and stoichiometry of sulfide oxidation by biofilms can be described by Wastewater aerobic/anaerobic Transformations in Sewer (WATS) model (Jensen et al.,2009;Nielsen et al.,2005) regardless the influence of pH. Yet, to our knowledge, no attempt has been made to model both the neutralization of concrete surface and H2SO4 production in biofilms.
This chapter studies first with the absorption of H2S gas by concrete surface. Then, the chemical reactions of H2S and concrete with constant temperature and humidity is described. For the specific biofilms, we model the production of H2SO4 by fitting the measurements of the pH evolution in biofilms. For a more general condition with varying H2S content, we follow the WATS model to calculate the production rate based on H2S content.
2.2
Neutralization of pipe surface during early stage
2.2.1
Absorption of H
2S
Since only aqueous H2S can react with concrete or be oxidized by SOB, the transferring of H2S from sewer gas to concrete surface or biofilms is a crucial step. H2S can be absorbed into pore solution of concrete and biofilms from gas phase in sewer pipes. The adsorption of H2S governs the time of surface neutralization and the production of H2SO4. (EPA,1974) suggested that all released H2S from wastewater
2.2 Neutralization of pipe surface during early stage 15
is immediately absorbed by concrete surface, resulting in zero H2S in the gas phase. However, experimental results of (Vollertsen et al.,2008;Nielsen et al.,2008) revealed that transferring of H2S from the gas phase to the concrete surface is not an instantaneous process and absorption kinetics should be taken into account. By experiments with pilot-scale sewer reactors as in Fig. 2.2, (Vollertsen et al., 2008) found that the absorption rate (FH2S) could be described as a power function in the gas phase H2S concentration (pH2S).
Figure 2.2: Schematics of the pilot scale reactors. (Vollertsen et al.,2008)
Furthermore, (Nielsen et al., 2012) presented an empirical relationship between the Reynolds (Re) number of the gas flow and the absorption rate. For the sake of simplicity, the effect of gas flow regime is ignored in this paper. The nthorder kinetics of H
2S absorption of concrete surface and biofilms is described as follows:
FH2S= kabsp
n
H2S (2.1)
where, pH2S is the content of H2S gas (ppm). kabs is the surface specific H2S absorption rate constant,
which is reported to vary between 6.25×10⁻⁸and 3.12×10⁻⁷ mol S m−2 s−1 (ppm H
2S)−ndepending on temperature (Vollertsen et al.,2008). The reaction order n is correlated with kabs, with n approximately 0.5 for low kabs and 0.8 for high kabs. Since temperature is constant at 25◦C in this paper, kabsis determined as 2×10⁻⁷ mol S m−2 s−1 (ppm H
2S)−nand n = 0.75. Then the absorption rate of H2S versus content of H2S in gas phase is plotted in Fig. 2.3.
2.2.2
Chemical reaction between aqueous H
2S and concrete
Although the acidification of aqueous hydrogen sulfide is much weaker than that of H2SO4, it dissociates in the same manner as sulfuric acid and releases H+ as follows (Tsonopoulos et al., 1976;Su et al., 1997):
H2S ⇋HS−+ H+ KH
2S= 8.9 × 10⁻⁸ (2.2)
0
5e-08
1e-07
1.5e-07
2e-07
2.5e-07
3e-07
3.5e-07
4e-07
0
200
400
600
800
1000
H
2S absorption rate
(mol S m
-2s
-1(ppm H
2S)
-0.75)
H
2S gas level (ppm)
Figure 2.3: H2S absorption rate at different H2S gas content.
where the equilibrium constant is at 298K which keeps constant. Thus calcium hydroxide could be dis-solved and calcium sulfide forms when H2S is absorbed by concrete surface. These global reactions can be understood by combining three basic dissociation reactions Eq.(2.4)-Eq.(2.6), which involve the minerals and the aqueous species in pore solution.
CH ⇋ Ca2+ + 2OH− (2.4)
CxSyHz ⇋ xCa2+ + 2xOH− + ySiO02 + (z − x)H2O (2.5)
CaS ⇋ Ca2+ + S2− (2.6)
Furthermore, CaS precipitation is not stable in acidic solution. When there is enough H2S, calcium hydrogen sulfide, which is soluble, would be produced as follows (Idriss et al.,2001):
CaS + H2S ⇋ Ca(HS)2 (2.7)
The equilibrium condition of these dissociation reactions are depended on the concentration of H2S. The dissolution of CH and the decalcification of C-S-H are the same as those with H2SO4 attack, which are detailed in Chapter3. Taking the equilibrium between CH and CaS for instance, we have
QCaS KCaS = QCH KCH ρH2S ρCH H2S (2.8)
2.2 Neutralization of pipe surface during early stage 17
where, K and Q are the equilibrium constant and ion activity product of CH and CaS respectively. KCH = 6.5 ×10⁻⁶ and K
CaS = 7.9 ×10⁻⁷. ρCHH2S is the value of ρH2S defined by the coexistence of CH , CaS
and aqueous phase. It can be calculated by a given function of the solubility constants of other species as Eq.(2.9).
ρCHH2S=
KH22OKCaS
KH2SKHS−KCH
(2.9)
With the help of the constants mentioned above, ρCH
H2S ≈ 8.90 × 10
−10 mol/L. Hence, CaS would not precipitate when ρH2S< ρ
CH
H2S, while dissolution of CH takes place when ρH2S> ρ
CH
H2S.
In the model, the CH dissolution process is governed by a simple kinetic law which is assumed to be governed only by the difference of chemical potentials of H2S between the current state (µH2S(current)) and
the equilibrium state (µH2S(eq)). Details of the kinetic and decalcification of C-S-H is demonstrated in
Chapter 3, as well as an example of H2S attack.
2.2.3
p
H reduction of concrete surface
With the absorption of H2S in gas phase and the chemical reaction of H2S with concrete mentioned above, the pH reduction of concrete surface can be calculated.
(Roberts et al., 2002) experimentally reproduced a reduction of pH in pore water by exposing fresh concrete samples to hydrogen sulfide gas concentrations of 50, 100, and 250 ppm. The pH reduction is given by
4.4 × 10⁻⁵pH unit/day/ppm of H
2S · pH2S+ 0.021 pH unit/day (2.10)
(Okabe et al.,2007) measured the pH reduction rate for mortar coupons placed in sewers with H2S of 30 ppm ± 20 ppm for a period of 56 days. The result was 0.06 pH unit/day, which is approximately 3 times of the result of Eq.(2.10). However, the experiment was in-situ, where microbial processes could be involved in.
Thus, we simulate a set of experiments conducted and clearly described by (Joseph et al., 2012). In the experiments, concrete coupons were exposed to different H2S gas level (4.5, 7.5, 15.8, 26.5, 48.9 ppm) in well-controlled laboratory chambers, where the temperature is 25◦C, for 1 year. The surface pH of the samples before exposure was 10.6 ± 0.3, which is near the pH of a carbonated sample, indicating that the samples were carbonated during the manufacturing and/or transportion. Therefore, in our simulation calcite is considered as the solid phase of samples instead of portlandite. After exposure of 1 year, the simulation results and experimental results of the decrease of pH in surface are compared in Fig.2.4.
0
1
2
3
4
5
0
10
20
30
40
50
Decrease in surface pH
H
2S (ppm)
Experiment
Simulation
Figure 2.4: Decrease in surface pH (pH(initial) - pH(exposed)) after 1 year.
For Fig.2.4, our modeling can predict the pH reduction of pipe surface during initial time fairly well. The solid compositions evolution during H2S attack will be illustrated by a simulation example of representative elementary volume (REV) in Chapter 3.
2.3
The production of H
2SO
4by sulfur-oxidizing bacteria
When the environment of pipe surface is suitable for the microbial succession, biofilms starts to form. With the supply of hydrogen sulfide, these microorganisms can produce biogenic sulfuric acid which attacks the concrete. Some experimental results (Herisson et al., 2013) indicated that the oxidation rate of H2S is controlled by the activity and the amount of SOB, which is determined by the pH in SOB media, H2S content in sewer, temperature and the concentration of Al3+ in the biofilm. However, the quantitative effect of these factors on H2SO4 production is not clear for now.
Different types of SOB are responsible to different deterioration degree of concrete as listed in Table
1.2. They are active in different ranges of pH (see Fig.2.5) and produce H2SO4 with different rates. Two general categories of SOB can be differentiated based on their optimal pH for growth (Hudon et al.,2011): Neutrophilic Sulfur-Oxidizing Bacteria (NSOB), which develops at pH near neutral and are found at the beginning of biodeterioration; Acidophilic Sulfur-Oxidizing Bacteria (ASOB), which prefer acidic media. Normally, the H2SO4 production rate of NSOB is much slower than that of ASOB. Thus, NSOB only can cause slight deterioration.
2.3 The production of H2SO4 by sulfur-oxidizing bacteria 19
pathways in biofilms, which can occur concurrently (Hudon et al.,2011;Islander et al., 1991).
Figure 2.5: Succession of SOB in different pH range (Herisson,2012)
Figure 2.6: Sulfur oxidation states typical in sewer. (Biologic pathway is shown with full lines; chemical, with dashed lines.) (Islander et al.,1991)
For heavily deteriorated sewer pipes, Acidithiobacillus thiooxidans bacteria is normally detected in biofilms (Okabe et al., 2007; Cho and Mori, 1995; Nica et al., 2000). Most of the present laboratory researches are carried out based on the presence of Acidithiobacillus thiooxidans, whose oxidation process is modeled by WATS model (Hvitved-Jacobsen et al.,1998;Nielsen et al.,2005;Jensen et al.,2009). (Jensen et al.,2009) showed that in the corrosion products of concrete, H2S is rapidly oxidized to a mix of elemental sulfur and H2SO4. They observed two fractions of elemental sulfur: a readily degradable fraction which was oxidized almost as fast as the oxidation of H2S, and a slowly degradable fraction which was oxidized much slower.
If H2S is continuously present during the early time, slowly degradable elemental sulfur would accumu-late and cause a delayed formation of sulfuric acid even if H2S is no longer absorbed later.
There is still a lack of the quantitative understanding of the H2SO4 production, the succession of different types of SOB and the influence of environmental factors. Among them, Al3+ion has bacteriostatic effect Herisson(2012). Since we deal with the Portland cement based sewer pipes in this paper, Al3+ is neglected. For sewer pipes degraded heavily, the temperature is normally 25◦C to 30◦C (Yongsiri et al.,
2004). Therefore, in our modeling the temperature and humidity is constant. In this paper, dealing with different experimental conditions, H2SO4 production controlled by pH and H2S content are considered respectively.
2.3.1
Modeling of H
2SO
4production with given pH evolution in biofilm
In some experimental researches, the pH evolution in biofilms or SOB suspension with time were mea-sured (Vincke et al., 1999;De Muynck et al.,2009). Thus, it is possible to model the H2SO4 production process by fitting the pH evolution.
In the sewer pipes degraded heavily, the content of H2S gas in sewer could reach 400 ppm (Mori et al.,
1992). In some laboratory researches focusing on the deterioration process, element sulfur content in SOB culture was quite high and the concrete samples were incubated by H2S gas or biological sulfur solution (Vincke et al., 1999; De Muynck et al., 2009). For such conditions, we assume that element S source is always enough for SOB. Thus, in this simplified modeling the production of H2SO4 is controlled by pH which itself is determined by the amount of H2SO4. According to the experimental observations (Ehrich
et al.,1999), the activity of SOB increases until pH is reduced to a critical value, depending on the type of bacteria species. When pH is lower than the critical value, H2SO4 production rate drops rapidly. In this paper, the production process of sulfuric acid in SOB media is divided into two step:
NSOB dominating step: When pH in SOB media is higher than the value of pHNSOB, H2SO4is produced by NSOB, whose production rate is quite low.
ASOB dominating step: When pH in SOB media is lower than the value of pHNSOMB, H2SO4is produced by ASOB rather than NSOB which can’t survive in acidic environment. The production rate of H2SO4 keeps increasing until pH reaches pHASOB, where the metabolic activity of ASOB reaches peak value. With
pH below pHASOB, the metabolic activity of ASOB is limited. Consequently, H2SO4 production rate is reduced.
2.3 The production of H2SO4 by sulfur-oxidizing bacteria 21 NSOB : RH2SO4−NSOB= α0 σ√2πe −(pHNSOB− pHASOB) 2 2σ 10pHNSOB−pH (2.11) ASOB : RH2SO4−ASOB= α0 σ√2πe −(pH − pHASOB) 2 2σ (2.12)
where, α0 and σ are constants depending on SOB numbers and activity. In this paper, the value of α0 and σ are determined by fitting experimental measurement. To simulate the experiments conducted by (De Muynck et al.,2009), which will be introduced in Chapter 7, we set pHNSOB= 2.5 and pHASOB = 1.5. When pH > pHASOB, α0= 8 ×10⁻⁷mol/L·s, σ = 0.48; while α0 = 4 ×10⁻⁷mol/L·s, σ = 0.24, when pH <
pHASOB.
The relationship between H2SO4 production rate and pH is plotted in Fig.2.7, which indicates that few H2SO4 is produced until pH decreases to 4. With further decreasing of pH, lots of H2SO4 is produced by ASOB and the production rate rises sharply. Once pH was decreased below 1.5, the H2S production rate drops rapidly. The verification of this relationship could be found in Chapter 7, where the experiment of (De Muynck et al.,2009) is simulated and analysed.
0
1e-07
2e-07
3e-07
4e-07
5e-07
6e-07
7e-07
0
1
2
3
4
5
6
7
8
9
Production rate (mol/L s)
pH
Production rate of H
2SO
4Figure 2.7: H2SO4 production rate and pH
2.3.2
Modeling of H
2SO
4production with given H
2S content in gas phase
Under in-situ conditions, H2S is not always at high level and it is easier to monitor H2S level in gas phase than pH in SOB media. According to experimental researches (Jensen et al.,2008;Vollertsen et al.,