DIAL • 4, rue d’Enghien • 75010 Paris • Téléphone (33) 01 53 24 14 50 • Fax (33) 01 53 24 14 51 E-mail : [email protected] • Site : www.dial.prd.fr
D
OCUMENT DE
T
RAVAIL
DT/2008-03
Vietnam’s terms of accession and
distributional impact of WTO
membership
Jean-Pierre CLING
Mohamed Ali MAROUANI
Mireille RAZAFINDRAKOTO
Anne-Sophie ROBILLIARD
François ROUBAUD
VIETNAM’S TERMS OF
ACCESSION
AND
DISTRIBUTIONAL
IMPACT OF WTO MEMBERSHIP
1Jean-Pierre Cling Mohamed Ali Marouani
IRD-DIAL, Paris DIAL, IEDES
[email protected] [email protected]
Mireille Razafindrakoto Anne-Sophie Robilliard François Roubaud IRD-DIAL, Paris IRD-DIAL, Paris IRD-DIAL, Paris [email protected] [email protected] [email protected]
Document de travail DIAL
Août 2008
ABSTRACT
The strong growth of the Vietnamese economy over the last two decades has brought about sweeping economic and social changes. In particular, there has been a sharp downturn in poverty along with an upturn in social inequalities (albeit not as sharp as in China). This makes the question of the distributional impact of the country’s WTO accession (January 2007) a particularly keen one. The first simulations made using our micro-simulation model point to mainly four types of redistributive effects induced by WTO membership: job gains (especially industrial jobs), growth in real wages, reduction in gender inequalities, and increase in inequalities between rural and urban areas (but slight drop in overall inequalities). Our findings demonstrate the importance of flanking measures to accompany WTO accession and making the most the opportunities that arise, especially in the area of training, domestic migration, regional policies and assistance to wage earners affected by restructuring.
Key Words: International Trade; WTO; Labour; Inequalities; Vietnam.
RESUME
La forte croissance de l’économie vietnamienne au cours des deux dernières décennies s’est accompagnée de profondes transformations économiques et sociales. En particulier, on a observé une forte réduction de la pauvreté, accompagnée d’une progression des inégalités sociales (quoique moins accentuée qu’en Chine). Dans ce contexte, la question de l’impact distributif de l’adhésion à l’OMC intervenue en janvier 2007 se pose avec acuité. Les premières simulations effectuées à l’aide de notre modèle de micro-simulation comptable indiquent que l’adhésion à l’OMC aura principalement quatre types d’effets redistributifs : gains d’emplois (en particulier industriels) ; croissance des salaires réels ; réduction des inégalités de genre ; progression des inégalités entre zones rurales/urbaines (mais tassement des inégalités globales). Nos résultats montrent l’importance de prendre des mesures pour accompagner l’entrée à l’OMC et saisir les opportunités offertes, en particulier dans le domaine de la formation, des migrations internes, des politiques régionales et de l’aide aux salariés touchés par les restructurations.
Mots clés : Commerce international ; OMC ; Emploi ; Inégalités ; Vietnam. JEL Code: F16
Contents
INTRODUCTION ... 5
1 ACCESSION TO THE WTO CROWNS A PROCESS OF REFORM AND INTEGRATION INTO THE WORLD ECONOMY... 5
1.1 Rapid growth and sharp drop in poverty ... 5
The emergence of Vietnam since the launch of Doi Moi ... 5
A string of trade agreements ... 6
A sharp drop in poverty ... 7
1.2 An export-based growth strategy ... 8
Outstanding growth in exports ... 8
Asia’s weight in trade ... 10
1.3 The boom in foreign investment ... 11
The decisive contribution of foreign investment to exports ... 11
The country’s two leading economic regions attract nearly all the foreign investment ... 12
1.4 WTO accession needs to be placed in context ... 12
2 ANALYSIS OF VIETNAM’S TERMS OF ACCESSION TO THE WTO ... 12
2.1 A market increasingly open to imports ... 13
Sustained tariff reduction ... 13
Abolition of tariff exemptions... 14
Export taxes remain ... 14
2.2 Other non-tariff measures ... 15
Prohibition of export subsidies ... 15
Extensive reform of the commercial and legal framework ... 15
More open to foreign investment ... 16
Continued privatization ... 16
2.3 Access to the leading markets is still insecure despite the lifting of export quotas ... 16
Lifting of export quotas on the American and European markets... 16
Access to the American and European markets is still insecure ... 17
2.4 The WTO accession agreement affects all the economic sectors ... 18
3 IMPACTS OF VIETNAM’S ACCESSION TO THE WTO: A REVIEW OF RECENT LITERATURE ... 19
3.1 The impact of the WTO on growth, poverty and inequalities ... 19
The macroeconomic impact (growth and trade) ... 19
The impact on inequalities and poverty ... 22
3.2 The case of Vietnam: the impact of WTO accession ... 23
The impact on growth ... 24
The distributional impact of WTO accession ... 26
3.3 The shortcomings of the studies on the WTO’s impact on Vietnam ... 28
4 ANALYSIS OF THE DISTRIBUTIONAL IMPACT OF VIETNAM’S ACCESSION TO WTO: SIMULATION BASED ON A MACRO-MICRO MODEL ... 28
4.1 Labour market structure and dynamics in Vietnam from 1997 to 2004 ... 29
The rising rate of wage employment ... 29
A large portion of underemployment among the labour force ... 31
A sharp rise in real wages in recent years ... 32
A growing proportion of wage income in the household budget ... 33
4.2 Presentation of the macro-micro model ... 34
Presentation of the CGE model ... 34
Presentation of the micro-simulation model ... 36
4.3 Analysis of the simulations ... 37
The scenarios simulated using the model ... 37
The main aggregate results of the simulations ... 38
Substantial sector reallocations of employment ... 39
Extremely different impacts on urban/rural incomes and incomes by region ... 41
CONCLUSION ... 44
REFERENCES ... 46
APPENDICES ... 50
Appendix A: Main commitments made by Vietnam for WTO accession ... 50
Appendix B: SAM 2000, 31-sector disaggregation ... 51
Appendix C: Rule for the allocation of variations in working hours ... 52
Appendix D: Macro-micro interface variables ... 53
Appendix E: Scenario parameters ... 54
List of tables
Table 1: Growth in poverty by region (%) ... 8Table 2: Apparel exports from the leading suppliers to the EU, United States and Japan (millions of US dollars and %) ... 10
Table 3: Geographic structure of foreign trade (2005) ... 10
Table 4: Share of foreign firms in exports in 2007* ... 11
Table 5: Destination of foreign investment projects in Vietnam by province, excluding oil ... 12
Table 6: Tariff commitments made by Vietnam under the terms of its WTO accession (%) ... 14
Table 7: Forecasts based on 23 scenarios from studies using CGE models on the impact of Vietnam’s accession to the WTO (% variation) ... 24
Table 8: Rate of wage employment by region 1997-2004 ... 30
Table 9: Rate of wage employment by population type 1997-2004 (residence, gender and skills) ... 30
Table 10: Rate of wage employment by economic sector ... 31
Table 11: Employment rates by skills in 2004 ... 31
Table 12: Growth in wage level by type of manpower 1997-2004 ... 32
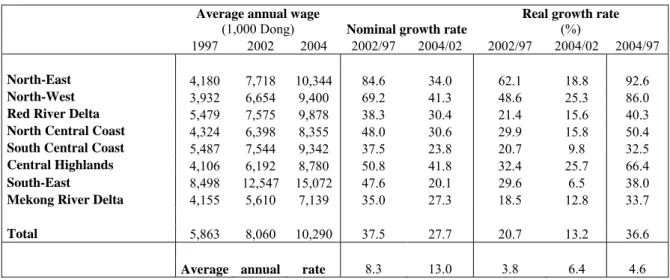
Table 13: Growth in wage level by region 1997-2004 ... 33
Table 14: Share of wage income in household budgets 1997-2004 (region and quintiles) ... 33
Table 15: Industrial employment structure and dynamics by type of manpower 1997-2004 ... 34
Table 16: Description of the simulated scenarios ... 38
Table 17: Results of the simulations – macroeconomic aggregates ... 39
Table 18: Results of the simulations – central government revenue ... 39
Table 19: Results of the simulations – value-added by sector (in volume) ... 40
Table 20: Results of the simulations – wage rates and demand for labour by type ... 41
Table 21: Microeconomic results – household income ... 42
Table 22: Microeconomic results – poverty rates (%) ... 43
Table 23: Microeconomic results – Gini coefficient ... 43
List of charts
Chart 1: Average GDP growth rate (2000-2007) in % ... 6Chart 2: Growth in poverty and inequalities (1993-2004) ... 7
Chart 3: Growth in the market shares of Asian exporters ... 9
Chart 4: Share of manufactured goods in total exports (%) ... 9
Chart 5: Annual total of foreign direct investment projects (2000-2007) ... 11
List of Boxes
Box 1:Non-market economy (NME) status ... 17INTRODUCTION
Vietnam joined the World Trade Organization in January 2007. This accession came some 20 years after the launch of Doi Moi, which marked the country’s transition to a “socialist-oriented market economy” and the start of a process of rapid economic growth and integration into the world economy. The growth model followed by Vietnam over the last two decades has brought about sweeping economic and social changes. In particular, there has been a sharp downturn in poverty along with an upturn in social inequalities (albeit not as sharp as in China). This makes the question of the distributional impact of the country’s WTO membership, as studied in this report, a particularly keen one.
The first part of this report presents an overview of the economic policies implemented by Vietnam since 1986, culminating in its WTO accession, and their results in terms of economic growth and social indicators, foreign trade and foreign direct investment (FDI).
Part two describes Vietnam’s terms of accession. It shows that WTO-induced tariff liberalization is relatively limited on the whole and that most of the commitments concern other areas: competition, services, subsidies, openness to FDI, etc. Moreover, Vietnam has improved its access to the major international markets.
Part three reviews the work done on the distributional impact of trade liberalization in the developing countries and, more particularly, in Vietnam. The evaluations made to date of the impact of the trade policies on Vietnam (growth, poverty, income distribution, etc.) find modest effects.
Part four describes recent employment and income dynamics and presents some tentative findings on the distributional impact of the WTO by expanding on previous studies in two ways: first, by using a computable general equilibrium model combined with a micro-simulation model to hone the evaluation of the impact on households; second, by looking beyond the effects of tariff liberalization to assess the impact of market access gains and the additional direct investment secured.
1 ACCESSION TO THE WTO CROWNS A PROCESS OF REFORM AND INTEGRATION INTO THE WORLD ECONOMY
Over the last two decades, Vietnam has undertaken a programme of reforms that has dramatically changed the way the economy operates and led to accession to the World Trade Organization (WTO) at the beginning of 2007 (Chaponnière, Cling and Bin, 2007). These reforms have had three major socio-economic repercussions, which are briefly described in this section: rapid economic growth resulting in a sharp drop in poverty along with a certain rise in inequalities; growing integration into the world economy via an export-based growth strategy; and a boom in foreign direct investment flows, which have increased with WTO membership.
1.1 Rapid growth and sharp drop in poverty
After years of war, followed by economic recession and shortages, the 1986 launch of Doi Moi marked the beginning of a phase of strong growth for the Vietnamese economy, one of the fastest growing economies in the world along with China. This growth generated a sharp rise in the socio-economic indicators and a drastic drop in poverty. Yet this improvement is unevenly distributed among the regions and the different population groups.
The emergence of Vietnam since the launch of Doi Moi
Since the beginning of the 1990s, Vietnam’s GDP growth has hovered around 8% per year (a performance similar to China, with a growth rate of some 9% per year over the same period). The Vietnamese economy posts the highest growth in Asia after China (Chart 1).
This rapid growth is driven by the programme of economic reforms launched in late 1986 under the name of Doi Moi (“Renovation”). The adoption of this programme, coming a few years after the launch of a similar programme by China (1978), entailed the definition of the “socialist-oriented market economy” concept. Radical measures were steadily introduced over the years that followed:
- Decollectivization of agriculture and the abolition of price controls;
- Creation of a private sector made up of small and medium-sized enterprises; - Partial dismantlement of the centrally planned economy;
- External liberalization with tariff reduction and the abolition of the State monopoly in foreign trade.
Chart 1: Average GDP growth rate (2000-2007) in %
0% 2% 4% 6% 8% 10% Taiwan Philippines Indonesia Thailand South Korea Singapore Malaysia Hong Kong India Vietnam China
Source: Chaponnière, Cling and Bin (2007).
A string of trade agreements
Since the 1993 lifting of the US trade embargo, Vietnam has resumed relations with the international community (return of international aid) and signed a number of trade agreements that have stepped up its process of economic growth and international integration launched with Doi Moi:
- Following its membership of ASEAN2 (1997), tariffs on imports from ASEAN countries were
gradually reduced and have stood at less than 5% within the Asian Free Trade Area (AFTA) since 2006. The other ASEAN members have also applied this tariff reduction to exports of Vietnamese products, improving access to their markets. The ASEAN-China Free Trade Agreement (ACFTA) signed in 2004 brought further tariff reductions in trade with China (already applied, in particular, to certain agricultural products);
- In 2000, Vietnam signed the United States-Vietnam Bilateral Trade Agreement (USBTA). This agreement opened the door for Vietnamese products to enter the American market (nevertheless subject to quotas). Vietnamese exports to the American market were granted most-favoured-nation (MFN) status under this treaty in 2002, and average tariffs on Vietnamese products fell from around 40% to 3%–4%. In return, Vietnam reduced its tariffs on imports from the United States and made a number of commitments to open up to American investors (see below); - At the beginning of 2007, Vietnam joined the WTO following ten years of negotiations and
exactly 20 years (to the nearest month) after the adoption of Doi Moi. As a member of the WTO, Vietnam now benefits from most-favoured-nation (MFN) status in all the member countries (which also means an end to quotas on its exports) and must, for its part, apply all the WTO rules. Accession to the WTO is therefore something of an endorsement of a long process of reform and integration into the world economy.
A sharp drop in poverty
The strong economic growth posted by the Vietnamese economy has sent poverty rates tumbling since the 1990s (Chart 2). The overall monetary poverty rate has been slashed by two-thirds since 1993 (from 58.1% to 19.5% in 2004; VASS, 2006).
At the same time, there has been an upturn in inequalities, albeit less marked than in China. The country’s Gini index rose from 0.34 to 0.37 from 1993 to 2004. Yet the appraisal of inequality dynamics in Vietnam over the last decade remains a subject for debate. Although the Gini index has not risen substantially, other indicators point to a sharp increase in inequality pressures. For example, the interquintile ratio (ratio between the population’s richest and poorest quintiles) rose from 4.97 to 6.27 over the same period, reflecting the emergence of an upper middle class concentrated in the cities. Moreover, analyses of the change in non-monetary welfare and health indicators (childhood malnutrition) reveal an increase in inequalities (Moser et al., 2005; Tran et al., 2003). One of the purposes of this study is to take a more detailed look at the issue of trade-policy-related inequalities.
Chart 2: Growth in poverty and inequalities (1993-2004)
58.1 37.4 28.9 19.5 37 35 35 34 4.97 6.27 5.49 6.03 0 10 20 30 40 50 60 70 1993 1998 2002 2004 4 4.5 5 5.5 6 6.5
Incidence of poverty Gini index
Rich/poor ratio
Source: VASS, 2006; our own calculations.
The human development indicators (health, education, etc.) have also evolved in a highly positive manner. With a rate of nearly 100% of pupils finishing primary school and a 75.8% rate of enrolment in secondary education, Vietnam is way ahead of all the other countries with comparable levels of development. The same holds true for life expectancy, which stood at 68 years for men and 73 years for women in 2005.
At regional level, highly contrasting poverty trends are found (Table 1). In the region of Ho Chi Minh City (South-East) and, to a lesser extent, in the Red River Delta (Hanoi), monetary poverty has virtually disappeared and food poverty (generally called “extreme poverty” in the international reports) has been all but wiped out. However, certain regions have benefited less from the widespread reduction in poverty. In the North-West, in particular, overall poverty and food poverty have barely decreased and remain very high.
Table 1: Growth in poverty by region (%)
1993 1998 2002 2004
Overall poverty rate 58.1 37.4 28.9 19.5
North-East 86.1 62.0 38.4 29.4
North-West 81.0 73.4 68.0 58.6
Red River Delta 62.7 29.3 22.4 12.1
North Central Coast 74.5 48.1 43.9 31.9
South Central Coast 47.2 34.5 25.2 19.0
Central Highlands South-East
Mekong River Delta
70.0 37.0 47.1 52.4 12.2 36.9 51.8 10.6 23.4 33.1 5.4 19.5
Food poverty rate 24.9 15.0 9.9 6.9
North-East 29.6 17.6 14.1 9.4
North-West 26.2 22.1 28.1 21.8
Red River Delta 24.2 8.5 6.5 4.6
North Central Coast 35.5 19.0 17.3 12.2
South Central Coast 22.8 15.9 10.7 7.6
Central Highlands South-East
Mekong River Delta
32.0 11.7 17.7 31.5 5.0 11.3 17.0 3.2 7.6 12.3 1.8 5.2
Source: GSO; our own calculations.
Table interpretation:
- Overall poverty: in 2004, an individual was considered to be poor (“overall poverty”) if his annual expenditure was less than 11 US dollars per month (173,000 Dong), defined as the monetary poverty line.
- Food poverty: this is defined based on the sum of money required to buy a basket of food to provide an intake of 2,100 calories/day, evaluated at 10 US dollars per month (160,000 Dong) in 2004. Overall poverty covers, in addition, non-food goods considered to be basic needs.
1.2 An export-based growth strategy
Since the launch of Doi Moi and in keeping with the East Asian “dragons”, Vietnam has conducted a trade policy that combines an export-based growth strategy underpinned by various subsidies (creation of export processing zones, in particular) with an import-replacement strategy. This has helped Vietnam create an automotive industry (mainly motorcycles), become the world number two exporter of rice, number one in Robusta coffee, etc.
Outstanding growth in exports
Growth in Vietnamese exports has been close on 20% per year in value terms since the mid-1980s, placing the country ahead of even China (approximately 15% per year). Vietnam’s competitiveness has benefited from the fall in the US dollar since 2003, insofar as the national currency is implicitly anchored to the US dollar.
This growth has led Vietnam to post the highest increase in world market share of all the Asian countries (Chart 3). It has tripled since 1995. Nevertheless, Vietnam remains a small exporter in global terms with just 0.3% of all world exports (as opposed to 1% for Thailand for example).
Chart 3: Growth in the market shares of Asian exporters (Base 100 = 1995) 0 50 100 150 200 250 300 1995 1997 1999 2001 2003 Vietnam China Philippines Korea Malaysia Thailand
Source: Chaponnière, Cling and Bin (2007) based on CEPII/Chelem.
At the same time, the structure of exports has changed enormously in recent years. Since 2002, manufactured goods have accounted for the majority of exports (Chart 4). These are mainly textile and apparel products, but also increasingly electronic products.
The level of 50% industrial exports in total exports was attained by the Philippines in 1984, China in 1986, Thailand and Malaysia in 1989, and Indonesia in 1995. The fact that Vietnam is an oil exporter (approximately 20% of total exports) tends to reduce its share of finished goods. Nevertheless, the share of crude oil exports is set to fall in coming years following current construction of several refineries to meet domestic consumption demand.
Chart 4: Share of manufactured goods in total exports (%)
0% 10% 20% 30% 40% 50% 60% 70% 80% 90% 100% 1985 1987 1989 1991 1993 1995 1997 1999 2001 2003 Taiwan South Korea China Philippines Malaysia Indonesia Vietnam Thailand
Source: Chaponnière, Cling and Bin (2007) based on CEPII/Chelem.
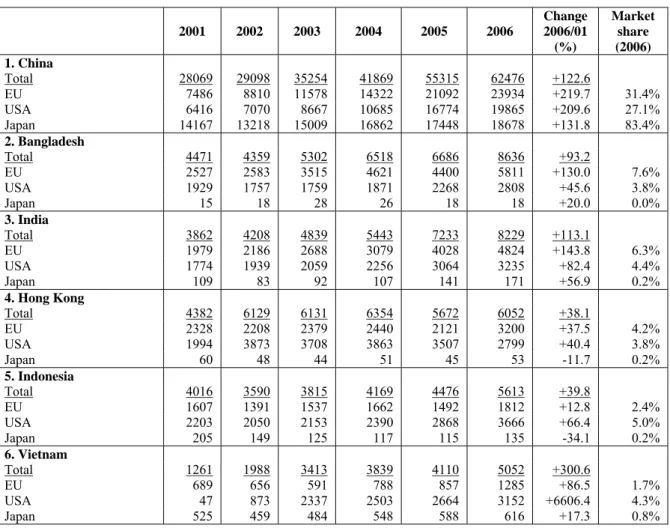
The structure of Vietnamese exports and the growing weight of textiles and apparel are characteristic of a developing country in the early stages of its industrialization process. Even before joining the WTO, Vietnam benefited from the EU’s lifting of quotas on textiles and apparel from Asian countries at the beginning of 2005. Despite competition from China, it has become the world number six exporter in these products3 (number five if Hong Kong is grouped together with China), with exports
quadrupling from 2001 (on the eve of the USBTA) to 2006 (Table 2). In 2007, the lifting of quotas still imposed by the United States will foster the continuation of, if not rise in this growth.
Table 2: Apparel exports from the leading suppliers to the EU, United States and Japan (millions of US dollars and %)
Sources: Chaponnière, Cling and Bin (2007) based on CEPII/Chelem.
Asia’s weight in trade
The geographic and sector-based structure of foreign trade varies quite a bit depending on whether the focus is on exports or imports, bearing in mind that, in both cases, Asia has a decisive share.
The United States (whose share is on the rise) and the European Union account for one-third of exports between the pair of them (Table 3), mainly in consumer goods (textiles and apparel in particular). However, these countries are in a modest position as suppliers to Vietnam.
Table 3: Geographic structure of foreign trade (2005)
Exports Imports Country/ Regional union Amount (bn USD) Weight (%) Country/ Regional union Amount (bn USD) Weight (%)
1. United States 5.9 18.2 1. ASEAN 9.3 25.2
2. ASEAN 5.7 17.6 - Singapore 4.5 12.2 - Singapore 1.6 4.9 - Thailand 2.4 6.5 - Malaysia 1.2 3.7 2. China 5.9 16.0 3. EU 5.5 17.0 3. Taiwan 4.3 11.7 - Germany 1.4 4.3 4. Japan 4.1 11.1 - United Kingdom 1.2 3.7 5. EU 2.6 7.1 4. Japan 5.2 13.8 - Germany 0.7 1.9 5. China 3.2 8.5 - France 0.5 1.4 Total 32.4 100.0 Total 36.8 100.0
Source: GSO; our own calculations.
2001 2002 2003 2004 2005 2006 Change 2006/01 (%) Market share (2006) 1. China Total 28069 29098 35254 41869 55315 62476 +122.6 EU 7486 8810 11578 14322 21092 23934 +219.7 31.4% USA 6416 7070 8667 10685 16774 19865 +209.6 27.1% Japan 14167 13218 15009 16862 17448 18678 +131.8 83.4% 2. Bangladesh Total 4471 4359 5302 6518 6686 8636 +93.2 EU 2527 2583 3515 4621 4400 5811 +130.0 7.6% USA 1929 1757 1759 1871 2268 2808 +45.6 3.8% Japan 15 18 28 26 18 18 +20.0 0.0% 3. India Total 3862 4208 4839 5443 7233 8229 +113.1 EU 1979 2186 2688 3079 4028 4824 +143.8 6.3% USA 1774 1939 2059 2256 3064 3235 +82.4 4.4% Japan 109 83 92 107 141 171 +56.9 0.2% 4. Hong Kong Total 4382 6129 6131 6354 5672 6052 +38.1 EU 2328 2208 2379 2440 2121 3200 +37.5 4.2% USA 1994 3873 3708 3863 3507 2799 +40.4 3.8% Japan 60 48 44 51 45 53 -11.7 0.2% 5. Indonesia Total 4016 3590 3815 4169 4476 5613 +39.8 EU 1607 1391 1537 1662 1492 1812 +12.8 2.4% USA 2203 2050 2153 2390 2868 3666 +66.4 5.0% Japan 205 149 125 117 115 135 -34.1 0.2% 6. Vietnam Total 1261 1988 3413 3839 4110 5052 +300.6 EU 689 656 591 788 857 1285 +86.5 1.7% USA 47 873 2337 2503 2664 3152 +6606.4 4.3% Japan 525 459 484 548 588 616 +17.3 0.8%
goods. Note that Vietnam does not yet take part to any real extent in the regional division of industrial labour, which is typified by sizeable trade in intermediate goods between China and its Asian partners, especially for electronic products.
1.3 The boom in foreign investment
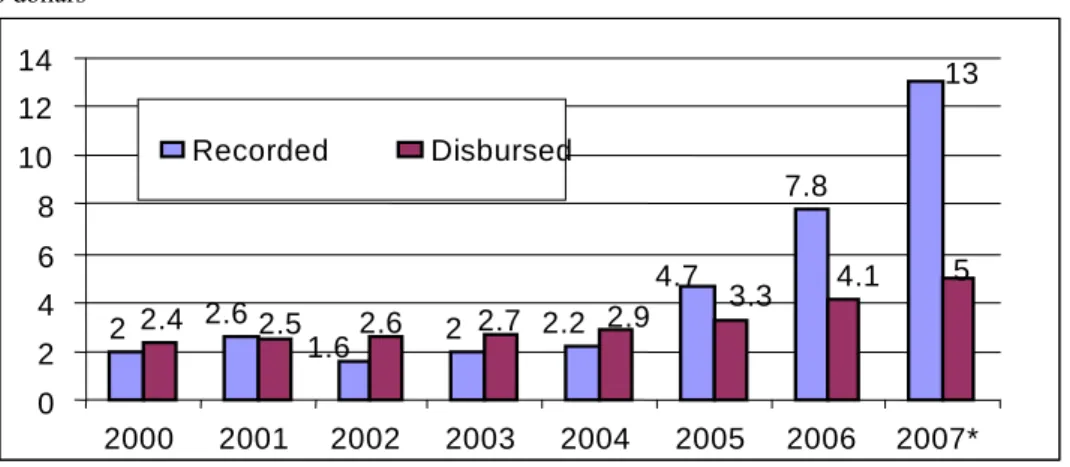
Although financial liberalization has been gradual and relatively modest, Vietnam has received considerable foreign direct investment inflows. FDI has shot up since 2005, nearing 15 billion US dollars in approved investment in 2007 (Chart 5). Direct investment inflows recorded in the balance of payments data came to some two billion US dollars per year through to 2005, the last year for which such data is available. They have probably also posted the same growth as the sum of investment projects.
The five leading investors, which are all Asian (Singapore, Taiwan, Japan, Korea and Hong Kong) account for nearly two-thirds of the investments made since 1988.
Chart 5: Annual total of foreign direct investment projects (2000-2007)
Billions of US dollars 7.8 13 4.7 2 2.2 2 2.6 1.6 2.6 5 2.4 2.5 2.7 2.9 3.3 4.1 0 2 4 6 8 10 12 14 2000 2001 2002 2003 2004 2005 2006 2007* Recorded Disbursed
Source: MPI; our own calculations.
*: Forecast
Interpretation of the chart: On average, approximately half of the planned investment (recorded) was actually disbursed, given that the implementation of the major projects is spread over a number of years. During a project growth period, the gap between recorded and disbursed investment automatically widens due to the implementation lead times.
Half of the investment is directed at the manufacturing industry (cumulative flows). The (offshore) oil sector has received slightly less than one-quarter of the investment inflows disbursed in recent years and the tourism sector is the third leading sector for substantial investment inflows.
The decisive contribution of foreign investment to exports
Firms with foreign holdings make a decisive contribution to export buoyancy (Table 4). They make the majority (56%) of total exports and 48% of exports excluding oil. All oil production and exports are in partnership with foreign oil groups.
Table 4: Share of foreign firms in exports in 2007*
(amount and growth rate)
Type of firm/sector Amount (millions of US dollars) Total Growth rate 2007/06 Domestic firms 20,086 43.8% 24.7%
Firms with foreign holdings 25,839 56.2% 15.9%
- Crude oil 7,594 16.5% -11.3%
- Others 18,245 39.7% 32.8%
Total exports 45,925 100.0% 19.6%
Total exports ex. crude oil 38,331 83.5% 25.6%
Source: MPI; our own calculations.
The country’s two leading economic regions attract nearly all the foreign investment
Foreign investment is highly concentrated geographically speaking (Table 5). Ho Chi Minh City and its surrounding area receive nearly two-thirds of all FDI while the Red River Delta (Hanoi and its region) receives over one-quarter. All in all, the country’s two leading economic regions attract some 90% of foreign investment whereas only 41% of the population lives in these regions. This concentration is behind some profound imbalances and a factor in the large flows of domestic migration by Vietnamese workers.
Table 5: Destination of foreign investment projects in Vietnam by province, excluding oil
(1988-2007)
% Projects Actual Population
HCMC and surrounding area 61.2 63.6 19.1
- South-East (HCMC) 58.7 60.2 15.3
- Mekong River Delta
(Long An + Tien Giang only) 2.5 3.4 3.8
Red River Delta 28.3 27.5 22.0
Total above 89.5 91.1 41.1
Rest of the country 10.5 8.9 58.9
Source: MPI; our own calculations.
1.4 WTO accession needs to be placed in context
In this section, we place Vietnam’s WTO accession in the context of the country’s economic performance in recent years and the social repercussions of this performance, along with the trade policies conducted since the launch of Doi Moi.
A retrospective study of national and regional socio-economic trends (poverty, inequalities, foreign investment, etc.) points up the areas in which the WTO may have had an impact. We endeavour to evaluate these areas in the following sections.
In particular, we can deduce from this study that the tariff-change repercussions of WTO accession will be reduced by the fact that a large part of Vietnam’s foreign trade is conducted with regional partners with whom it is associated in free trade areas already in operation (ASEAN) or being set up (China).
We can also observe that some of the effects of Vietnam’s WTO membership (negotiated over many years) were anticipated in part by the economic operators, as demonstrated in particular by the recent boom in foreign direct investment.
2 ANALYSIS OF VIETNAM’S TERMS OF ACCESSION TO THE WTO
In January 2007, Vietnam became the 150th member of the WTO after more than ten years of
negotiations (1995). The signing of a trade treaty with the United States in 2001 (USBTA or the United States-Vietnam Bilateral Trade Agreement) sped up the process by putting Vietnam on the road to trade and institutional reform as well as integration into the global economy.
Vietnam had to agree to a number of commitments (see the summarized list in Appendix A) on its accession. As with other recent WTO members, these commitments are often more restrictive than those made by the members when the organization was first set up (Marrakesh agreements, 1994). In particular, agricultural tariffs will be set at levels below those in force in other comparable developing countries. Vietnam also had to undertake to stop subsidising its exports (which the other comparable developing countries are still allowed to do), to open up more to foreign investment, but to also
In return, Vietnam has improved its access to WTO member markets and the quotas imposed on its textile and apparel exports were lifted at the beginning of 2007. Nevertheless, Vietnam’s access to the world’s leading markets (especially the United States and the EU), where it is still seen as a non-market economy (see Box 1 below), remains shaky.
2.1 A market increasingly open to imports
Since the 1990s, Vietnam has rapidly reduced its tariffs and abolished most of the import quotas. The additional WTO-related trade liberalization, spread over a long period (12 years), is therefore modest and gradual.
Sustained tariff reduction
Vietnam largely pre-empted its accession to the WTO with rapid tariff disarmament starting in the 1990s. For example, the average tariff (arithmetic mean) was cut to 17.4% on the eve of accession compared with 23.3% ten years earlier.
The effective protection rate4 fell even more quickly, as it more than halved from 59.5% in 1997 to
26.2% in 2001 (Athukorala, 2007). In industry, the effective protection rate dropped from 121.5% to 43.9%.
The average rate of tariffs is comparable with China before its accession. This rate is much higher than Indonesia, Malaysia and the Philippines. It is also much higher than China’s current average rate (World Bank, 2006).
Vietnam has committed to binding5 its tariffs on most products at rates of between 0% and 35% (Table
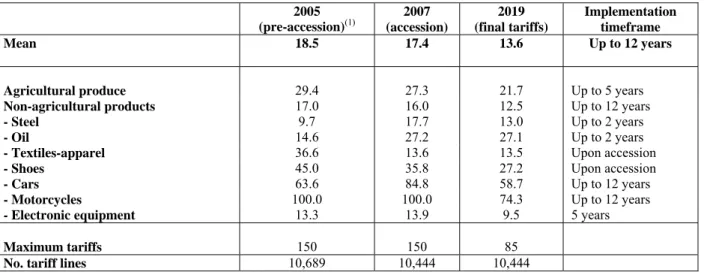
6). Tariffs on cars and motorcycles will remain higher, since Vietnam wants to protect the national industry (the car aspect only relates to assembly in small quantities). Certain sensitive products (eggs, tobacco, sugar and salt) will remain protected by quotas. Reductions on most of the bound rates, which will be reduced from 17.4% on average in 2007 to 13.6% in 2019, will be spread over a period of twelve years.
By and large, the average rate applied to agricultural produce will be brought down from 27.3% in early 2007 to 21.7% in 2019. This rate is lower than its neighbours: the average duties applied by Thailand and the Philippines to these products are 36% and 34% respectively.
Vietnam has signed the multilateral information technology agreement. Under the terms of this agreement, it undertakes to reduce its tariffs to zero on a number of electronic and IT products over a period of nought to eight years depending on the product.
4 The effective protection rate for a good is calculated as the sum of the rate of tariff protection applied to the good multiplied by the price for this good on the world market, from which is subtracted the protection rate applied to the intermediate goods incorporated into the production process, multiplied by the price for these goods on the world market.
Table 6: Tariff commitments made by Vietnam under the terms of its WTO accession (%) 2005 (pre-accession)(1) 2007 (accession) 2019 (final tariffs) Implementation timeframe Mean 18.5 17.4 13.6 Up to 12 years
Agricultural produce 29.4 27.3 21.7 Up to 5 years
Non-agricultural products 17.0 16.0 12.5 Up to 12 years
- Steel 9.7 17.7 13.0 Up to 2 years
- Oil 14.6 27.2 27.1 Up to 2 years
- Textiles-apparel 36.6 13.6 13.5 Upon accession
- Shoes 45.0 35.8 27.2 Upon accession
- Cars 63.6 84.8 58.7 Up to 12 years
- Motorcycles 100.0 100.0 74.3 Up to 12 years
- Electronic equipment 13.3 13.9 9.5 5 years
Maximum tariffs 150 150 85
No. tariff lines 10,689 10,444 10,444
Source: IMF (2007)
(1) Most-favoured-nation (MFN) tariffs applied to most of the countries excluding ASEAN.
Lastly, import quotas have been lifted on all but two products: since the end of 2005, only sugar and oil still have maximum import quotas imposed on them.
However, seven products are still subject to quotas without having an import ceiling placed on them: milk, eggs, maize, tobacco, salt and cotton. Higher tariffs are charged on these products when they exceed a certain amount of imports.
Abolition of tariff exemptions
The two main types of tariff exemption measures designed to foster exports or reduce imports will have to be abolished following accession since they are contrary to WTO rules.
Duty drawbacks: Before WTO accession, imports of intermediate inputs used to produce goods
intended for export were exempt from tariffs (the duty drawbacks system). The condition for tariff exemption was that the good had to be exported within 275 days of import of the duty-free products. This system designed to foster exports was particularly cumbersome and gave rise to many cases of defrauding (Dimaranan, 2005). It will have to be abolished following WTO accession because it constitutes a prohibited export subsidy (see below).
Localization ratios: In a number of business sectors (motor vehicles, mechanical products, and electric
and electronic products, including television sets), an implicit subsidy was granted in the form of a preferential duty on imports of finished products and components for firms that satisfied certain production localization ratios.
This type of mechanism previously found in other developing countries (e.g. South Africa for cars) is prohibited by the WTO. Vietnam has therefore abolished these advantages for motorcycles since 2003 and for cars since the beginning of 2007.
Export taxes remain
The WTO rules allow Vietnam to tax exports of products in which it does not have a dominant position on the world market. Vietnam justifies these taxes on the grounds of strategic considerations, protection of natural resources and the environment, and the will to promote exports of manufactured products.
These taxes concern in particular crude oil (5%), which represents some 20% of exports, and mining products. For example, in June 2007, Vietnam announced the introduction of new taxes on exports of copper ore (10%) and nickel (5%).
2.2 Other non-tariff measures
Tariffs aside, Vietnam has made some much more restrictive commitments than those set generally by WTO membership, especially as regards the abolition of export subsidies and opening up to foreign capital.
Prohibition of export subsidies
The Agreement on Subsidies and Countervailing Measures (ASCM) prohibits export subsidies on industrial products for countries whose per capita GDP is over 1,000 US dollars. Countries with a per capita GDP below this threshold are allowed to maintain these subsidies.
However, new WTO members are not entitled to this dispensation. Two countries with comparable development levels (in terms of per capita GDP), e.g. Vietnam and India, therefore have totally different leeway in this area: the former is prohibited from having any subsidies while the latter, despite its far superior size and hence potential impact on international trade, is entirely free to grant such subsidies.
In the case of Vietnam, this prohibition will force it to change its export processing zone system, which currently employs hundreds of thousands of workers (no accurate evaluation of their numbers has been published by the authorities). The benefits granted in these zones will therefore no longer be able to linked to the businesses’ export rates.
Likewise, Vietnam has had to undertake not to subsidise its agricultural exports. Cambodia also had to make this commitment when it joined in late 2003. This prohibition sets up blatant discrimination against these two new member countries, since the leading industrial countries continue to massively subsidise their agricultural exports.
Even though export subsidies are prohibited, Vietnam can continue, as a developing country, to subsidise its agricultural production provided that the rate of subsidies is less than 10% of the amount of the production of any given product. In practice, only subsidies on sugar production might have to be reduced pursuant to this rule (ADB et al., 2006).
Extensive reform of the commercial and legal framework
In preparation for its accession to the WTO, Vietnam has substantially rewritten its commercial legislation and legal procedures in recent years. The legislative framework applicable to contracts, property rights and the settlement of trade disputes has hence been considerably simplified and modernized (ADB et al., 2006).
Moreover, in joining the WTO, Vietnam has undertaken to give foreign businesses the same treatment as its national businesses (national treatment principle). A new business law was therefore passed in 2005 to apply the same regulatory framework to national (public and private) and foreign firms. One of the consequences of the national treatment principle is that it becomes impossible for the government to continue subsidising domestic businesses. These subsidies currently take a wide range of forms (soft loans, export credits, etc.). In future, all of these aids will have to be granted on a non-discriminatory basis to all businesses, including foreign firms.
For the same reasons, state-owned companies will have to put out contracts for tender to all businesses regardless of their nationality (domestic or foreign) and award these contracts on purely commercial grounds.
Following its WTO accession, Vietnam also has to apply the agreements on intellectual property (TRIPS) bearing in mind that it already had to apply the bulk of these agreements to American businesses under the USBTA. Lastly, it has to immediately apply the agreements on sanitary and phytosanitary measures (SPS) and on technical barriers to trade (TBT).
More open to foreign investment
The foreign direct investment measures taken are in keeping with the TRIMs (Trade-Related Investment Measures) agreement.
Since Vietnam’s accession to the WTO at the beginning of 2007, foreign banks can have 100%-owned subsidiaries in the country (the extent of this opening up should be kept in perspective in that the USBTA already provided for 100%-subsidiaries of American firms to be authorized by 2010). However, this measure will probably speed up the restructuring of the public banks.
In telecommunications, American companies have been entitled under the terms of the USBTA to enter the mobile telephone and Internet market since late 2005 and the fixed telephony market since late 2007. All foreign businesses now benefit from this entitlement. The maximum stake in these firms has been set at 49% and 45% respectively.
Continued privatization
The policy to privatize state-owned companies (equitization) was launched in the 1990s. A number of large corporations have already been privatized (Viet Nam Dairy Products Company or VINAMILK, Song Hinh-Vinh Son Hydroelectric Plant and Ho Chi Minh City Insurance) and Vietnam has announced that only companies in strategic sectors and a few very large corporations will remain in the State fold (i.e. 100% owned) in the long run. Some 600 new privatizations of state-owned companies are planned for 2007 and 2008, including large corporations such as Mobiphone, Vinaphone and the Vietcom Bank (Gide, Loyrette and Nouel, 2007). The partial privatization of the national airline (Vietnam Airlines) and a number of banks has also been announced. Foreign investors will be able to take a hand in these privatizations (conducted by floating the firms in question on the stock market). Foreign investment in the banking sector will remain more controlled than in the other sectors.
Although the commitments made in this area are different in nature to the others (they are relatively vague), Vietnam has nonetheless undertaken to send the member countries an annual progress report on its privatization programme every year. This policy is therefore largely consistent with the aim to gain recognition as a market economy from the other countries (see 2.3 below).
2.3 Access to the leading markets is still insecure despite the lifting of export quotas
Lifting of export quotas on the American and European markets
One of the main gains of WTO membership for Vietnam is found in the lifting of the quotas imposed by the leading industrialized countries on its textile and apparel exports.
Since its accession, Vietnam has benefited from the new multilateral framework for textiles and the lifting of three decades of quotas imposed by the Multifibre Arrangement (MFA) in early 2005:
- The United States had imposed quotas under the terms of the USBTA, which the country lifted at the beginning of 2007;
- The EU pre-empted WTO membership and lifted the quotas on Vietnamese products at the beginning of 2005 following the signing of the bilateral agreement prior to accession (2004).
Moreover, Vietnam (which is smaller and so inevitably has less of an impact on the American market) did not have the same level of safeguard measures and textile-specific measures imposed on it as those that the United States temporarily imposed on China when it entered the WTO.6
Access to the American and European markets is still insecure
Vietnam joined the WTO with special non-market economy (NME) status (see Box 1). In imposing this discriminatory status (also imposed on China when it joined in 2001) on this country for a period of twelve years (through to 2019), the WTO has undermined access to the international markets for Vietnam’s exports. The thing is that this status implies the use of a special methodology to assess antidumping cases (costs are evaluated on the basis of other countries’ costs), which considerably reduces the burden of proof (Oxfam, 2004). Vietnam has therefore entered the WTO as a “second class” member, like China (McCarty and Kalapesi, 2003).
NME status therefore considerably reduces one of the main advantages of WTO membership, that is the chances of winning a case brought before the dispute settlement body should Vietnam have antidumping measures imposed on it by one of its trading partners (ADB et al. 2006).7
The United States has also granted temporary most-favoured-nation (MFN) status to Vietnam. Congress has still not passed Permanent Normal Trade Relation status (its last vote on this subject in November 2006 came down against the motion). So this status must be renewed yearly, which is allowed under WTO rules. Article XXXV of the GATT (and XIII of the WTO) entitles a member country to refrain from meeting its multilateral obligations towards a new member for political or other reasons. In the American case, the grounds put forward are that Vietnam prevents its citizens from emigrating (Jackson Vanik amendment blocking the normalization of trade relations with Communist countries).8
Box 1: Non-market economy (NME) status
At the request of the United States, Vietnam was given non-market economy status when it joined the WTO. This was also the case for China when it joined in 2001 (status still in force to date). In addition to these two countries, only a couple of former republics of the ex-Soviet Union (Kyrgyzstan and Moldavia) also have this status.
This status means that a member country can evaluate the production costs for a product exported to its market by the NME country based not on an observation of the costs in effect in this latter country, but in one or more “substitute” countries of its choice where market rules are deemed to effectively apply. It is therefore relatively easy for a country that wishes to apply antidumping measures to an NME country to prove the existence of dumping, since all you have to do is find the suitable substitute country even if the level of development and production conditions in the country are totally incomparable with the initial country (Nguyen, Nguyen and Le Thanh, 2007).
Since China’s accession to the WTO, the number of antidumping actions brought against it has virtually doubled: to some 40 per year from 2002 to 2005 compared with around 20 in the years immediately preceding accession (1995-2001). Obviously, this surge cannot be put down entirely to NME status, since the boom in Chinese exports inevitably creates friction, but it has been fostered by this status since the country applying these measures stands little chance of having its case dismissed by the WTO should the Chinese complain.
When the EU imposed antidumping measures on shoe exports from Vietnam in 2006 (before its accession to the WTO), it applied NME status to this country.9 The EU has been applying antidumping tariffs at a rate of 16.8%
since this date on the basis of a comparison with production costs in Brazil. The result has been a sharp drop in Vietnamese exports.
6 Safeguard measures can be applied to any product to block the growth of imports in the product if this growth is deemed too sharp and likely to disrupt the domestic market. Textile-specific measures go further: they block imports (and not just growth) of textiles and apparel for a certain amount of time in the event of market disruption.
7 In 2004, the United States slapped antidumping measures on Vietnamese exports of catfish before the country joined the WTO. Non-market economy status reduces Vietnam’s chances of winning this case at the WTO.
8 Conversely, Vietnam is not bound to grant the same market opening concessions to the Americans as those it grants to other partners (should the USA withdraw MFN status from Vietnam).
Nevertheless, the WTO member countries (or at least some of them) could consider that Vietnam has become a market economy before the end of the given timeframe (2019). In 2007, the member countries of ASEAN (of which Vietnam is part) decided to grant Vietnam market economy status (and therefore undertake to refrain from applying different antidumping rules). Similarly, a partner country of Vietnam can choose to apply market economy status to just one economic sector (rather than the entire economy).
The vagueness of the definition of NME status, the discretionary manner in which it is ascribed and the arbitrary nature of the burden of proof to justify the introduction of antidumping measures all make the status a potentially damaging weapon against the Vietnamese economy. In particular, Vietnam’s partner countries can use it for economic reasons that have little to do with the principles of healthy competition and it can even be used for political motives. It would be advisable for Vietnam to endeavour to shake off this marked source of uncertainty as soon as possible.
The main effect of this measure taken by the United States has been to increase Vietnam’s vulnerability vis-à-vis the United States and the uncertainty surrounding its access to the American market (whereas one of the main aims of WTO membership is to secure this access), especially given that the country set up a mechanism in 2007 to monitor textile and apparel imports from Vietnam. The anti-dumping measures applied by the EU to Vietnamese shoes in 2006 and the introduction by the USA of an import monitoring programme for Vietnamese textiles and apparel show that the world’s two leading trade powers have placed Vietnam under observation and that its performances on the European and American markets could be put in issue at any moment.
2.4 The WTO accession agreement affects all the economic sectors
Our analysis of Vietnam’s WTO accession agreement first shows that this membership is not an isolated event triggering sweeping changes to the economic and trade policies conducted by this country, but is part of a long process underway for over a decade. Our description of the main commitments made by the country then points to a few avenues that could be explored to determine the main elements to be taken into consideration to evaluate the impact of this accession.
Firstly, as regards trade in goods, the WTO’s impact on tariffs has been modest overall insofar as the tariff protection rates have been gradually reduced to relatively low levels in recent decades. Most of the studies on trade liberalization (in both Vietnam and other countries) evaluate solely the impact of this tariff reduction. Yet the lifting of customs quotas (especially on the American market) is an important event, albeit hard to model, especially since the non-market economy status imposed on Vietnam permanently places a “sword of Damocles” over its access to the leading international markets.
Secondly, most of the reforms conducted for WTO accession actually concern essentially aspects other than the liberalization of trade in goods. In particular, the (already observable) positive effects of service liberalization (telecommunications, banks, etc.) on attracting foreign direct investment will combine with the positive effects of the new competition and foreign investment laws, the privatization of state-owned companies and improved market access for Vietnamese exporters. Unfortunately, the effect of these measures is much harder to evaluate using the usual tools.
All in all, there is a huge difference between the relative importance to Vietnam of the different parts of the WTO agreement (most of the commitments and impacts concern services, investments and other norms) and the variables usually introduced into the models as exogenous variables for the simulations, centred on changes in tariff protection. This discrepancy reduces the value of the studies that only consider this latter element. As we shall see in the following sections, we will endeavour to extend our scenarios to other effects that might be expected from accession.
3 IMPACTS OF VIETNAM’S ACCESSION TO THE WTO: A REVIEW OF RECENT LITERATURE
Following the transition of all the developing countries to export-based growth policies as promoted by the international institutions and the creation of the WTO (1995), many studies have sought to evaluate the impact of trade policies on growth and income distribution.
This section starts with a presentation of some of the general conclusions drawn by these studies and compares them with the findings of economic theory and empirical observation. It then conducts a critical review of the studies of Vietnam, focusing on those that use computable general equilibrium (CGE) models, which are ostensibly the most suitable for evaluating the macroeconomic impacts of trade policies. In addition to the findings regarding the main economic aggregates and growth, particular attention will be paid to distributional effects (poverty and inequalities).
As is generally the case for this kind of study on other developing countries10, evaluations to date of
the overall impact of Vietnam’s WTO membership on growth (GDP, exports, etc.) find relatively modest effects. This is because it is hard for the models used to cover all the effects. In particular, the estimates only cover the impact of trade liberalization on goods, whereas the main effects are often found in other areas (services, FDI, institutional reform, etc.). Consequently, the evaluations of distributional effects and the effect on poverty also find a relatively small impact, generally along the lines of an increase in inequalities and a reduction in poverty.
3.1 The impact of the WTO on growth, poverty and inequalities
Since the 1990s, a large body of economic literature has explored the impact of trade liberalization on the developing countries. Many studies have set out to evaluate the economic impact of tariff liberalization, whether in relation to the WTO (multilateral) or in other contexts (unilateral liberalization, regional liberalization, etc.). In the most recent period and given the new poverty reduction focus of development policies, these studies have extended their coverage to evaluating the distributional impact and effect of trade policies on poverty.
The macroeconomic impact (growth and trade)
Virtually all the studies use CGE models to evaluate the macroeconomic impact of WTO accession. To our knowledge, only two studies have used an alternative method based on gravity models (see Box 2).
Box 2: Gravity models and computable general equilibrium models in the evaluation of trade policies
Gravity models are econometric models used to explain the intensity of trade between two countries and, by extension, the extent of trade by a given country with all its partners.
The principle of gravity models is based on the theory of gravity. By analogy with Newton’s law, these models state that the intensity of trade between two countries depends on the relative size of their economies (generally measured by GDP) and is negatively linked to the transaction costs between them. These costs are generally estimated by the distance between the countries, to which are added other factors (landlocked status, insularity, existence of a border between the two countries, etc.). This corresponds to the assumption that trade costs increase with distance; that a country’s landlocked status increases its transaction costs and that, conversely, this cost is reduced for two neighbouring countries. These specifications are econometrically parameterized.
Gravity models are frequently used to evaluate the impact of free trade agreements and, more recently, to study the impact of WTO membership on a given country’s foreign trade. This is because, among other things, these models have considerable power to explain bilateral trade flows.
10 With the exception of studies that include ad-hoc hypotheses of the effects of the trade policies on productivity and growth, which in effect magnify the impact of these policies.
Computable general equilibrium (CGE) models are non-econometric models representing a country’s economy. They are based on the assumption of rational optimising behaviour by economic agents, which underlies Walras’ general equilibrium theory. This theory (termed “neoclassical”) states that households optimise their utility under the constraint of income and businesses maximise their profits.
To take the case of households, households are considered to be both consumers and owners of production factors (labour, capital, etc.). Household income is used to consume, which procures them utility. The CGE models are based on the assumption of “representative agents” (households and businesses). This assumption posits that all households have identical characteristics (at least within a given group such as skilled workers) in terms of utility function and factor endowments.
The CGE models are based on two types of data: 1/ a social accounting matrix (SAM) drawing on the country’s national accounts, which provides an accounts-based representation of interactions between sectors and economic agents. Each sector of the economy is assigned a row (as a receiver of income) and a column (as a source of expenditure); 2/ the agents’ behaviour functions (e.g. consumption function), for which the parameters are calibrated.
The simplifying assumptions underlying the CGE models have been gradually lifted as modelling and economic theory have moved forwards:
- Whereas all the models were initially static, the dynamic dimension has gradually been introduced;
- The assumption of perfect competition no longer applies to all transactions and economic sectors; in particular, the existence of export and import functions is based on the assumption of differentiation of internationally traded products and imperfect competition;
- Lastly, the representative agent assumption does not really allow for the distributional impact of a shock to be evaluated; the households therefore need to be differentiated, which is the purpose of the micro-simulation models in which each household is considered individually.
The CGE models are the most frequently used tool for evaluating the impact of economic policies (and trade policies in particular). Their advantage is that they provide a precise quantitative answer regarding the impact of a policy change while ensuring that the results are consistent from a theoretical point of view.
Source: Piermartini and Teh (2005)
The first study (Frankel and Rose, 2002) concludes that once gravity effects are taken into account, there is no significant additional effect on trade due to WTO membership (except where fixed country effects are introduced to take into account the unique characteristics of each country). The second study (Subramanian and Wei, 2003) estimates the same type of model and comes to quite the opposite conclusion, that is that WTO membership generates some 30% more trade for new members, with a more modest impact for the poorest developing countries.
Nevertheless, there are two major drawbacks to using gravity models: 1) there is no underlying theoretical model, and 2) they cannot evaluate the impact of the WTO on a given country. Lastly, gravity models can be used to measure ex post the deviation between actual observation and the model’s predictions, which can be attributed under certain assumptions to the WTO effect, but cannot predict this impact ex ante (which is precisely what we want to do here with Vietnam). The rest of this section will therefore present a critique of the studies using CGE models, which are also in the majority.
The computable general equilibrium (CGE) models are largely used to evaluate the impact of multilateral trade agreements concluded under the WTO, unilateral trade liberalization policies and regional agreements. Note, however, that these models focus on analyzing the effects of trade liberalization measures applied upon WTO accession. They rarely consider other types of measures flanking this accession (such as changes in the legislative and regulatory framework governing the business environment), which are much more complicated to model.
Unlike economic studies that seek to demonstrate empirical relations based on regularities observed in the past (see, for example, the case of the gravity models), the CGE models with their neoclassical
Given these characteristics, these models are useful more from the point of view of revealing the mechanisms at work than putting a precise figure to the impact of economic policy decisions. They are used (give or take a few rare exceptions) to simulate ex ante the impact of the trade policy measures and not to explain ex post the impact of these policies in the past.
Most of the CGE models are based on assumptions of perfect competition on the goods and factor markets, constant returns to scale, full factor employment, and perfect labour mobility from one sector to another. Two types of simulations (or scenarios) are most frequently put forward using these models (excluding regional trade policies, which are not covered by our study), bearing in mind that a country’s accession to the WTO combines, to a certain extent, both these effects.
The impact of multilateral liberalization (of the Doha Round type) is evaluated using multinational
models. The reduction or abolition of tariffs worldwide on a given product results in an increase in world trade in this product. This represents a global income gain, due to the increased efficiency of factor use in each country and the additional purchasing power associated with the consumption of cheaper goods (conclusion when using a Hecksher-Ohlin model). In each country, the relatively most abundant factor will gain from the trade (increase in its remuneration due to greater demand for the factor) and the relatively least abundant factor will lose out.
All the countries share the net gain secured from the improved factor use worldwide, although variations in the terms of trade (ratio of export prices to import prices) in each country can increase or reduce this gain. The transfer effect of these terms of trade variations is zero worldwide.
GTAP (Global Trade Analysis Project) is the world leader in this kind of work.11 The World Bank
makes an evaluation every year of the gains to be expected from a WTO agreement based on the trade protection data supplied by GTAP. For example, according to the World Bank’s estimates (2005), a full trade liberalization agreement (lifting of tariffs and quotas on all merchandise along with the abolition of agricultural subsidies) signed under the Doha Round would generate a global gain of 1.2% of national income for the developing countries by 2015 (0.8% for the entire world economy), albeit distributed highly unevenly among the countries.
The impact of unilateral liberalization (of the structural adjustment programme type) conducted in a
single country is evaluated using national models. In the case of a small country (price taker, i.e. which has no influence on world prices, but for which these prices are exogenous), unilateral liberalization is always positive in terms of the country’s total income; it reduces the distortions due to the existence of tariffs and hence improves productive efficiency.
Whatever the scenario envisaged, these models find modest effects (gains or losses) on each country, totalling a few GDP points at most in terms of level (Cling, 2006). Empirical observation of the link between trade policies and growth (country studies) also suggests that the effect is indeed modest in most cases, in keeping with the findings of the CGE models. There is a relative consensus among economists these days that the effect of the trade policies has been overestimated compared with the effect of other types of policy and other economic factors (World Bank, 2005) and that unilateral or multilateral liberalization has sometimes had negative effects on certain countries (African LDCs in particular).
Having said this, there are two main reasons why the CGE models find such modest effects, based on to their failure to take into account all the possible impacts of the policies: their oversimplified specification and the difficulty of putting accurate figures to the WTO agreements over and above the liberalization of trade in goods. In certain cases, improving the realism of the model specifications and simulation scenarios produces findings of much greater trade policy impacts. In addition to scientific considerations, this honing work also satisfies the concern to better substantiate the grounds for this type of policy and satisfies academic considerations (obtain significant findings).
Concretely and as regards the CGE models,12 these exercises relax the usual simplified assumptions: assumptions of imperfect competition and growing returns, externalities (technology transfers) derived from growth in trade with a productivity surplus; introduction of unemployment and underemployment; direct investment surplus assumptions, etc. Most of these assumptions are largely
ad hoc. Robinson and Thierfelder (2002) called this amplification process “the quest for large numbers” (title of their paper).
Most of the CGE models are static, i.e. they only cover one time period. One particular upshot of this is that productive capital is fixed and hence that investment affects demand, but not the productive supply. In recent years, there has been a move to build dynamic models; in these models, agents reason in an intertemporal manner; the investment decision in each period is made based on the expected return for all the coming periods; productive capital varies in line with investment and equipment obsolescence.
Dynamic models such as the CEPII multinational Mirage model (Bchir et al., 2002) incorporate the effects of trade policies on growth. Nevertheless, consideration of these effects is handicapped by the gaps in our theoretical and empirical knowledge of the openness-growth link (Cling, 2006).
All in all, despite their growing sophistication (consideration of the dynamic aspect and imperfect competition, etc.) and their heuristic value, the findings of CGE models are ultimately not very robust. These models approximate the effects of economic policy measures based on given assumptions. Moreover, since they fail to take into account the dynamics in their entirety and the adjustment costs, these models essentially analyze the long run, the paradox being that long-run mechanisms (e.g. the impact of openness on direct investment) are very hard to incorporate into the models.
The impact on inequalities and poverty
Analysis of the impact of trade liberalization on inequalities and poverty is a very recent field of research. Standard economic theory on international trade provides a model of income distribution trends following the development of trade. In the simplest set-up (Heckscher-Ohlin model), demand for the most abundant production factors increases and their relative remuneration rises (Stolper-Samuelson theorem) with growth in trade. So a developing country with abundant unskilled labour (and with less abundant skilled labour) would be expected to post a simultaneous reduction in inequalities and poverty.
The direct relation between trade and poverty is of interest only at the bottom of the income distribution. A trade liberalization measure (e.g. imported rice tariff reduction) could have a direct effect on the poor in a static approach (positive effect for consumers due to a drop in prices or negative effect for farmers due to a drop in their selling prices in addition to an impact on factor demand). Yet this measure could also have dynamic effects. For example, where openness has a positive impact on growth you would expect to find a downturn in poverty. Yet this impact depends on any change there may be in inequalities and their level, given that an upturn in inequalities can increase poverty (called “impoverishing” growth) and that, for example, a high level of inequalities reduces the elasticity of poverty to growth (Bourguignon, 2003; Cling et al., 2004). We are therefore faced with potentially contradictory effects whose outcome is hard to determine.
The general equilibrium analyses simultaneously evaluate the impact of the effects (prices of goods and factors, central government revenue and expenditure, and effects on investment and growth in the case of dynamic models) while considering the agents’ response to these shocks. The CGE models used to evaluate the overall impact of trade liberalization (see Box 2 above) can also be used to evaluate its impact in terms of poverty and inequalities, provided that the households are sufficiently detailed by type and level of income.
The macro-micro model approach takes things a step further since it disaggregates all the households (hence relaxing the representative agent assumption) and models their behaviour at individual level