DOCUMENT DE RECHERCHE
EPEE
CENTRE D
’E
TUDES DESP
OLITIQUESE
CONOMIQUES DE L’
UNIVERSITE D’E
VRYDoes environmental regulation create merger incentives?
A. CRETI and M.-E. SANIN
16-07
Does environmental regulation create merger
incentives?
Anna CRETI and María-Eugenia SANIN
yJune 2016
Abstract
This paper studies merger incentives for polluting Cournot …rms under a competitive tradable emission permits market. Such setting is relevant to assess the observed mergers between power generators in the Regional Greenhause Gas Initiative (RGGI) allowing us to derive policy recommendations. We …nd that when …rms are symmetric and marginal costs are constant, an horizontal merger that generates e¢ciency gains is welfare enhancing, but e¢ciency gains must be high enough with respect to the case without permits markets for the merger to take place. Secondly, the presence of a competitive (or monopolistic) outside market that also trades in the permits market makes pro…table a merger that would not happen otherwise. When …rms are vertically related in an input-output chain, an horizontal merger in one of the markets increases pro…ts in that market and in the other market due to the decrease in permits price. Finally we consider an oligopoly-fringe model in which …rms di¤er both in their marginal costs of production and in their pollution intensity. A merger between the oligopolistic …rms decreases permits price and is always pro…table as opposed to the symmetric Cournot case in which there is a critical size for pro…tability.
JEL Classi…cations: L13, L41, Q51
Key words: mergers, environmental externality, tradable emission permits, social welfare, Cournot competition.
1
Introduction
Many papers have analyzed welfare consequences of horizontal mergers in the presence of imperfect competition (see Motta, 2004 for a complete mapping of the literature). How mergers incentives and welfare properties are modi…ed in the presence of an environmental externality, regulated by tradable emission permits, is a less explored issue. The paper closest to our analysis is Hennessy and Roosen (1999), who show that; in a perfectly competitive industry, incentives coming from the permits market may motivate a merger that wouldn’t take place otherwise. The last section of Hennessy and Roosen’s paper brie‡y mentions how the previous result could be modi…ed under Cournot competition in the output market, suggesting that it is ambiguous. We study in depth which are the mechanisms behind that ambiguity and its welfare implications. With this purpose we consider symmetric …rms that
Dauphine University and Ecole Polytechnique, Paris, France.
compete à la Cournot in a polluting industry subject to an environmental regulation based on a perfectly competitive market for permits.
The previous con…guration is a good representation to understand the mergers occurred in the power sector who’s CO2 emissions are regulated by the Regional Greenhouse Gas Initiative’s (RGGI) market. The RGGI only covers emissions from the power sector in 9 States of the Unites States of America1 as from January 2009. Several mergers in the power industry have occurred in the RGGI region since then. In the Dealbook of the New York Times2 an article of June 16th, 2011 cites Todd A. Shipman, a credit analyst of utilities and infrastructure ratings at Standard & Poor’s, saying that the number of publicly traded energy companies is dramatically shrinking, being the environmental regulation one of the reasons behind that trend. In particular he says: “Utilities — facing pending regulation on greenhouse gas emissions and renewed enforcement of older rules on air pollution — must reckon with the rising costs of compliance. The added expense come just as growth in electricity demand is being crimped by e¢ciency gains.” Additionally, important mergers among power …rms have been documented during 2014, the year in which the price in the RGGI market has dramatically increased due to a reduction in the cap imposed by regulation (See Section 5.1.). This phenomenon could also be present in markets for Green and White certi…cates where few players from related sectors participate and eventually even in the European system for tradable permits (EU-ETS) where several big mergers have occurred in the power sector (See Section 5.2.). These stylized facts and experts’ opinion advocate for the relevance of our analysis.
Our main …ndings are that in a symmetric Cournot an horizontal merger: (i) with constant marginal costs, is welfare neutral since the decrease in the regulator’s revenue due to the resulting decrease in permits price is earned by …rms; (ii) if it generates e¢ciency gains for the merged …rms, it is welfare enhancing but e¢ciency gains must be high enough for the merger to take place;3(iii) we derive some conditions under which a merger becomes pro…table in the presence of a perfectly competitive (or monopolistic) outside output market that also participates in the permits market. This last result is particularly relevant to understand how the occurrence of mergers in some sectors may be a¤ected by tradable permits.
Some papers are worth mentioning to put the previous results in perspective. In line with our …rst result, Ehrhart et al. (2008) show that loopholes of the EU-ETS law fosters tacit collusion in oligopolistic Cournot markets. Canton et al. (2012) model mergers that generate cost reductions and consequently an increase in production which is welfare enhancing even if it increases pollution. Similarly Lambertini and Tampieri (2014) model cost reducing mergers …nding that the negative e¤ect that a merger has on consumer surplus is more than o¤set by both the raise in industry pro…ts and the fall in pollution. The fact that we consider permits market in which the pollution level is …xed by the cap explains the di¤erence between their results and ours. Additionally, Canton et al. (2012) …nd that the stringency of environmental policy increases the minimal size for merger pro…tability. Such dependence is in fact in line with our second result.
Regarding an input-output structure where both the input and the output market are 1Those states are Connecticut, Delaware, Maine, Maryland, Massachusetts, New Hampshire, New York, Rhode Island and Vermont.
2See http://dealbook.nytimes.com/2011/06/16/utilities-turn-to-mergers-as-demand-for-power-wanes/?_php=true&_type=blogs&_r=0
subject to the cap-and-trade regulation, we …nd that an horizontal merger in one of the markets increases pro…ts in that market and in the linked one due to the decrease in the permits price resulting from the merger. This input-output structure is particularly relevant to understand merger incentives in the power sector. Finally we consider an oligopoly-fringe model in which …rms di¤er both in their marginal costs of production and in their pollution intensity. We …nd that a merger between the oligopolistic …rms decreases permits price and is always pro…table as opposed to the symmetric Cournot case in which there is a critical size for pro…tability as mentioned before.
The paper is organized as follows. In Section 2 we present our benchmark model where we account for the impact of an horizontal merger. We develop …rst the case of symmetric …rms with constant marginal costs before and after the merger, and second the case where the merger generates e¢ciency gains. In Section 3 we analyze the pro…tability of an horizontal merger in the case where several sectors are subject to the market for permits. In particular, in Subsection 3.1 we consider the case where two di¤erent sectors belong to the same permit market and, in Subsection 3.2, the case in which the two sectors subjects to environmental regulation are vertically related (either downstream or upstream). In Section 4 we relax the assumption of symmetric …rms before the merger by analyzing a case with an oligopolistic dominant group of …rms and a competitive fringe. Finally, in Section 5 we analyze the extent to which our results could be applied to understand merger incentives in the power sector under the RGGI market and eventually in the EU-ETS market. In Section 6 we conclude and derive some policy implications.
2
The importance of e¢ciency gains
Consider a market for a product where the inverse demand function for a quantity Q 0 is given by P (Q). Assume that P0(Q) < 0; P00(:) 0 or P00(:) 0 not too large for all Q. N symmetric …rms compete à la Cournot in this market. The production technology exhibits constant returns to scale and c denotes the marginal cost of production.
Production generates pollution: for each unit of the good > 0 units of a pollutant are emitted. Pollution is socially costly and that …rms are required to buy as many pollution permits as their individual emissions. Assume also that the total number of pollution permits E > 0 supplied by the authority is …xed. Our main assumptions relate to the functioning of tradable pollution permits.
Assumption 1. The market for pollution permits is perfectly competitive.
Assumption 1 implies that …rms have no market power on the permits market. Therefore, the equilibrium price for permits is such that the total demand for permits, Q, equals the total supply of permits, E.
The previous assumption can be justi…ed by the fact that the environmental regulation covers many states in the case of the RGGI and also many sectors in the case of the EU-ETS. This assumption is quite usual in environmental literature (see for example, Sartzetakis, 2004). We focus on the interesting case in which the environmental regulation e¤ectively con-strains …rms’ decisions, i.e., > 0. A su¢cient condition for this to be the case is that the total supply of permits is smaller than the total pollution that would be generated by a hypothetical monopolist:
Assumption 2. De…ne Qm= arg maxQ [P (Q) c] Q. The total supply of permits E is such
that E Qm.
This assumption ensures that is positive after a merger of any size.
We consider a game in which …rms choose their production levels of the …nal good and the market for permits clears simultaneously.
An horizontal merger. Let us derive the conditions under which a merger is pro…table, from a private and a social point of view.
In the absence of merger, …rm i solves the following problem: max
qi 0
[P (Q) c ] qi;
where Q = PNi=1qi. Indeed, for each unit of the …nal good produced, …rm i emits qi units of pollution that must be covered with permits. Consider an interior solution of the previous optimization problem in which …rm i’s quantity is characterized by the corresponding …rst-order condition:
P0(Q)qi+ P (Q) c = 0: (1)
Equation (1) is su¢cient provided that the demand is concave or not too convex, which holds under our assumptions.
An equilibrium of the game is a production pro…le fqigi=1;:::;N and a permits price such that, for each …rm i = 1; :::; N , Equation (1) is satis…ed and the permits market clears, i.e.:
Q = E: (2)
The crucial feature implied by the market clearing condition (2) on the permits market is that the total quantity of good produced only depends on the exogenous supply of permits E and the pollution factor . Using Equations (1) and (2), the pro…t of each …rm at the symmetric equilibrium is given by:
pre= P0
E 1
N2
E 2
: (3)
Suppose now that M …rms, 0 M N , decide to merge. Since …rms have the same
constant marginal cost, such a merger reduces the number of …rms from N to N M + 1.
The pro…t of each …rm at the symmetric equilibrium is thus given by:
post= P0
E 1
(N M + 1)2
E 2
:
Denote by post pre the di¤erence between the permits price before and after the
merger. Using the …rst-order conditions in Equation (1), we obtain:
= P0 E E
2
M 1
N (N M + 1) < 0: (4)
to the sale of permits exactly corresponds to the change in the industry´s pro…t ( post pre):
= E > 0: (5)
Our results from a welfare perspective can be summarized as follows.
Proposition 1. In a symmetric Cournot case with constant marginal costs, any merger is welfare neutral and does not a¤ect consumers surplus. The permits price decreases, which implies that the regulator´s revenue from permits sales is redistributed to …rms.
Proof. See Appendix.
For the merger to take place, M needs to satisfy the following condition.
Condition 1 In a symmetric Cournot case with constant marginal costs, a merger of M …rms is pro…table if and only if:
1
(N M + 1)2
M
N2: (6)
This condition holds for any demand function and is similar to the one derived by Salant et al. (1983) who looks at the pro…tability of a merger in a constant marginal cost and symmetric Cournot oligopoly with a linear demand function. A discussion on whether the previous condition is more or less restrictive than in the case where there is no market for permits is provided in the Appendix. In particular, we …nd that if demand is linear, the permits market relaxes the pro…tability condition of mergers.
E¢ciency gains. Assume that the merger creates e¢ciency gains, that is, after the merger takes place the participants have a lower marginal production cost: cm= c ; with 0 and where m stands for a …rm participating in the merger. In the pre-merger game, individual pro…ts are the ones in Equation (3). From pro…t maximization of the merged …rm and of the symmetric non-merged …rms we get, respectively, the following system of FOCs:
P0(Q)qm cm = P (Q);
P0(Q)(Q qm)
N M c = P (Q);
that give the following quantity equilibrium values:
qm = 1 (N M + 1) (N M ) (cm c) P0(Q) + Q ; qi = 1 (N M + 1) Q + (cm c) P0(Q) :
where i stands for the outside …rms. Substituting the above equilibrium quantities inside the pro…t function we get:
m;post= 1 P0(E) P0(E)E + (N M ) N M + 1 !2 :
Individual pro…ts of the N M outsiders i can be computed as follows: i;post= 1 P0(E) P0(E)E N M + 1 !2 :
Condition 2 In a constant marginal cost and symmetric Cournot model, a merger of M …rms creating productive e¢ciency gains is pro…table if and only if:
m=
P0 E E(N M + 1) pM N
N (N M ) :
It is worth noting that the merger is never pro…table for the outsiders, i.e. it can be easily shown that posti < prei :
The previous condition implies that e¢ciency gains must be large enough to give …rms incentives to merge. From the FOCs we can calculate the change in permits price after the
merger with e¢ciency gains that we note :
= P
0(E)E(1 M ) + (N M ) N
N (N M + 1) ;
which can be rewritten as:
= + (N M )
(N M + 1) :
Without e¢ciency gains ( = 0); or with full monopolization (M = N ), the second term is zero and the price of permits decreases as in the no-e¢ciency gain case. Otherwise, the second term may be stronger than the …rst one and the price of permits may increase after the merger. This is the case for a su¢ciently high e¢ciency gain i.e. > P0N(N M )(E)E(M 1):4 This increase is due to the fact that, after the merger, the merged …rms pro…ting from an e¢ciency gain have incentives to increase their production. Since total quantity produced is …xed by the supply of permits, this simply results in a higher demand for permits that, with a …xed supply, produces an increase in permits price.
The overall industry’s pro…t increases after a merger for any ; since:
= P
0 E 2 E2
2 (M 1) (N M ) 2
P0 E N (N M + 1) > 0;
that can be rewritten as:
= E
P0 E +
N! (N M )
N (N M + 1):
Consequently, since consumer surplus is una¤ected due to the fact that total quantity at the 4Notice that <
industry level remains constant, the merger is welfare enhancing:5 W = 1 P0(E= ) 1 N (N M + 1) N N M P 0 E E > 0:
The previous results can be summarized in the following proposition.
Proposition 2. In a Cournot symmetric case, a merger is welfare enhancing if it generates production e¢ciency gains for the merged …rms. The e¢ciency gain must be high enough for the merger to take place. The merger is never pro…table to outsiders.
Proof. See Appendix.
The previous result is particularly relevant to analyze mergers in the power sector where part of the included …rms are using low cost technologies that could also be less polluting, like it is the case of renewables.
So far we have assumed that only the …rms that are present in the …nal market participate in the permits market. We relax this assumption in the following Section 3 and show that a merger in one market a¤ects the allocation of production in all the markets that cover their emissions with permits.
3
When markets are linked by the permits market
3.1
The presence of an outside output market
Consider that on top of the product market considered so far, there is a demand for permits coming from another industry denoted by ‘o’ for ‘outside’, i.e.: oQo( ) where o is the pollution factor of the outside industry and Qo( ) is its production when the permits price is
. The equilibrium on the permits market now is:
Q( ) + oQo( ) = E: (7)
A merger between M of the N …rms is now pro…table if and only if: P0(Q( post)) P0(Q( pre)) Q( post)2 Q( pre)2 1 (N M + 1)2 > M 1 N2: (8)
We observe that this condition di¤ers from the the Condition 1 by a multiplicative positive factor P0(Q( p o st))
P0(Q( p re))
Q( p o st)2
Q( p re)2 > 0 that can be higher or lower than 1, making the pro…tability condition more or less binding than in the case without the presence of an outside market.
Indeed, any merger now a¤ects the total quantity produced by the industry in which the merger takes place: the permits price variation due to the merger produces a change in the demand for permits coming from the outside industry, which impacts the pro…tability of the proposed merger. As an example, suppose that the merger leads the merged …rm to contract its output. The merger’s competitors respond by expanding their production due to the strategic substitutability of quantities but, overall, the total quantity produced by the industry is likely to decrease, leading to a decrease in permits price. This decrease in permits
price reinforces the pro…tability of the merger, although it also tends to give producers more incentives to expand their output, in particular to the outside industry.
Under our assumptions on P (:), we have P0(Q)Q increasing in Q. Therefore, to under-stand whether a merger is more or less pro…table with respect to the case with no outside industry, we must analyze (i) its impact on permits price and (ii) how the equilibrium pro-duction Q(:) varies with the permits price. Regarding the second point, since Q( ) and Qo( ) are linked through the market clearing condition in Equation (7), analyzing Q(:) boils down to analyzing how the quantity of the outside industry varies with the permits price. Let us distinguish three distinct cases:
Perfectly competitive outside industry. In that case, the price on the outside market is equal to the marginal cost, which includes the permits price. Therefore: Q0
o( ) < 0. Monopolistic outside industry. In that case, a standard argument yields: Q0
o( ) < 0. Imperfectly competitive outside industry. The analysis of this case is less immediate. Indeed, following Myles (1987), whether the (total or individual in the symmetric case) quantity decreases with an increase of the marginal cost of all the …rms depends on the slope of the elasticity of the inverse demand function. Similarly, what happens in a non-competitive outside market could impact the permits price (as in Sanin and Zanaj, 2011).
For simplicity let us consider the linear case Qo( ) = C D , i.e. Q0
o( ) < 0, and linear
demand in the output market P (Q) = a bQ:
In such con…guration the industry production varies with the permits price according to the following expression:
Q( ) = E oC + o D (9)
which implies Q0( ) = oD > 0.
FOCs before and after the merger are in this case: pre+ b 1 + 1
N Q( pre) a + c = 0; (10)
post+ b 1 + 1
N M + 1 Q( post) a + c = 0: (11)
After substituting Equation (9) inside Equations (10) and (11) we can compute for this case:
= b (M 1) ( (E oC) + o(a c) D)
(N 2+ b oD (1 + N )) ( 2(N M + 1) b oD (N M + 2)): (12) A su¢cient condition for Equation (12) to be negative after the merger is:6
< 0 , (E oC) > 0: (13)
Looking at Equation (13) and comparing it with Equation (9), we see that it is a condition on the relative size of the sector compared to the outside sector. In particular, the outside
sector needs to be small enough so that total demand for permits decrease after the merger provoking a decrease in permits price.
Regarding the condition of merger pro…tability in the presence of an outside market, there is an additional aspect to consider. In the case of linear demand P0(Q(
post)) = P0(Q(
pre)) = b and from the FOCs in Equations (10) and (11) we know that Q( pre) = a c p re b(1+1 N) and Q( post) = a c p o st b(1+ 1 N M +1)
; respectively. Then, the pro…tability condition in Equation (8) becomes: (a c post)2 (a c pre)2 1 +N1 2 1 +N M+11 2 > M(N M + 1) 2 N2 : (14)
Notice that, if the permits price increases after the merger, the LHS is lower than 1 and the pro…tability condition in the presence of an outside market becomes more restrictive than condition in Equation (6). Instead, if the permits price decreases the LHS can be higher or lower than 1 and the condition can be more or less restrictive than in the case without the presence of the outside market. It is particularly interesting to study wether it is possible that a merger that is not pro…table (i.e. not verifying Equation (6)) becomes pro…table solely due to the existence of an outside market (i.e. veri…es Equation (14)) that absorbs the demand change in the permits market after the merger. This is the case when the number of merged …rms M satis…es the following condition:
(a c post)2
(a c pre)2
(N + 1)2(N M + 1)2
(N M + 2)2 > M (N M + 1)
2> N2: (15)
To study the …rst inequality on the left let us call A (a c p o st)2
(a c p re)2 > 1. The LHS of inequality (15) is satis…ed if
A (N + 1)2 M (N M + 2)2> 0; (16)
which indeed is always satis…ed for high values of A:7
The inequality on the RHS in (15) can be expressed as follows:
(M 1) (N M )2 M > 0: (17)
and is satis…ed for the following values:8 1 < M < N 1
2 p
4N + 1 +1
2: (18)
The intersection of Equations (16) and (18) is non-empty. This means that the existence of an outside market makes the merger pro…table. The mechanism is simple: the decrease in the permits price due to the merger is strong enough for A to be big. Moreover, condition (18) 7Note that the inequation is a third-degree polynomium in M that has 3 roots. For high values of A the polynomium is always positive in the range 1 < M < N .
8Notice that this polynomium has 3 positive roots: one is equal to 1, another one higher than N and only one equal to N 1
2p4N + 1 + 1
ensures that the number of merged …rms is small enough.
From the previous reasoning the following proposition obtains: Proposition 3. Assume that Q0
o( ) 0 for all 0. A merger leads to a lower permits
price, a higher quantity produced in the outside market and a lower quantity produced in the market where the merger takes place. Moreover, when the number of merged …rms is lower than M
¯ = N +
1 2 12
p
4N + 1 and the price decrease is strong enough (i.e. A (a c post)2 (a c pre)2 is high enough) a merger that would not take place without the presence of the outside market now becomes pro…table.
Proof. In the text.
The previous results proves to be particularly relevant in the case of the EU-ETS market. The fact that several industries are linked through the permits market regulation changes the pro…tability of a merger inside each industry. In this sense, the fact that for example the cement industry is also under the EU-ETS regulation could change the pro…tability of a merger in the power sector.
3.2
An horizontal merger in an input-output structure
We continue exploring the analysis of horizontal mergers but in the context of vertically related industries, which is particularly relevant in the power sector. An upstream industry produces an input which is then used (on a one-to-one basis) by a downstream industry to produce a …nal good. The production of both the input and the output generates pollution, although possibly with di¤erent intensities. This is the case in the EU-ETS where polluting input sectors (e.g. electricity or gas) sell their goods to polluting downstream sectors (e.g. steel, cement, paper), both subject to an environmental regulation. We build on the so-called double Cournot model of Salinger (1988), or more recently Gabszewicz et al., (2013). The downstream industry, denoted with ‘d’, has Nd…rms competing à la Cournot on a …nal market in which the inverse demand function is given by Pd(Qd) and where the total quantity of …nal good produced is Qd. Downstream …rms are symmetric, the marginal cost being cd and the pollution factor d. The upstream industry, denoted by ‘u’, has Nu …rms competing à la Cournot on the intermediate good market. Upstream …rms are symmetric, the marginal cost being cu and the pollution factor u.
Both upstream and downstream …rms are assumed to be price-takers on the permits market. The timing of the game is as follows: upstream …rms decide their production levels; downstream …rms choose their quantities; the permits market clears.
Downstream equilibrium. Downstream …rms i = 1; :::; Nd maximize their pro…t as
fol-lows:
max qi;d
[Pd(Qd) cd d pu] qi;d:
where pu is the price paid for the upstream good. Faced with this price, The FOC for each of the Nd symmetric …rms is:
pu= Pd(Qd) cd d + Pd0(Qd)
Qd Nd:
Since one unit of input is required for each unit of output produced, it must be the case that Qd= Qu. Therefore, we deduce the inverse demand curve in the input market:
Pu(Qu) = Pd(Qu) cd d + Pd0(Qu)
Qu Nd:
Upstream equilibrium. Each input producer j = 1; :::; Nu maximizes its pro…t: max
qi;u
[Pu(Qu) cu u ] qi;u;
which leads to the following FOCs:
Pu(Qu) cu u + Pu0(Qu) Qu Nu = 0; with P0 u(Qu) = Pd0(Qu) 1 + N1d + P 00 d(Qu) Qu Nd:
Permits market equilibrium. Since agents are price-takers in the permits market, the equilibrium price must be such that total demand equals total supply:
dQd+ uQu= E; that since we assume Qd = Qu Q; can be rewritten as:
Q = E
d+ u
: (19)
Equilibrium pro…ts. The pro…t of a downstream producer is given by:
d= Pd0(Q) Q Nd
2
: (20)
Similarly, the pro…t of an upstream producer is given by:
u= Pd0(Q) 1 + 1 Nd + Pd00(Q) Q Nd Q Nu 2 : (21)
After substituting Equation (19) in Equations (20) and (21) we get:
d = Pd0 E d+ u E Nd( d+ u) 2 (22) u = Pd0 E d+ u 1 + 1 Nd + P 00 d E d+ u E Nd( d+ u) E Nu( d+ u) 2 : (23)
3.2.1 Downstream horizontal merger
The constraint in Equation (19) ensures that the equilibrium output both in the downstream and the upstream market respects the environmental constraint. Then, the pro…tability of
a downstream merger is simply the condition in Equation (??), i.e. a merger of M …rms is pro…table if and only if:
1 (Nd M + 1)2 M N2 d :
Increasing the concentration of the downstream sector has an indirect e¤ect on the
up-stream market. By using Equation (23) and de…ning = d + u; the di¤erence between
post-merger and pre-merger pro…ts in the upstream industry is shown to be positive. This is the case because the quantity produced in both market stays the same. Therefore, Equation (19) holds and price of the upstream good is also unchanged. As in Equation (4), however, the merger in the downstream sector decreases the permits price. This e¤ect bene…ts both upstream and downstream sectors. The pro…ts of the downstream sector increases since fewer …rms produce the quantity Q, thus leading to a decrease in permits price. Therefore, the Equation (5) still holds. The di¤erence in the pro…ts post and pre-merger can be written as follows: u;postd u;pred = Pd0 E + P00 d E E ( ) 1 M Nd(Nd M + 1) E Nu( ) 2
Pro…ts in the upstream sector also increase due to the permits price e¤ect just mentioned:
u u;postd u;pred = E 1 N2 u + Pd00 E E ( ) 1 M Nd(Nd M + 1) E Nu( ) 2 >0:
3.2.2 Upstream horizontal merger
Since the produced quantity remains unchanged, there is a direct e¤ect of the merger on permits price that bene…ts directly the upstream …rms and indirectly the downstream …rms. All the previous results remain the same simply by exchanging the subindex d by u and vice versa.
Proposition 4. When a merger takes place in one industry, the decrease in permits price pro…ts the vertical related industry.
Proof. In the text.
4
Pollution reallocation when …rms are heterogeneous
Consider now that …rms di¤er in their marginal costs of production. With this purpose we slightly change our setting and consider the following ‘oligopoly - fringe model’ that could describe the power market in countries like France or in some states of the United States of America.
Oligopoly-fringe model. There are two types of …rms producing in the …nal market: D dominant …rms, denoted by i = 1; :::; D, whose production technology exhibits con-stant returns-to-scale with marginal cost cd.
A fringe composed of F competitive …rms i = 1; :::; F , whose production technology exhibits decreasing returns-to-scale with total cost Cf(qf) = 12c2fqf where qf =PFi=1qi;f. The fringe is assumed to be a price-taker on the product market.
Both types of …rms simultaneously decide their quantities and the permits market clears. The fringe e¢ciency, summarized by cf, a¤ects the relative size of the proposed merger: for instance, when cf is low (large), the fringe produces a large (small) quantity and the merger between dominant …rms involves a small (large) fraction of the total output.
Absent any merger, an (interior) equilibrium is a pro…le of quantities ffqi;dgi=1;:::;D; fqi;fgi=1;:::;Fg and a permits price such that each dominant …rm i = 1; :::; D, maximizes its pro…t as follows:
P (Q) cd + P0(Q)qi;d= 0;
the fringe FOCs for pro…ts maximization give:
P (Q) = cfqi;f+ ; (24)
and the permits market clears when demand is equal to supply: N
X
i=1
qi;d+ qf = E;
where qf =PFi=1qi;f= F qi;f and Q =PDi=1qi;d+ qf
A merger between M of the D dominant …rms simply produces a reduction of the number of dominant …rms. Let us consider the case cd
cf < E
F for the output production to be positive9 and specify a linear demand in the output market, i.e. P (Q) = a bQ.
A system between the demand in the output market and Equation (24) allows to determine the residual demand for the dominant …rms that we denote as follows:
QDresidual= P (cf + F b) F b acf
bcf :
We then substitute the inverse residual demand in the objective function, i.e.: max qi;d 0 acf+ F b (cf+ F b) bcf (cf + F b)QDresidual cd qi;d:
and maximize to obtain pro…ts before the merger takes place: Dpre= qi;d2
bcf cf+ F b
:
9This condition ensures that production by dominant …rms is positive both before and after the merger. It can also be interpreted as a restriction on the fringe size: the number of fringe …rms F has to be su¢ciently low in order to verify the constraint on output due to the existance of a pollution cap.
The merger is pro…table if Dpos > M Dpre; a similar reasoning must be done to calculate pro…ts after the merger, which in turn is:
Dpost= Q2Dpost bcf (cf+ F b)
1
(D M + 1)2:
Since in equilibrium all qi;d are the same, and considering the permits price equilibrium, the pro…tability condition can be rewritten as:
(E qf pre)2 D2 > M (E qf post)2 (D M + 1)2 where qf;t = F (a bE) t
cf and the subindex t can take the value pre or post merger. As
usual, the pro…tability condition is related to the change in permits prices due to the merger, which in this case is always negative:10
= 2 b (M 1) (cf+ F b) (F cd Ecf)
(cfD + F b(1 + D)) (cf(D M + 1) + F b (D M + 2)) < 0: From the previous reasoning we derive the following proposition
Proposition 5. In the oligopoly-fringe model, a merger between the oligopolistic …rms is always pro…table and accompanied by a permits price decrease.
Proof. See Appendix.
With respect to the benchmark case of Cournot competitors (Section 2), here the merger is always pro…table, no matter the size of the merged entity. Dominants restrict output knowing that the fringe absorbs the production di¤erential. As a consequence, given that the total output is constant in the pre and post cases, the demand for permits always decreases and so does the corresponding price.
The non-strategic behavior of the fringe also has some straightforward implications on the equilibrium permits price and quantities produced. In terms of comparative statics, we have:
@ QDpost @M = F b (cf + F b) (F cd Ecf) c2 f(cf(D M + 1) + F b (D M + 2)) 2 < 0; @ qfpost @M = F b (cf + F b) ( F cd+ Ecf) c2 f(cf(D M + 1) + F b (D M + 2)) 2 > 0; @ ( post) @M = b (cf + F b) (F cd Ecf) 2(cf(D M + 1) + F b (D M + 2))2 < 0:
An increase of the number of dominants who merge leads to a decrease in permits price, an output contraction by the dominants perfectly compensated by an increase of production 1 0Notice that permits prices are calculated by solving the system of FOCs, substituting the market for permits clearing condition and rearranging in the case with and without a merger, respectivelly.
by the fringe. As a consequence, dominants always have an incentive to become a unique entity after the merger. We can then establish the following corollary:
Corollary 1. The pro…t of M dominant oligopolists is always lower than the pro…t of a unique dominant.
Proof. The equilibrium quantity produced by a unique dominant …rm and the pro…t are, respectively: QDpost;M=D = (cf+F b) cf(cf+2F b)(Ecf F cd) ; post;M=D = bcf cf+F b Q D postM 2 : Straigthforward calculations show that:
post post;M=D=
(cf+F b)(cf(D M +2)+F b(D M +4))( Ecf+F cd) cf(cf+2F b)(cf(D M +1)+F b(D M +2)) < 0:
5
Case Studies
Big mergers have taken place after the creation of tradable emission permits both in the US and in Europe. In this section we argue that the use of tradable emission permits may be one of the mergers driving reasons. To this end, we give several examples that illustrate the validity of our results.
5.1
An application to the RGGI
The Regional Greenhouse Gas Initiative (RGGI) was put in place in 2009 (with a …rst auction on the 25th of September 2008) as the …rst mandatory cap-and-trade program to limit CO2 emissions in the United States.11 Nine states currently participate in the RGGI: Connecticut, Delaware, Maine, Maryland, Massachusetts, New Hampshire, New York, Rhode Island, and Vermont. Several states and Canadian provinces act as observers: Pennsylvania, Québec, New Brunswick, and Ontario. New Jersey formerly participated, but it withdrew in 2011.
The market works as follows. One hundred sixty three electric power generators are required to obtain a number of permits (or allowances) equal to the number of tons of CO2 emitted.12 CO2 emission allowances are distributed primarily through auctions (94% of all permits in December 2015). At the end of 2015, RGGI has conducted 30 successful auctions, selling a total of 801 million CO2 allowances for $2.4 billion.
Following the 2012 Program Review, the participating states announced changes to the Model Rule, including a new emissions cap set at 91 million tons for 2014, reduced by 2.5
1 1For more information see:
http://www.ieta.org/resources/Resources/Case_Studies_Worlds_Carbon_Markets/rggi_ets_case_study-may2015.pdf
1 2For more statistics of this type see
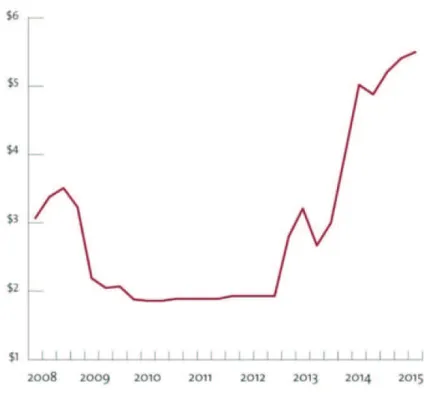
Figure 1: Source: CommonWealth Magazine on rggi.org data.
percent per year, reaching approximately 78 million tons in 2020. The Model Rule also included further interim adjustments to the cap in order to account for the surplus of CO2 allowances accumulated from 2009 to 2013.13
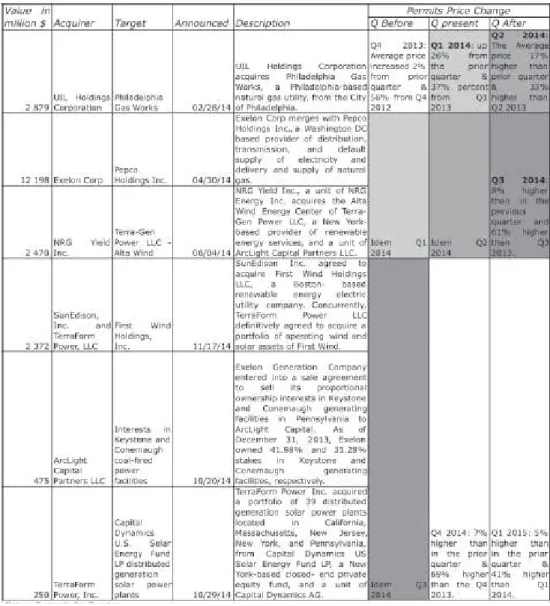
Figure 1 shows that the prices in the RGGI market have continuously increased. Such increase is mostly due to a tighter cap that came into e¤ect in 2013. Due to this update on the market cap we are unlikely to observe a decrease in permits price after each merger takes place but only a deceleration in the price increase to which all these mergers may have contributed. Given the results underlined in this paper we think it is not a coincidence that the most important mergers in the RGGI area have happened after this great tightening of the market cap in 2014, which are all summarized in Table 1.
Among the mergers that have taken place between …rms with predominant presence in the states covered by the RGGI14, the biggest one has been the merger of Exelon Corporation and Pepco Holdings Incorporated. Such merger was announced on April 2014 for more than $12 billion. At the moment of the merger Exelon served 6.7 million costumers through its
1 3The 2016 Program Review is now being conducted.
1 4For a detail on recent mergers in the U.S. power sector see the quarterly reports of PwC at http://www.pwc.com/us/en/power-and-utilities/publications/us-powerdeals. html
subsidiaries in Illinois, Pennsylvania and Maryland and intervened in all stages from genera-tion to delivery of electricity. On the other side, Pepco Holdings served 1.9 million customers in the District of Columbia and Maryland. Pepco Holdings also owns Delmarva Power in Delaware and Maryland. This merger was presented as a horizontal merger even if Exelon holds all activities at a time, being an example of the type of mergers mentioned in Section 3.2. The U.S. Energy Information Agency explains that, according to Exelon, cost reductions available through increased scale and geographic proximity were the primary reasons for the merger (see Today in Energy15 report in October 2014).
Another merger among …rms in the RGGI, announced around the same dates, is the NRG Yield Inc. acquisition of Alta Wind Energy Center of Terra-Gen Power LLC and of ArcLight Capital Partners LLC, for an estimated $2.5 billion. NRG Yield Inc. is a Delaware unit of NRG Energy Inc., Terre-Gen Alta Wind is a New York-based provider of renewable energy and ArcLight is a Boston-based equity …rm. This merger16 could be an example of the case modeled in Section 2.2 since the inclusion of a renewable source will most probably generate e¢ciency gains in the context of environmental regulation.
The prospect of a decrease in permits price after the merger could indeed, as shown by our model, be a cost reduction argument that increases merger incentives. Indeed, the average price of CO2 allowances during the …st quarter of 2014 (i.e. the quarter before the two mentioned mergers took place) went from around $3.50 at the beginning of the quarter to almost $4.50 at the end of the quarter averaging $3.87. As compared to the previous quarter it increased of 26 percent and 37 percent as compared to the …rst quarter of 2013.17
Many other mergers have taken place among …rms belonging the RGGI and many U.S. investor-owned utilities have indeed consolidated in recent years.18 In the table below we show all the mergers that took place during 2014, the year when prices started to steadily increase due to the tightening of the cap.
5.2
Could our argument also apply to the EU-ETS?
The European Union Emissions Trading Scheme (EU-ETS) started in 2005 as the world’s …rst and biggest international trading system for CO2 emissions. As in the case of the RGGI, …rms under regulation are required to obtain a number of permits equal to the number of tons of CO2 emitted. During the …rst years permits where allocated to …rms for free using a method called grandfathering (a percentage reduction of your installation’s emissions in 1990) but nowadays most of permits are auctioned.19 The EU-ETS now covers emissions from more than 11,000 heavy energy-using installations (including power stations and indus-trial plants) and airlines operating between participating countries (all 28 EU countries plus
1 5See http://www.eia.gov/todayinenergy/detail.cfm?id=23432
1 6For a comparison of the two mergers mentioned see the PwC Quarterly Report in
http://www.pwc.com/us/en/power-and-utilities/publications/assets/pwc-northamerican-power-utilities-deals-q2-2014.pdf
1 7See RGGI Market Report Q1, 2014 at https://www.rggi.org/docs/Market/MM_Secondary_Market_Report_2014_Q1.pdf
1 8For more information on this see The Public Power Report at
http://www.publicpower.org/About/interiordetail2col.cfm?ItemNumber=38936&navItemNumber=38732 1 9For a description of the auctioning mechanism and results see the Common Auction
Platform report at
Iceland, Liechtenstein and Norway). In total it covers around 45% of the EU’s greenhouse gas emissions and accounts for over 3/4 of international carbon trading.20 Power and CHP plants represented around half of the allowances allocated in Phase 2 (2008-2012) of the EU ETS. Di¤erently from the RGGI where the electricity market and the permits market are in almost perfect correspondence, the link between the two markets is most probably weaker. In Section 3.1 we show the case in which other sectors also participate in the permits market. We think that a merger in the EU-ETS case could be described by the conditions detailed in that section.
Several …rms concentrations have taken place since the EU-ETS has been established. For instance, The Economist of the 26th of February 2009 explained how the frenetic merger trend present since 2006 has made the European market evolve into an oligopoly21 dominated by a few-cross border giants, such as EDF from France, E.ON and RWE from Germany and Enel from Italy.22 Just to cite the most important mergers we are referring to let us mention Enel´s acquisition of Endesa that started at the beginning of 2006 (when Enel bought 67% of Endesa bringing in a Spanish partner called Acciona to appease local feeling) and ended at the 20th of February 2009 when Enel bought Acciona´s stake for 11.1 billion euros.23 Few days before the Spanish government had accepted the merger of Gas Natural with Union Fenosa.24 That same week Vattenfall, the largerst Nordic utility, bought the Dutch energy …rm called Nuon for 8.5 billion euros.25 Back in January of that same year the German RWE also bought the Dutch Essent for 9.3 billion euros.26
The reasons behind the previous mergers are, most certainly, multidimensional. In any case such mergers have coincided with a systematic decrease in CO2 prices in accordance with our results. Indeed, the …rst merger cited coincides with the most changing year of the EU-ETS (in that period, the price of emissions permits tripled in the …rst six months of Phase I and then collapsed by half in a one-week period in 2006). Since then, a systematic price decrease has characterized the CO2 market. Our model shows that the number of important mergers in the power sector may have contributed to the price slowdown due to other economic factors.
6
Conclusion
This paper extends Hennessy and Roosen (1999)´s result on the merger incentives created by the existence of a tradable emission permits market to the case in which the polluting …rms
2 0For a full description of the EU-ETS regulatory framework and coverage see
http://ec.europa.eu/clima/publications/docs/ets_handbook_en.pdf
2 1See the article called Power Games in http://www.economist.com/node/13184847
2 2For a detailed list of mergers in the Power Sector see the DG Comp website at
http://ec.europa.eu/competition/mergers/overview_en.html
2 3See the Financial Times article of the 21st of Febuary 2009 at http://www.ft.com/intl/cms/s/0/f46aec86-febd-11dd-b19a-000077b07658.html#axzz4Be3LblCD
2 4See the announcement of the 7th of September 2009 in their website:
https://www.gasnaturalfenosa.com/en/news/1285338473668/1307555492223/gas+natural+conclued+its+merger+with+union+fenosa+today.ht 2 5See Reuter’s article on the day of the announcement, the 23th of February 2009, herein
http://www.reuters.com/article/us-nuon-vattenfallidUSTRE51M3AX20090223
2 6See Financial Times article of the 12th of January 2009 at http://www.ft.com/intl/cms/s/0/43ea1cc6-e0bb-11dd-b0e8-000077b07658.html#axzz4Be3LblCD
are non-competitive, as it is the case in most energy markets and in particular in the power sector. We …nd that, if …rms in the sector are symmetric and competing à la Cournot, an horizontal merger is welfare improving but there is a critical size for it to occur and, in the presence of a perfectly competitive (or monopolistic) outside market that also participates in the same tradable emission permits market, under some conditions a merger that would not be pro…table without it now takes place. The …rst result suggests that, as prices go up in the RGGI, merger incentives coming from the CO2 market will continue to increase. Similarly, the second result says that in the case of the EU-ETS, where more than one industry is under the same CO2 market, incentives for mergers due to the sole existence of this market are even greater. We also study the case of vertically related sectors, which is particularly relevant in power markets, …nding that an horizontal merger in one of two markets that are vertically linked increases pro…ts in both markets due to the provoked decrease in permits price. Finally we …nd that a merger between oligopolistic …rms in a market where there is a competitive fringe is always pro…table as opposed to the symmetric Cournot case in which there is a critical size needed.
Our results regarding the modi…cation of the merger pro…tability condition in the presence of a tradable emission permits market provide new insights for understanding many mergers that have taken place both under the RGGI and the EU-ETS. The policy implications from these results are quite straightforward: there is a trade-o¤ between promoting a high CO2 price to reduce the environmental externality and promoting competition in energy markets, in particular in the power sector where …rms are also vertically related with other …rms covered by the same tradable emission permits market. The regulator should then counterbalance pro et contra before …xing (or tightening) the cap on emissions and should work closely with com-petition authorities to avoid putting too much pressure on consumers. These considerations add to the considerations in De Feo et al. (2013) regarding the decrease in competition that could arise in the power sector when a permits market is in place.
A. Cretì gratefully acknowledges …nancial support from the Ecole Polytechnique Chair EDF-Sustainable Development, and the Business Sustainability Initiative at Europlace Insti-tute of Finance.
7
References
1. Canton, J., David, M. and Sinclair-Desgagne, B., 2012. Environmental Regulation and Horizontal Mergers in the Eco-industry, Strategic Behavior and the Environment, now publishers, 2(2): 107-132.
2. De Feo, G., Resende, J. and Sanin, M. E. (2013), Emission Permits Trading and Down-stream Strategic Market Interaction. The Manchester School, 81: 780–802.
3. Ehrhart, K.M., Hoppe, C. and Löschel, R. 2008. Abuse of EU Emissions Trading for Tacit Collusion. Environmental and Resource Economics 41: 347-361.
4. Farrel, J. and Shapiro, C. 2001. Scale Economies and Synergies in Horizontal Merger Analysis.Antitrust Law Journal, 68: 685-710.
5. Gabszewicz, J. Laussel, D., Ypersele T., Zanaj, S. 2013. Market Games in Succes-sive Oligopolies, Journal of Public Economic Theory, Association for Public Economic Theory, 15(3), 397-410, 06.
6. Hennessy, D.A. and Roossen, J. 1999. Stochastic Pollution, Permits, and Merger Incen-tives. Journal of Environmental Economics and Management 37: 211-232.
7. Lambertini, L. and Tampieri, A. 2014. E¢cient Horizontal Mergers in Polluting Indus-tries with Green R&D and Endogenous Taxation, Keio Economic Studies, 50:1-7. 8. Myles, G.D. 1987. “Tax Design in the Presence of Imperfect Competition: an Example,”
Journal of Public Economics, 34, 367-378.
9. Motta, M (2004), Competition Policy, Cambridge University Press.
10. Salant S.W., Switzer S., and Reynolds R.J. 1983. Losses from horizontal merger: The e¤ect of an exogenous change in industry structure on Cournot-Nash equilibrium, Quar-terly Journal of Economics. 98: 185-199.
11. Salinger M.A. 1988. “Vertical Merger and Market Foreclosure,”Quarterly Journal of Economics, 103, 345-356.
12. Sartzetakis, E. 2004. On the E¢ciency of Competitive Markets for Emission Permits. Environmental and Resource Economics. 27: 1–19.
13. Sanin, M-E. and Zanaj, S. 2011.“A note on clean technology adoption and its in‡uence on tradable emission permits prices”, Environmental and Resource Economics, 48: 561-567.
8
Appendix
8.1
Proof of Proposition 1
The quantity produced does not change after the merger due to the equilibrium condition on the permits market: Q = E:
From the FOC of symmetric …rms we …nd that: pre = P0(E) Q N + P ( E) c post = P 0(E) Q (N M +1) + P ( E) c
and consequently the di¤erence is simply
= P0(E)E2 N (N M + 1)
N (N M + 1)
On the other hand the sum of pro…ts before and after the merger are pre = P0 E 1 N E 2! post = P0 E 1 (N M + 1) E 2
and consequently the di¤erence is
= P0 E E 2 1 (N M + 1) 1 N which is simply E:
Then, what is earned by the industry after the merger is exactly the amount lost by the government due to the decrease in the permits price.
8.2
Discussion on Condition 1
Under the assumption of linear demand a bQ and without a permits market, the Salant
(1983)’s condition for merger pro…tability, i.e. post> M pre; simply depends on the number of …rms in the industry after the merger takes place, that is:
(N + 1)2> M (N M + 2)2 (25)
The pro…tability condition in our model is giveny by Condition 1 that we reproduce here: 1
(N M + 1)2
M
N2 (26)
Notice that Condition 1 holds for any demand function. In our model total production is …xed by the availability of permits E and therefore mergers pro…tability only depends on the number of …rms after the merger.
Condition 1 can be more or less restrictive than the case without permits market. In fact, substracting Equation (25) from Equation (26) we …nd the following quadratic function of N :
N2
(N M + 1)2
(N + 1)2
(N M + 2)2 = 0;
that has two real roots, one of them that is always positive i.e.: r1 = 1
2 M +p(M + 1)2+ 1 1:
For a number of merging …rms M > r1, the permits market relaxes the pro…tability condition.