HAL Id: hal-02542690
https://hal.archives-ouvertes.fr/hal-02542690
Submitted on 14 Apr 2020
HAL is a multi-disciplinary open access
archive for the deposit and dissemination of
sci-entific research documents, whether they are
pub-lished or not. The documents may come from
teaching and research institutions in France or
abroad, or from public or private research centers.
L’archive ouverte pluridisciplinaire HAL, est
destinée au dépôt et à la diffusion de documents
scientifiques de niveau recherche, publiés ou non,
émanant des établissements d’enseignement et de
recherche français ou étrangers, des laboratoires
publics ou privés.
Missions
Florian Nicolas, Andreas Arnold-Bos, Isabelle Quidu, Benoît Zerr
To cite this version:
Florian Nicolas, Andreas Arnold-Bos, Isabelle Quidu, Benoît Zerr. Rigid Sonar Tracks Registration
For MCM Survey Missions. Undersea Defence Technology (UDT), Jun 2016, Oslo, Norway.
�hal-02542690�
Rigid Sonar Tracks Registration For MCM Survey
Missions
Florian Nicolas
∗†, Andreas Arnold-Bos
∗, Isabelle Quidu
†, Benoit Zerr
†,
∗
Thales Underwater Systems, Brest, France
{florian.nicolas, andreas.arnold-bos}@fr.thalesgroup.com
†
Lab-STICC/OSM, UMR CNRS 6285, ENSTA Bretagne, Brest, France
{florian.nicolas, isabelle.quidu, benoit.zerr}@ensta-bretagne.org
Abstract—In the context of sonar imagery, the image regis-tration process is often the very first step to achieve further processings ranging from navigation correction to change de-tection through mosaicking. In this paper, we aim at providing intensity-based registration techniques through the consideration of various similarity metrics to rigidly align pairs of sonar tracks. Such similarity measures are assessed on real high-resolution synthetic aperture sonar tracks.
Index Terms—image registration, sonar imagery, mine counter-measures, similarity measures.
I. INTRODUCTION
I
MAGE registration, which consists in geometrically align-ing two or more images, the reference/master/fixed one and the repeated /slave/moving one, is a crucial step in the field of remote sensing. Indeed, in an underwater context, it is often the first step to further be able to perform several tasks such as navigation correction ([1]–[3]) (for example to compensate for the INS drift), seabed mosaicking ([4]–[6]) or also to apply change detection techniques ([7]–[10]).Such an alignment can therefore be achieved through various methods. We usually split such methods into two groups, the symbolic ones (features-based) ([1]–[5], [7], [11]–[14]) and the iconic ones (intensity-based) ([6], [8], [9], [15]–[20]). While the former try to extract and match features such as objects lying on the seabed, salient points or homogenous areas, the latter directly work with the pixels intensity through various similarity (resp. dissimilarity) measures to maximize (resp.minimize), to find the optimal transformation.
In Section II, we emphasize the main issues of side-scan sonar image registration while we , we experiment intensity-based methods, through different similarity measures, on side-scan sonar tracks acquired with a synthetic aperture sonar in Section III.
II. SIDE SCAN SONAR IMAGE REGISTRATION ISSUES
In side-scan sonar image registration, the main difficulty is the viewpoint variability. Indeed, first of all, depending on the vehicle, it can be difficult to exactly re-navigate and scan a previously visited area. Although AUVs can relatively easily image a given area, a towfish sonar, due to its motion with respect to its master ship (layback), will experience additional difficulties and also cause distorsions on sonar images. If we wish to register images acquired with various
viewpoints, shadows and other features such as sand ripples can significantly differ from one view to another. Ferrand and Mandelert [7] illustrate the case of two opposite tracks imaging the same area, showing their significant differences. Moreover, in the case of non-flat seabed areas, sonar tracks will generally carry much more difference. Otherwise, another restriction can raise in case we rely on complex signals to perform registration where, as experimented by Lyons [21], signals decorrelation increases with both frequency and elapsed time between reference and repeat tracks acquistion.
III. EXPERIMENTS IN SONAR INTENSITY-BASED REGISTRATION
A. Introduction
As we are looking for an algorithm which does not re-quire any features detection step, we direct ourselves towards intensity-based methods instead of features-based ones. In-deed, we want such a method to apply whatever the seabed type (textured, presence of sand ripples or not, presence of mine-like objects or not). Of course, we realize that such a method will probably not succeed in all situations but we expect it to perform well in as many cases as possible. We thus evaluate four similarity metrics to perform rigid registration between two sonar tracks X and Y :
• To define the sum of squared differences (SSD), let
define Ω the overlapping area of the two images and N = card(Ω). Thus, the SSD is expressed as:
SSD(X, Y ) =X
i∈Ω
[X(i) − Y (i)]2
N (1)
• A modified version of the normalized cross-correlation, designed by Padfield [22] to take binary masks into account during the registration process, has also been implemented.
• A normalized version of the mutual information, as the one suggested by Studholme (NMI) [23] and which is overlap invariant, is considered (2). H(.) here corre-sponds to the Shannon entropy.
N M I(X, Y ) = H(X) + H(Y )
H(X, Y ) (2)
• The correlation ratio (CR) [24] with the sets Ωk =
cardinals Nk, and the total and conditional standard deviations σ2 and σ2 k. CR(X|Y ) = 1 − 1 N σ2 X i Niσ2i
For each of these metrics, a parabolic interpolation is performed to achieve subpixel accuracy.
B. Datasets
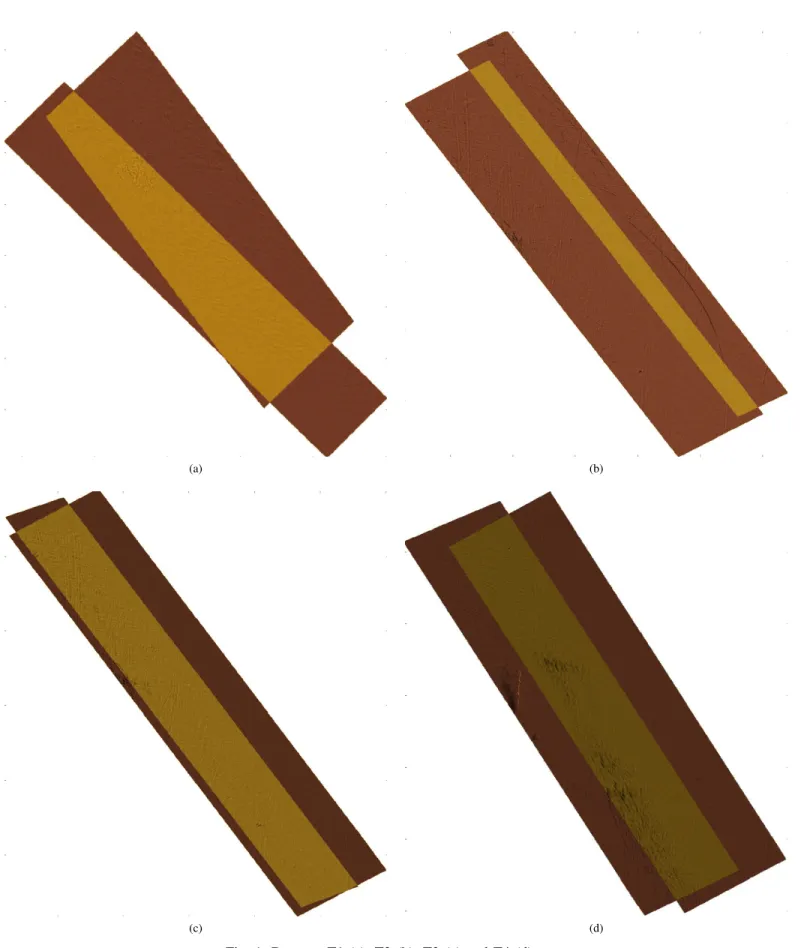
Regarding the experimental data, we have four high-resolution synthetic aperture sonar tracks pairs acquired offshore Brittany coasts, near Brest. Such data have been acquired with the SAMDIS sonar sensor manufactured by Thales. While this sensor is able to perform multi-aspect acquisition, we only rely on the broadside multi-aspect to perform our registration. The carrier is also equipped with an iXBlue PHINS inertial navigation system whose data are fused with a Teledyne RDI Workhorse 300 data velocity log (DVL). First and foremost, we project both sonar tracks in the Earth frame. Data are then stored at different resolutions and we have evaluated our similarity measures at three different resolution levels, ranging from 1 m to 0.25 m. the finest one being represented in Fig.1. Regarding the time baseline, two months elapsed between the acquisition of T1 tracks and, for T4 dataset, the second track was imaged the next day of the first one. Tracks from datasets T2 and T3 were acquired the same day.
Among the provided datasets, their respective tracks mainly differ by their grazing angle as their directions are pretty similar except for dataset T1. The surveyed area is made of sand with many trawling net marks, minelike objects along with sandy patterns.
To determine the optimal global rigid displacement be-tween the reference and the repeated tracks, we imple-ment a full search approach. Indeed, given the navigation incertitude provided by the INS, we can reasonably suggest an initial guess regarding such a displacement. Thus, in our experiments, we suppose our misregistra-tion vector (Tx, Ty) belongs to [−20m, +20m]2whatever
the resolution i.e. we do not use the previous scale to initialize the search at the current scale. Besides, while it could have been possible to add a rotation parameter, we neglected it in the rigid registration because of the IMU heading drift which is much slower than velocity and acceleration ones.
C. Results
As it can be noticed from Fig.I, CC, CR and MI perform similarly well in most cases excepts for the finest level of dataset T2. As we experimentally find out that speckle noise is much more present at this scale than at other ones, it could explained this failing along with the small overlapping area. Moreover, as expected, SSD fails in several cases, especially at finer resolutions, due to the increasing noise and seems not to be robust to overlapping area change (Fig.2 (b), (c)). The small overlapping area
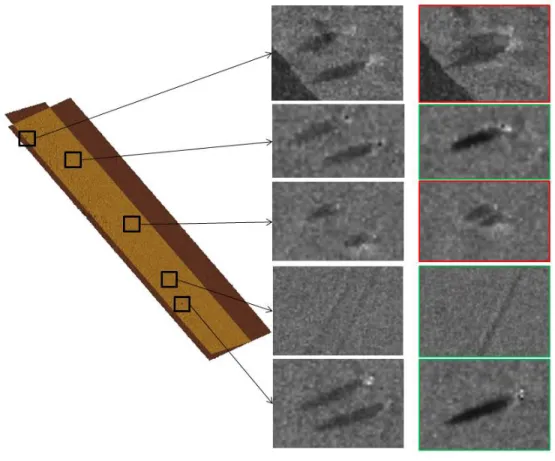
of tracks from T2 causes the similarity peak, whichever the metric, to be lost in the noise along with local maxima, plumetting the peak amplitude. (Fig.3) illustrates registration results, provided by the NCC at the finest scale, on relevant areas such as mine-like contacts or trawling net marks. In addition, these three similarity metrics let appear, especially for the T3 dataset, at least one secondary peak, located near the main one. While such secondary peaks are not comparable in terms of amplitude, their origin can be well explained as illustrated in Fig.4. Indeed, while the rigid registration, performed by means of the main peak, yields satisfactory visual results in some areas, such a peak clearly does not allow to correctly register in other ones. Thus, this demonstrates that a rigid transformation is not necessarily suitable to register sonar images as it is not able to model local deformations.
IV. CONCLUSION
In the context of SAS rigid image registration, we eval-uate various similarity measures on different datasets varying by their point of view or their overlap. Among these metrics, it has been experimented that SSD perform poorly while other perform rather well. However, we notice that such metrics can fail in case of speckle noise or overlap decrease. A filtering step could thus be applied on the input images to decrease speckle effect at finer resolutions. Moreover, we also demonstrate that, although the rigid model allows to coarsely align two sonar tracks, an elastic transformation is needed to finely align them. Furthermore, a con of mutual information is the need for an additional parameter such as the number of bins to compute the joint probability function (or the smoothing parameter if a kernel density estimation is considered). Otherwise, a pro of normalized cross-correlation is the computation time. Indeed, to be able to reach similar computation time with all metrics, we had to parallelize SSD, CR and MI, on several CPUs. In fact, while the CC uses the Fourier transform to locate the correlation peak, other measures have to look for such a maximum in the entire search space.
V. FURTHER WORK
We here only deal with rigid transformations. However, as it has been shown, although a global rigid transformation can coarsely align two sonar tracks, it will subsist local deformations which can be modeled through rigid local ones. Thus, a block-matching approach could fit such a need in providing a vector field from which specific transformation functions could be computed.
REFERENCES
[1] B. Zerr, G. Mailfert, A. Bertholom, and H. Ayreault, “Sidescan sonar image processing for auv navigation,” in Oceans 2005 -Europe, vol. 1, June 2005, pp. 124–130 Vol. 1.
[2] P. King, B. Anstey, and A. Vardy, “Comparison of feature de-tection techniques for auv navigation along a trained route,” in Oceans - San Diego, 2013, Sept 2013, pp. 1–8.
(a) (b)
(c) (d)
(a) T1
(b) T2
(c) T3
(d) T4
Fig. 2: Results of the exhaustive search for the 4 pairs of SAS tracks for the medium resolution level. The columns respectively correspond to the SSD, CC, CR and MI similarity measures. The red boxes illustrate secondary peaks near the primary one.
Estimated translation (Tx, Ty) in pixels.
Tracks pair Resolution level SSD CC CR MI T1 low (1.0, −14.6) (1.0, −14.5) (0.9, −14.3) (0.9, −14.3) medium (1.6, −29.0) (1.5, −29.0) (1.4, −29.0) (1.4, −29.0) high f ail (2.7, −57.6) (2.6, −57.5) (2.6, −57.6) T2 low f ail (0.2, 2.7) (0.1, 2.8) (0.1, 2.8) medium f ail (0.2, 6.0) (0.2, 6.0) (0.2, 5.9)
high f ail f ail f ail f ail T3 low (−1.7, −3.5) (−1.7, −3.7) (−3.2, −5.5) (−2.9, −4.7) medium f ail (−2.2, −8.0) (−2.9, −8.3) (−2.4, −7.7) high f ail (−3.1, −17.0) (−4.9, −17.1) (−5.9, −17.1) T4 low (−0.1, −2.0) (−0.2, −2.0) (−0.4, −1.9) (−0.4, −2.0) medium (−0.3, −4.1) (−0.7, −4.0) (−0.9, −4.0) (−0.9, −4.0) high (−0.7, −8.0) (−1.7, −7.9) (−1.9, −7.9) (−1.9, −8.1)
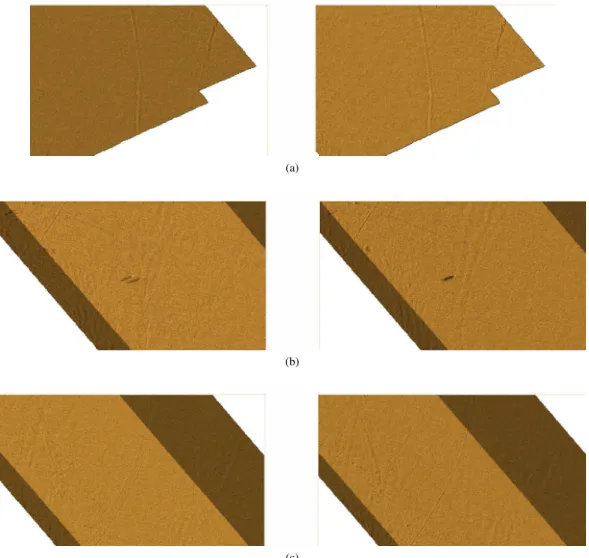
(a)
(b)
(c)
Fig. 3: Registration performances on relevant areas (first column: before registration, second column: after registration). (a) Mosaicking illustrating a trawling net mark continuity from T2. (b) Superimposed images with registrated mine-like object from T3. (ct) Trawling net pattern alignment from T3.
[3] P. Vandrish, A. Vardy, D. Walker, and O. Dobre, “Side-scan sonar image registration for auv navigation,” in Underwater Technology (UT), 2011 IEEE Symposium on and 2011 Workshop on Scientific Use of Submarine Cables and Related Technologies (SSC), April 2011, pp. 1–7.
[4] L. Bernicola, D. Gueriot, and J.-M. Le Caillec, “A hybrid registra-tion approach combining slam and elastic matching for automatic side-scan sonar mosaic,” in Oceans - St. John’s, 2014, Sept 2014, pp. 1–5.
[5] I. Leblond, “Recalage long terme d’images sonar par mise en correspondance de cartes de classification automatique des fonds,” Ph.D. dissertation, Universit de Bretagne Occidentale, 2006. [6] C. Chailloux, J.-M. Le Caillec, D. Gueriot, and B. Zerr,
“Intensity-based block matching algorithm for mosaicing sonar images,” Oceanic Engineering, IEEE Journal of, vol. 36, no. 4, pp. 627– 645, Oct 2011.
[7] J. Ferrand and N. Mandelert, “Change detection for mcm survey mission,” in 2012 International Conference on Detection and Classification of Underwater Targets, 2012, pp. 193–206. [8] I. Quidu, “Incoherent change detection using amplitude sidescan
sonar image,” in ECUA 2012, 2013. [Online]. Available: http://dx.doi.org/10.1117/12.2053067
[9] I. Quidu, V. Myers, Ø. Midtgaard, and R. Hansen, “Subpixel image registration for coherent change detection between two high resolution sonar passes,” in iCoURS’12, 2012.
[10] T. G-Michael, B. Marchand, J. D. Tucker, D. D.
Sternlicht, T. M. Marston, and M. R. Azimi-Sadjadi, “Automated change detection for synthetic aperture sonar,” vol. 9072, 2014, pp. 907 204–907 204–11. [Online]. Available: http://dx.doi.org/10.1117/12.2053067
[11] D. Gueriot, E. Maillard, and J.-P. Kernin, “Sonar image registra-tion through symbolic matching: a fuzzy local transform approach using genetic algorithms,” in OCEANS ’96. MTS/IEEE. Prospects for the 21st Century. Conference Proceedings, vol. 3, Sep 1996, pp. 1324–1329 vol.3.
[12] I. Barrodale, R. Kuwahara, R. Poeckert, and D. Skea, “Side-scan sonar image processing using thin plate splines and control point matching,” Numerical Algorithms, vol. 5, no. 2, pp. 85–98, 1993. [Online]. Available: http://dx.doi.org/10.1007/BF02212041 [13] S. Daniel, F. Le Leannec, C. Roux, B. Soliman, and E. Maillard,
“Side-scan sonar image matching,” Oceanic Engineering, IEEE Journal of, vol. 23, no. 3, pp. 245–259, Jul 1998.
[14] J. Zhao, W. Tao, H. Zhang, and K. Yang, “Study on side scan sonar image matching based on the integration of surf and similarity calculation of typical areas,” in OCEANS 2010 IEEE -Sydney, May 2010, pp. 1–4.
[15] C. Rominger, A. Martin, A. Khenchaf, and H. Laanaya, “Sonar image registration based on conflict from the theory of belief functions,” in Information Fusion, 2009. FUSION ’09. 12th International Conference on, July 2009, pp. 1317–1324. [16] M. T. Pham and D. Gueriot, “Guided block matching for sonar
Fig. 4: Snippets before (first column) and after rigid registration (second column). First and third rows correspond to areas where the rigid registration visually does not match the expected displacement.
in OCEANS 2013 - San Diego : MTS/IEEE international confer-ence, 2013, pp. 1–5 –.
[17] P. Y. Mignotte, M. Lianantonakis, and Y. Petillot, Unsupervised registration of textured images: applications to side-scan, 2005, vol. 1, pp. 622–627.
[18] C. Chailloux and B. Zerr, “Non symbolic methods to register sonar images,” in Oceans 2005 - Europe, vol. 1, June 2005, pp. 276–281 Vol. 1.
[19] C. Chailloux, “Recalage d’images sonar par appariement de r´egions : application `a la g´en´eration d’une mosa¨ıque,” Ph.D. dissertation, UR1 - Universit de Rennes 1, ITI - D´ept. Im-age et Traitement Information (Institut Mines-T´el´ecom-T´el´ecom Bretagne-UEB), 2007, th. doct. : Traitement du signal et tlcom-munications, Universit´e de Rennes 1, Institut Mines-Tlcom-Tlcom Bretagne-UEB, 2007.
[20] B. Bonnett and M. Hayes, “Data-driven image registration for coherent change detection of synthetic aperture sonar imagery,” in Proceedings of the 29th International Conference on Image and Vision Computing New Zealand, ser. IVCNZ ’14. New York, NY, USA: ACM, 2014, pp. 196–201. [Online]. Available: http://doi.acm.org/10.1145/2683405.2683455
[21] A. Lyons and D. Brown, “The impact of the temporal variability of seafloor roughness on synthetic aperture sonar repeat pass interferometry,” Oceanic Engineering, IEEE Journal of, vol. 38, no. 1, pp. 91–97, Jan 2013.
[22] D. Padfield, “Masked object registration in the fourier domain,” Image Processing, IEEE Transactions on, vol. 21, no. 5, pp. 2706– 2718, May 2012.
[23] C. Studholme, D. L. G. Hill, and D. J. Hawkes, “An overlap in-variant entropy measure of 3d medical image alignment.” Pattern Recognition, vol. 32, no. 1, pp. 71–86, 1999.
[24] A. Roche, G. Malandain, X. Pennec, and N. Ayache, “The correlation ratio as a new similarity measure for multimodal image registration,” in Medical Image Computing and Computer-Assisted Interventation MICCAI98, ser. Lecture Notes in
Computer Science, W. Wells, A. Colchester, and S. Delp, Eds. Springer Berlin Heidelberg, 1998, vol. 1496, pp. 1115–1124. [Online]. Available: http://dx.doi.org/10.1007/BFb0056301