Publisher: Taylor & Francis & Informa UK Limited, trading as Taylor & Francis Group Journal: Environmental Technology
DOI: 10.1080/09593330.2016.1259355
Insight into the adsorption mechanisms of trace organic carbon
on biological treatment process
Mehdi Zolfaghari a, Patrick Drogui a*, Satinder Kaur Brar a, Gerardo Buelna b, Rino Dubé b
a
Institut national de la recherche scientifique, Eau, Terre et Environnement (INRS-ETS), Université du Québec, 490 rue de la Couronne, Québec, QC, Canada, G1K 9A9. Tel : +1 (418) 654-2530, Fax : +1 (418) 654-2600.
b
Centre de Recherche Industrielle du Québec (CRIQ), 333 rue Franquet, Québec, QC, Canada, G1P 4C7. Tel : +1 (418) 659-1550, Fax : +1 (418) 652-2251.
*
Corresponding author
E-mail address: patrick.drogui@ete.inrs.ca (Patrick Drogui)
Abstract
Presence of recalcitrant dissolved organic matter (DOM) could have a significant effect on the adsorption mechanism and capacity of the sludge for many trace organic carbons (TrOCs), especially for the hydrophobic and/or positively charged compounds. In this study, adsorption of three TrOCs on the sludge and humic acid was investigated. The results revealed that neutral hydrophilic compounds had an insignificant interaction with both sludge and humic acid. Positively charged compounds like Fluoranthene, had more affinity toward humic acid than sludge with solid/liquid partitioning of 57, and 3.2 L/gTS for HA and sludge, respectively.
Adsorption mechanism of negatively charged TrOCs, was largely determined by strong interaction between adsorbate and adsorbent. Therefore, adsorption intensity (Kf) of Di 2-ethyl
hexyl phthalate was 0.5 and 1.13 for the humic acid and the sludge, respectively. By introducing the sludge to the solution of humic acid and TrOCs that already reached equilibrium, the ability of sludge to uptake TrOCs from DOM was also investigated. The findings showed that at the lower concentration, adsorption of humic acid on the sludge was considered as the main removal pathway for the adsorbed emerging contaminants, as 70 mg of HA adsorbed by a gram of sludge. For the higher concentration, desorption of TrOCs from DOM into the sludge comprised 15 to 30% of total removal efficiency.
Keywords:
List of symbols
CBZ = Carbamazepine
DEHP = Di 2-ethyl hexyl phthalate
DOM = Dissolved Organic Matter
FLAN = Fluoranthene
foc = Fraction of Organic Carbon
HA = Humic Acid
Log Kow = Octanol-Water Partition Coefficient
PAH = Polycyclic Aromatic Hydrocarbon
TS = Total Solid
TrOCs = Trace Organic Carbons
1 Introduction
Although emerging contaminants are considered to be less than 1% of total dissolved organic carbon in wastewater, they are the key concern, due to their persistence nature in the environmental media. Even at the trace concentration, they were recognized as a biological hazard for aquatic and land organisms [1]. Bioaccumulation and biomagnification of emerging contaminants gradually introduced them into the human body, finally led to the hormone interruption and cancer [2]. It could be hypothesized that large portion of trace organic carbons (TrOCs) readily escape from wastewater treatment plants, by two main reasons: (1) adsorption to the recalcitrant complex dissolve organic matter (DOM), such as humic substances, and (2) no interaction with sludge. The main TrOCs concern for treatment processes is dealing with non-volatile (with KH>3 atm.L.mol-1) [3], non-biodegradable, and large consumption compounds.
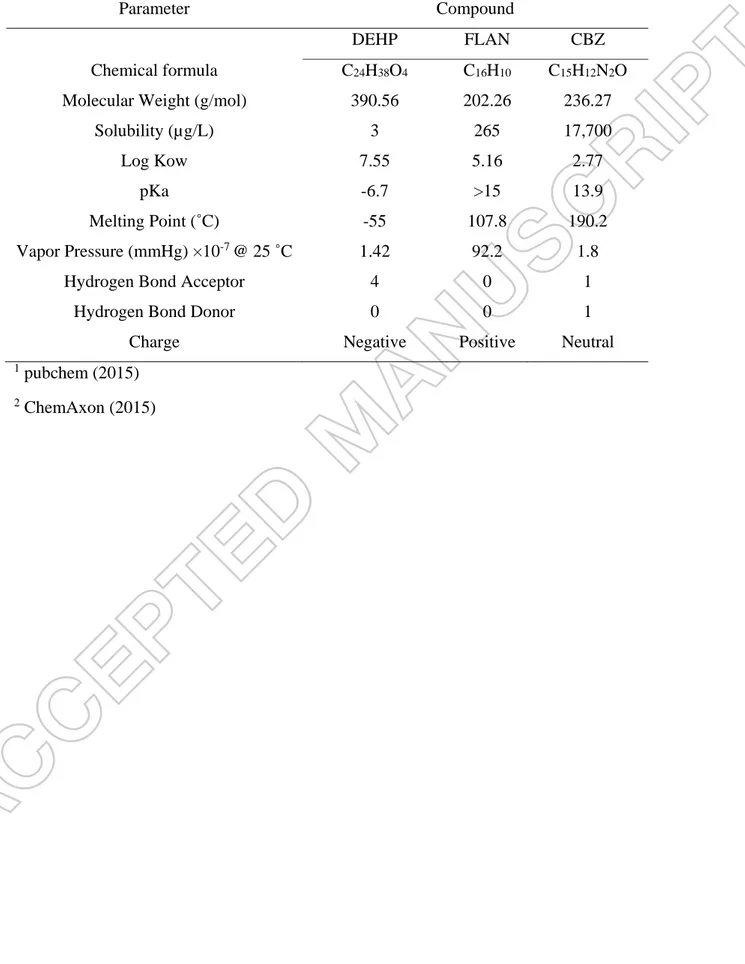
Therefore, three TrOCs were selected according to their hydrophobicity and charge (Table 1): (1) Di 2-ethyl hexyl phthalate (DEHP), (2) Fluoranthene (FLAN) and (3) Carbamazepine (CBZ) with Log Kow of 7.5, 4.6, and 2.3, respectively. The charge of TrOCs is depended on their chemical configuration (Figure 1-S in supplementary materials). According to Table 1, the mentioned compounds have low volatility and biodegradability; they have also been frequently detected in wastewater and landfill leachate worldwide and categorized in the US Environmental Protection Agency priorities list [2, 4, 5]. Negative charged, highly hydrophobic DEHP (low pKa and high Log Kow), is the most utilized plasticizer and phthalate acid ester, with concentration up to 120 µg/L and is representative of highly hydrophobic organic compounds [2]; while positive charged hydrophobic FLAN is considered as a representative of polycyclic aromatic hydrocarbon family which is carcinogenic [5] and widely present in refinery and petrochemical plant wastewater. Finally, neutral hydrophilic CBZ belongs to the pharmaceutical compounds
with very low biodegradability [4]. It is excreted unchanged into wastewater via urine [3]. As an anticonvulsant, it is predominantly found in hospital wastewater, finding its way to municipal wastewater at a concentration of ng/L to µg/L [6].
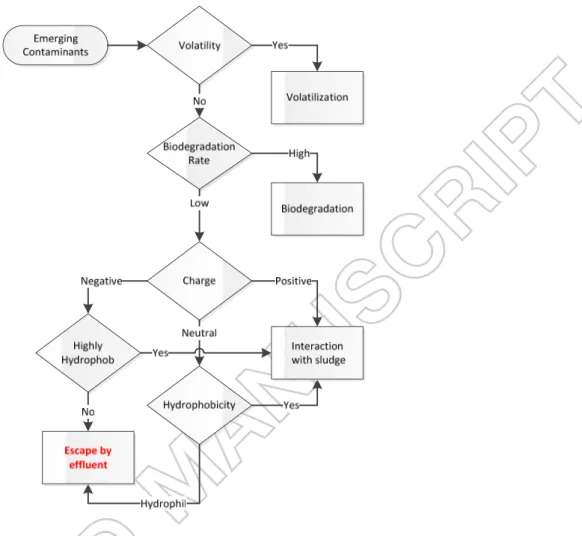
If hydrophobic and positively charged compounds are effectively adsorbed by sludge, how is it possible that they are detected in environmental media with higher concentration! According to the characteristics of TrOCs, their hypothetical pathway is fully depicted in Figure 1. In this study, these hypothetical pathways were tested to answer this question. The adsorption mechanism of TrOCs on sludge was investigated and later compared by humic acid (HA) through the kinetic, thermodynamic and adsorption isotherms models. Meanwhile, the effect of pH was also investigated on the adsorption capacity. Furthermore, organic carbon distribution coefficient was calculated based on solid/liquid partitioning and comparing with estimated empirical models for validation. Finally, the adsorption capacity of sludge was measured in presence of HA to have better understanding of dominant mechanisms on the adsorption of TrOCs on wastewater treatment plant (WWTP).
2 Material and Methods
2.1 Chemical
Organic solvents including methanol and dichloromethane (DCM), as well as DEHP, FLAN, CBZ, and humic sodium salt were analytical grade purchased from Sigma-Aldrich Canada Ltd. (Oakville, ON, Canada). Aldrich humic sodium salt was selected in these sets of experiments as a representative of DOM, since it provided range of molecules with wide differences in the molecular weight. The size of humic acid has a pivotal effect on the partitioning of TrOCs.
2.2 Sampling and preparation of sludge
As the target compounds are mainly non-biodegradable and widely detected in wastewater treatment, utilization of sludge from wastewater treatment plants undoubtedly, contains saturated concentration of TrOCs. Lower half-life requires higher retention time for degradation of these target compounds in sludge. Moreover, previous studies were in consensus that the type of sludge had an insignificant effect on adsorption capacity [4, 7]. Therefore, activated sludge used in this project was synthetically produced by the constant growth of microorganism culture through continuous membrane bioreactor process with hydrolytic retention time of 48 h, solid retention time of 30 days, fed by the synthetic wastewater with C/N/P ratio of 100/4/0.7 and the require mineral (composition in Table 1-S) that stimulated the maximum growth rate of microorganisms. As the synthetic wastewater was free of any recalcitrant compounds, the concentration of target TrOCs was insignificant and the sludge adsorption site was free for the maximum uptake. In addition, free suspended solid synthetic wastewater resulted in insignificant concentration of total dissolved solid, since the chemical oxygen demand concentration of supernatant after centrifugation was below 25mg/L. For the measurement of volatile and total solids of sludge (VS and TS), the standard method was considered [8]. The fraction of organic
carbon on sludge (foc) was measured according to the procedure recommended by Hyland,
Dickenson [7]. In this case, the sludge was lyophilized at -40 ˚C for 2 days and pressure stream of 0.004 mbar on freeze dryer instrument (Dura-Stop MP, FTS system, model: FD2085C0100), prior to the analysis by CHN analysis instrument (Leco, Truspec micro, St. Joseph, Michigan). VS/TS ratio was 0.57 and 0.7 for sludge and sodium humate; while foc ratio of sludge and
sodium humate was almost 0.60 to 0.65 goc/gsludge. Before experiments, the sludge was
centrifuged at 8000 rpm and 4°C for 10 min and washed with milliQ-water for three times. The whole process was repeated three times to ensure that suspended solids and colloids were totally removed. It was later re-suspended in water and was inactivated by addition of 200 mg HgSO4/L.
The optimum concentration of mercury sulfate was selected carefully by gradual increase of its dose in aerated activated sludge and measuring the remaining dissolved oxygen (data presented in Figure 2-S). The sludge considered deactivated, if dissolved oxygen remained unchanged in duration of 10 min. Previous study criticized utilization of mercury sulfate because of altering the surface of sludge, and negative affect on positively charged emerging contaminant [9]. They recommended dry heating or lyophilisation technique. Yet, our sludge contains 10% of mineral and addition of mercury had not a significant effect on adsorption. All in all, the aquatic matrix was unchanged, due to the centrifugation of deactivated sludge after addition of mercury sulfate.
2.3 Adsorption experiments
All sets of adsorption experiments were carried out in Erlenmeyer shake flasks in temperature control incubator with the shacking rate of 150 rpm. The experiments were divided into five categories:
1. Determination of the adsorption equilibrium time of three TrOCs for the sludge and HA was the first priority. Accordingly, the first set of experiment was performed by adding 10 g TS/L of
sludge or 0.5 g HA/L, in the presence of 500 µg/L of DEHP, FLAN and CBZ. The flask was shaken at 150 rpm, at pH 7.4± 0.2, and 22± 2 ˚C. The samples were regularly taken at specific time intervals (0; 0.5; 1; 2; 3; 4; 5; 6;12 and 24 h). The residual concentration of TrOCs in the supernatant was analyzed in the activated and deactivated sludge to determine the biodegradation rate. For volatilization, on the other hand, a solution without sludge was considered as a negative control sample. Centrifugation at 9000 rpm for 10 min was performed for separation of the sludge and HA. It is worth mentioning that for precipitation of HA, samples containing should be acidified (pH<2).
2. TrOCs adsorption kinetic experiments on the sludge and HA were the next set of experiments with the same condition as the pervious experiment, but with 5 gTS/L of sludge and in closer time interval till the equilibrium adsorption time (5, 10, 15, 20, 30, 40, 60, 80, 100, 120, 180 min, equilibrium time). Later, data was fitted into two pseudo first and second order kinetics.
3. The third set of experiments evaluated the isotherm adsorption capacity of sludge and HA. Different concentrations of DEHP, FLAN and CBZ were tested (1, 2, 3.5, 6 and 10 mg/L) in the exact conditions as the previous experiment for the equilibrium time. Data was interpolated into three different models (linear, Freundlich and Langmuir isotherm adsorption models) for further understanding of the adsorption mechanism. The adsorption capacity was also investigated on different pH (2, 4.8, 7.5, 9.2 and 12).
4. Evaluation of the thermodynamic parameters, such as Gibbs free energy (∆G◦), enthalpy (∆H◦) and entropy (∆S◦), which determines the adsorption reversibility and embedded mechanism of the physical or chemical adsorption. The condition in this set was equal to the third sets of experiments; yet, the temperature was varied in following sequence: 10, 17, 24, 29, 35, and 43 ˚C.
5. Presence of HA on the sludge adsorption capacity was the final set of experiments. Different HA concentration was firstly added to the solution of TrOCs with concentration of 500 µg/L. After reaching the equilibrium time, the specified mass of sludge was added to the solution to reach different ratio of HA vs sludge, varied in the range of 2.5 to 250 mg/g. Residual concentration of TrOCs and HA was measured in the supernatant after 24 hours (the adsorption equilibrium of HA-sludge). By comparing the residual concentration of TrOCs, with and without HA, its effect on the sludge adsorption capacity was evaluated.
2.4 Analysis of TrOCs and humic acid
After each set of experiments, samples were transferred from Erlenmeyer to centrifuge tubes, quickly centrifuged at 8000 rpm, 4°C for 30 min. The supernatant was stored in amber glass vials at 4°C before liquid-liquid extraction with dichloromethane. Around 200 mL of sample was vigorously shaken with 100 mL of DCM for five minutes in 1-L glass separation funnel. This process was duplicated for assuring the complete extraction of TrOCs from the aquatic into the organic phase. As the binding between DEHP, FLAN, CBZ and HA were reversible, adsorbed TrOCs could be readily extracted in the presence of DCM by L/L extraction [9]. Later on, the organic solution was transformed into rotary evaporator (Buchi Rotavapor, R-215, Rico Instrument Co., Switzerland) equipped with vacuum pump and cooling coil. All DCM was evaporated at 40 °C and vacuum of 180 KPa for around 15 minutes. Afterwards, residual TrOCs was thoroughly rinsed by 4 mL of DCM and transferred to two 1 mL amber vials for GC/MS analysis. N-Pentadecane with concentration of 5 mg/L, was added to each vial as an internal standard. The samples were later introduced to the gas chromatograph (GC/MS, Clarus-500, Perkin Elmer, USA) followed by HP-5ms mass spectrophotometry column (composition of 5% Phenyl and 95% dimethylpolysiloxane) with length of 30 m and diameter of 0.25 mm. Around
1.0 µL of the sample was evaporated by means of helium and flow rate of 1 mL/min. In order to have higher sensibility, just one out of ten portion of evaporated sample entered to the GC. Firstly, the temperature was kept at 80 ˚C for a minute to evaporate the solvent. The temperature was rise into 280 ˚C by the rate of 12 ˚C/min, in order to flash the column and made it ready for fragment of TrOCs. Finally, the temperature rose to 300 ˚C with the rate of 15 ˚C/min and rest for 1 minute to eliminate all the impurities. MS column was able to detect the fragment in the range of 45 to 300 m/z. The fragments 194, 101 and 149 m/z were selected as the reference peak for DEHP, FLAN, and CBZ, respectively.
Colorimetry (Lowry) method was used for measurement of the initial and residual humic acid on supernatant. The wavelength of 750 nm was selected, as it showed a neat correlation with standard. Copper sulfate was used for correcting the interference of dissolve organic matter [10]. It worth mentioning that, all experiment was duplicated and the average value of TrOCs, VS, TS, and HA concentration was considered on the following calculations and models.
3 Results and Discussion
3.1 Adsorption equilibrium time
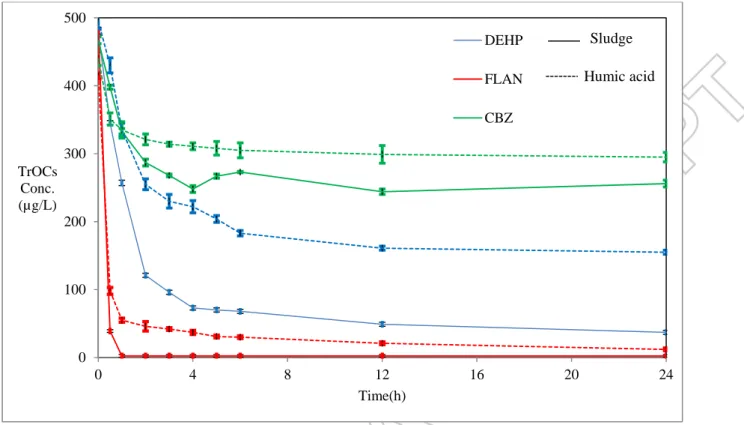
Like most physical and chemical processes, adsorption requires a special time interval to reach equilibrium. As the adsorption and desorption rates were exactly equal at the equilibrium, the residual aquatic concentration of TrOCs will be unchanged. Time interval of experiments, accordingly, was defined by the adsorption equilibrium time between DEHP, FLAN, CBZ, sludge, and HA. Continuous samples were taken during a day from the solution containing 10 g TS/L of sludge or 500 mg HA/L with initial concentration 500 µg/L of DEHP, FLAN, CBZ. The adsorption rate of FLAN on the sludge and HA (Figure 2) was very high with equilibrium time less than 45 min; besides, it took more than 4 hours for DEHP to reach the equilibrium with the
sludge. For HA/DEHP interaction, longer time interval was required for reaching the final equilibrium. From Figure 2, low adsorption capacity of CBZ on the organic matter could be also deduced, even though the adsorption equilibrium was rapid and occurred before 3 hours. In order to determine biosorption, pervious experiment was performed on the activated sludge (Data in supplement: Figure 3-S). The results showed that for DEHP, the activated sludge increased the adsorption capacity by just 4.6%, while no difference was detected for FLAN and CBZ. Higher adsorption affinity of the sludge for FLAN decreased the aquatic concentration so low that FLAN biodegradation inside the sludge had no effect on the adsorption capacity and availability of adsorption site. CBZ concentration on the other hand, was comparable in both biotic control and abiotic adsorption test, which indicated low biodegradation rate, as reported in literature [6]. As the concentration of FLAN rapidly declined, the sludge concentration was decreased from 10 g TS/L to around 5 gTS/L for the rest of our experiments.
3.2 Kinetic Study
The uptake rate of TrOCs into the sludge or DOM is a pivotal factor in their removal pathways in biological processes [11]. The kinetic results on this study were estimated by two major pseudo first and second order adsorption kinetic models. If the initial concentration has negligible effect on the rate of adsorption, it could be expected that the adsorption follows the pseudo first order kinetic model (equation 1):
= ( − ) (1)
where: qe and qt are the adsorption capacity of the equilibrium and specific time (t) with the unit
of µg adsorbate/g adsorbent, t stands for time (h) and k1 is the pseudo-first-order rate constant (h -1). The integration within specific boundaries will be required to interpolate the data and evaluate
= (2)
Previous studies, widely used this model to describe the adsorption of pollutants on the sludge [11, 12].
Pseudo-second-order model was mainly used for the adsorption mechanism that occurred on the surface of the adsorbent. As no partitioning occurred, the constant rate of the model, not only depended on the physical or chemical interaction of the adsorbate- adsorbent, the concentration of adsorbate also affected the adsorption rate. Therefore, this equation could be applied for the adsorption of metal on organic absorbent, as the strong surface bound between divalent metal and polar bond of organic adsorbent interrupted further partitioning(equation 3) [11].
= ( − ) (3)
Which given following equation after integration.
= + (4)
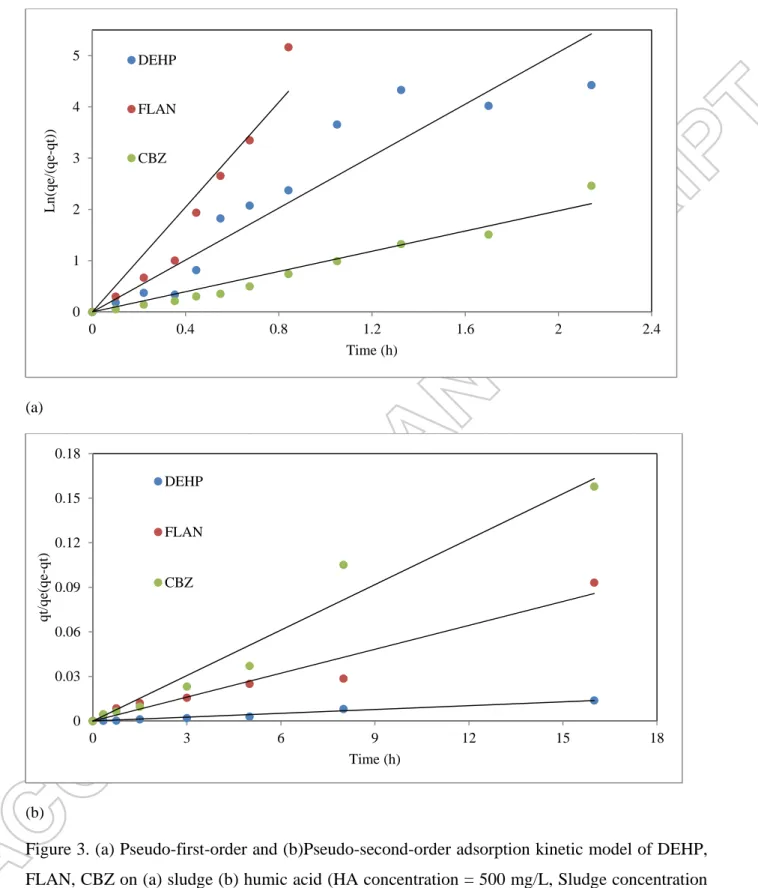
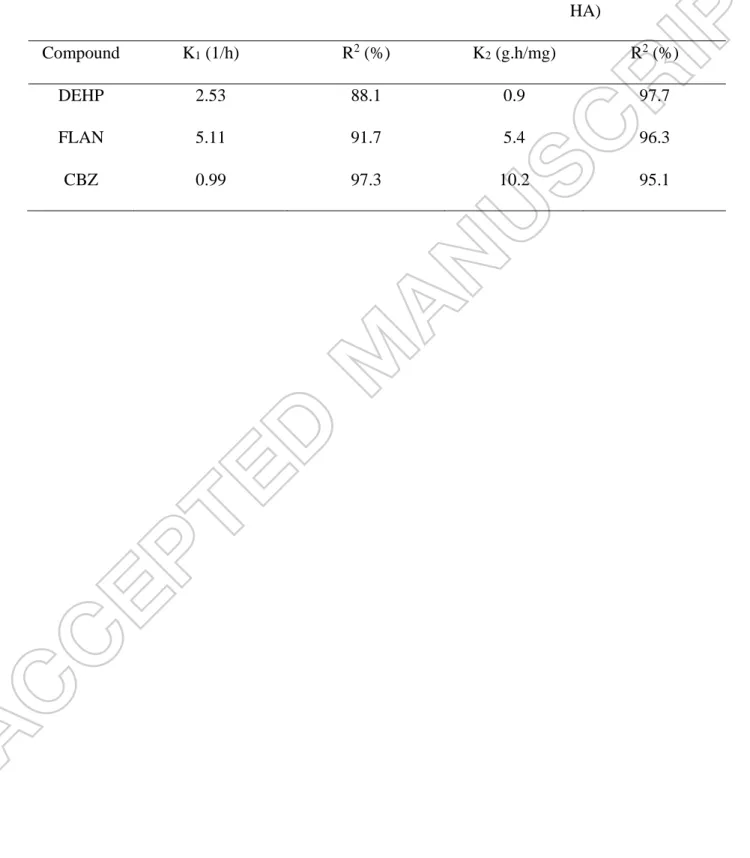
According to Figure 3-a, first order kinetics successfully fitted for all three TrOCs despite their charge and hydrophobicity. It could be concluded that the partitioning rate surpassed the surface uptake rate.The strength of interaction between the surface of sludge and pollutants is the only limiting reaction of adsorption kinetics. According to Arrhenius equation, the kinetic rate constant (k1) is a function of activation energy determines the strength of adsorption. Table 2
showed that k1 of FLAN was almost twice of DEHP and five times of CBZ. At neutral pH of
experiments, negative charge on the sludge surface was expected, based on its high pKa of 4.8, 6.9, and 9.4 [3, 13]. Hence, positively-charged FLAN strongly interacted with the negatively-charged sludge surface via strong electrostatic force. For neutral (CBZ) and negatively negatively-charged DEHP, hydrophobic interaction is the dominant mechanism [14].
At lower concentration, HA has no internal structure for partitioning of pollutants, supposedly, pseudo-second adsorption kinetics was a proper model (Figure 3-b). Surprisingly, CBZ had the highest rate constant (Table 2), even though the ratio of initial versus equilibrium concentration was 0.67. Presence of amide groups (-N-CO-NH2) in humic acid [13] has strong hydrogen
interaction with the same group in CBZ. This strong force, surpassed the hydrophobic interaction between DEHP and HA, and electrostatic interaction between FLAN and HA. However, small number of amide groups provided lower adsorption site. Fluoranthene has three aromatic groups that give a trigonal planar shape to its molecule, which not only interact rapidly and strongly, but also numeric aromatic groups of HA provide enough adsorption site.
It is worth mentioning that one kinetic model in some cases was not enough to determine the adsorption mechanism. As indicated by Chan, Lau [15], adsorption of DEHP on seaweed took place in two stages: (1) rapid uptake phase, followed by (2) gradual decrease in pollutant aquatic concentration.
Probably either empirical kinetic model could fit well enough, due to the inevitable uncertainty in the experimental procedure; yet, based on the structure of the sludge and HA, the proper model was chosen.
3.3 Effect of pH on the sludge adsorption capacity
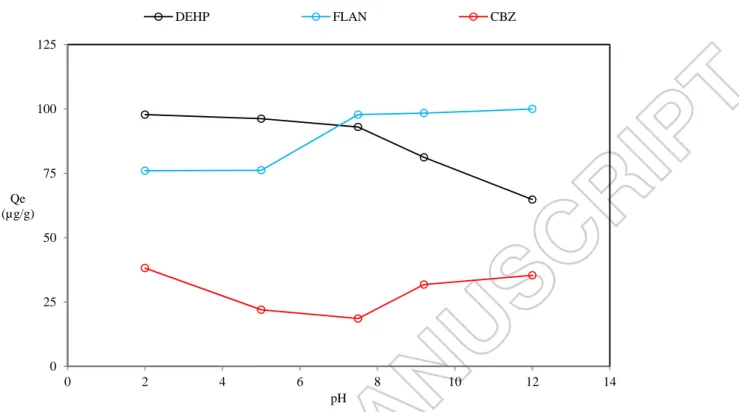
It has been reported that the pH could radically affect the adsorption capacity of sorbent [16, 17]. As shown in figure 4, affinity of DEHP into the sludge declined from 98 into 65 µg/g; while, the adsorption capacity of sludge was improved for FLAN. As mentioned before surface of the sludge contains three distinctive pKa. In pH less than 4.7, the surface of sludge has no negative charges. Therefore, the highest adsorption capacity was detected for negative charged DEHP. On the contrary, positively charged FLAN lost its affinity toward sludge. For pH higher than 9.4, the
sludge is highly negatively charged, which result in maximum interaction with FLAN and repulsion for DEHP [15]. As expected, the equilibrium concentration of CBZ is rarely changed, due to its high pKa. It remains neutral throughout all experiments in different pH.
3.4 Adsorption isotherm modeling
Adsorption isotherm models commonly describe the interaction of pollutants and adsorbent in the equilibrium (constant temperature and pH) [18]. Langmuir adsorption isotherm is a homogenous monolayer adsorption model with finite number of adsorption site without any interference between them described by equation 5:
= (5)
Further reconfiguration is required to measure Qmax and b represent for the maximum monolayer
capacity (mg/g), and Langmuir isotherm constant, respectively (equation 6) [16].
= + (6)
Separation factor ( ) as described in the following equation specifies the favorability of
adsorption process.
= (7)
If RL is larger than 1, the adsorption is unfavorable. As the value approaches zero, the adsorption
process will be more favorable, due to numerous interactions of adsorbate surface and pollutants.
It seems that Langmuir isotherm model suits perfectly the adsorption of pollutants on HA, as it has specified number of monolayer adsorption sites with almost identical adsorption energy. As seen in Table 3 (fitted results are provided in supplement: Figure 4-S), for these three pollutants,
Langmuir model was fitted with a correlation coefficient (R2) more than 0.95. As indicated by the maximum adsorption (Qmax) in Table 3, Fluoranthene had the highest affinity for adsorption;
carbamazepine, on the other hand, had the lowest interaction, due to its high solubility and low adsorption site with RL so close to 1 and negative value of Qmax which was not acceptable.
Freundlich isotherm model was also fitted for these compounds. Negligible value for Freundlich constant illustrated lower adsorption site of HA for CBZ, even though the adsorption kinetic constant was high.
Freundlich Isotherm model described non-uniform, multilayer adsorption model, in which the adsorption will occur from the strongest to the weakest binding sites. The mathematical model of Freundlich Isotherm is represented as:
= / (8)
in which Kf is the Freundlich isotherm constant and n is adsorption intensity. In order to linearize
the equation, following reconfiguration is necessary.
= + (9)
1/n>1 indicates cooperative adsorption, whereas the value between zero and 1 stands for chemisorption process. If the surface is more heterogeneous, the value moves closer to zero. The complexity of sludge groups provides multiple sorption sites with different free energy. For all the pollutants, Freundlich Isotherm model correlated with experimental results (data presented in Figure 5-S). As expected, the adsorption intensity of FLAN was the highest among three. By comparing Freundlich constant of DEHP adsorption on the sludge and HA (Table 3), it could be deduced that the adsorption capacity of DEHP was 10 times higher on HA than sludge.
Furthermore, the adsorption intensity of all TrOCs on HA was high, because of the chemical adhesion rather than physical adhesion of TrOCs and sludge. For CBZ, the adsorption capacity of HA was almost negligible, even though few adsorption sites had strong chemical interaction.
High adsorption capacity and intensity of HA in comparison with sludge was due to two main factors. Firstly, HA like sludge was negatively charged with site concentration of 37 times more than sludge in neutral pH [13]. Consequently, it could interact with positively charged TrOCs via electrostatic forces. Secondly, abundant carboxylic and phenolic functional groups as well as the hydrogen bound strongly interacted with the same group present in DEHP [19, 20, 21]. Langmuir model was not applicable for CBZ due to the negative value for Qmax. As discussed in
previous studies, many different adsorption isotherm models could be fitted to the experimental results; however, it should be selected based on the initial condition that the model derived from [22].
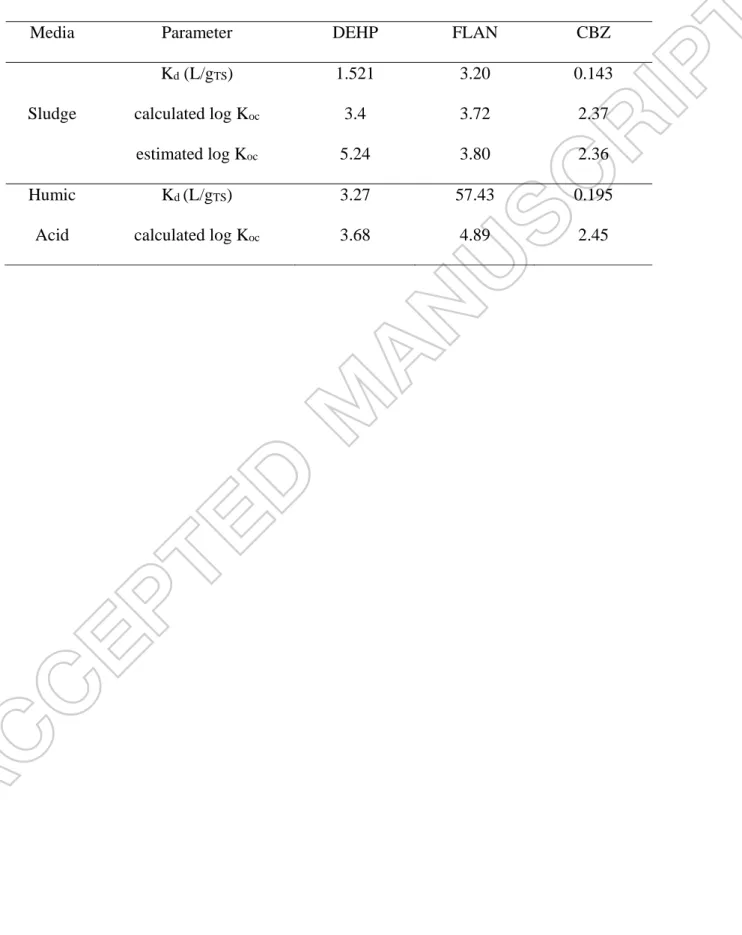
3.5 Solid/liquid partitioning
The sorption process potentially depended on carbon content of the sorbent according to the following equation:
= (10)
In which Kd is the solid/liquid partitioning factor of compound (L/kg TS), Koc is the organic
carbon distribution coefficient and foc is the carbon fraction of sludge. Kd indicates the affinity of
compounds for the adsorption on sludge. Compounds with Kd lower than 100 L/kg have lower
adsorption potential [14], while adsorption could be considered as the main removal pathway for compounds with solid/liquid partitioning factor larger than a thousand.
= (11)
The carbon fraction of the sludge and HA were 61 and 69%, respectively. Accordingly, Koc of
free organic compounds was calculated and the results were presented in Table 4.
Previously, researchers tried to correlate the organic carbon distribution coefficient of wide family of TrOCs based on their physical and chemical characteristic. As the detection methods have been more sophisticated and larger family of emerging contaminants have to be taken into the account, the models are becoming more precise and accurate. Obviously accurate approximation of Koc factor leads to evaluate solid/liquid partitioning of emerging contaminants
in wastewater without passing through time consuming experiments. Generally Koc factor could
be connected based on the hydrophobicity of compounds (equation 12) [7].
log = + (12)
Latest extrapolation of different pharmaceutical compounds adsorption on the sludge led to calculation of constant value of a and b which are 0.602 and 0.695, respectively [14]. By comparing the estimated and calculated values, it was deduced that the model satisfyingly predicted the value of Koc within 1 log unit for neutral and positive charged compounds (CBZ
and FLAN); however, it is not sufficiently predictable for the negative-charged DEHP (Table 4). By repeating the same experiment for prevalent DOM in wastewater, the value of a and b parameter could be revised.
3.6 Thermodynamic Approach
Calculation of thermodynamic parameters, such as: enthalpy (ΔH), entropy (ΔS) and Gibbs free energy (ΔG) of adsorption requires the thermodynamic equilibrium constant (K0) variation at
equilibrium of adsorption/desorption, the slope of 1/qe vs 1/Ce was taken to the account for the calculation of thermodynamic equilibrium constant (K ). The value of K0 could be also taken
from Freundlich model by plotting Ln qe/Ce vs Ce and extrapolation of Ce towards zero. However, the thermodynamic deficiency of this model has been widely reported [24]. Free Gibbs energy, was then measured by following equation:
ΔG = ΔH − TΔS = −RT LnK (13)
In which R is the universal gas constant (8.314 J/mol/K) and T stands for temperature (K) [23]. The average concentration of ΔH and ΔS was measured by fitting the data in Ln K0 vs 1/T.
Thermodynamic parameters are calculated in Table 5 except CBZ, as its adsorption was unfavorable (negative value of K0). For both FLAN and DEHP, negative values of free Gibbs
energy represented spontaneous adsorption in all temperatures. The positive value of ΔG for CBZ was the reason of its non-biodegradability. Furthermore, DEHP and FLAN adsorption were exothermic, due to the negative value of enthalpies and showed energetic stability of adsorption [23]. Yet, their low value demonstrated weak interactions, such as van der Waals or hydrogen bounds, rather than hydration [1]. The physico-sorption (cooperative) was also obtained by Freundlich isotherm model (Table 3). As the temperature increases, the adsorption of DEHP on sludge was facilitated; while the adsorption capacity for FLAN apparently decreased. It could be concluded that rising temperature is not in the favor of electrostatic interaction; yet, it improved hydrophobic interaction. Finally, negative values of ΔS decreased the freedom degree of hydrophobic molecules that resulted in their immobilization on sludge.
3.7 Effect of humic acid on adsorption
Adsorption of hydrophobic compounds into the DOM significantly increases their concentration in wastewater than in pure water. Therefore, not binary but ternary interaction of sludge-humic acid-hydrophobic TrOCs should be considered. Retention of TrOCs is the most desirable scenario, which hypothetically occurred by both adsorption of HA by the sludge and/or dissociation of TrOCs from HA into the sludge. Two set of experiments, accordingly, were performed to understand the mechanism of mentioned processes. For the first set of experiments, HA adsorption isotherm was modeled. The concentration of HA was changed from 10 to 1000 mg/L, while the concentration of sludge was remained at 5 gTS/L. By escaping experiments of 10 and 20 mg/L, because of low equilibrium concentration, data was fitted perfectly with both adsorption models (data presented in Figure 6-S), even though portioning of HA on sludge is not probable and the adsorption should follow monolayer surface mechanism.
As shown in Table 3, the adsorption of HA on sludge was favorable with very low RL in
comparison with even positive charged hydrophobic compounds. According to the value of Qmax,
70 mg of HA could adsorb to a gram of sludge. Although it was widely accepted that the adsorption of TrOCs on DOM negatively affected their biodegradation, and increased their mobility in environmental media [25], it could surprisingly enhance the removal of hydrophobic TrOCs at low concentration of recalcitrant DOM. For the second hypothesis, different concentration of TrOCs, HA and sludge was tested (Data was presented in supplement: Table 2-S). Wastewater containing DOM provided enough time for different TrOCs to reach its equilibrium. Consequently, different amount of HA was added to the solution containing 500 µg/L of DEHP and FLAN. After reaching the equilibrium, 5 g/L of sludge was added to resemble biological treatment. Removal by the desorption was calculated by the difference
between the final concentration of TrOCs in HA in the presence of absence of sludge (equation 14).
(%) = × 100 (14)
In which CTrOC-HA stands for concentration of TrOCs adsorbed by HA at equilibrium, C0 and Cf
are the initial and final concentration of TrOCs.
According to DEHP and FLAN final concentration, the removal by the adsorption and desorption of compounds from HA on sludge was measured and presented in Figure 4. Increasing the concentration of HA gradually decreased the effect of the first scenario and enhanced desorption of DEHP and FLAN from HA into the sludge.
Desorption of FLAN was higher than DEHP, as FLAN electrostatically interacted with humic acid; hence, higher density of negative charge on the surface of sludge facilitated desorption. For DEHP, on the other hand, higher adsorption intensity was observed in HA than the sludge, due to chemical and hydrogen bounds.
At low concentration of, the sludge adsorption capacity was well suited for the removal of humic acid and hydrophobic or positively charged TrOCs adsorbed on it. For higher concentration, the effect of desorption was more pronounced due to higher interaction of the HA and sludge.
4 Conclusion
Prediction of adsorption behavior of TrOCs on the sludge mainly depended on their charge and hydrophobicity. Correlation of neutral TrOCs is widely accepted according to their log Kow; however, dominance of electrostatic forces for ionic TrOCs governed the behavior of sorption, which leaves no trend for the adsorption, especially for those with negative charges. Sludge adsorption kinetic constant and Freundlich isotherm constant of FLAN was twice than DEHP indicated that electrostatic interaction had the major importance on the sludge adsorption capacity. Although adsorption rate was very fast for CBZ (K2 of 10.22), sludge adsorption
capacity for CBZ was very low (Kf of 0.19). Humic acid on the other hand showed no interaction
with hydrophilic TrOCs, though its adsorption intensity was almost 6 times than sludge for both DEHP and FLAN. The presence of humic acid increased the mobility of positively charged, and hydrophobic compounds in the environment, since 70.4 mg of humic acid adsorbed by a gram of sludge. As the desorption of FLAN and DEHP from humic acid into the sludge never rises more than 7 and 20%, respectively, its adsorption of humic acid onto the sludge was the only removal pathway of TrOCs in biological treatment.
Acknowledgement
Sincere thanks are accrued to the National Sciences and Engineering Research Council of Canada (NSERC Grant Number: I2IPJ 461378) for their financial contribution to this study.
5 References
1. Seyhi B, Drogui P, Buelna G, Blais JF. Modeling of sorption of bisphenol A in sludge obtained from a membrane bioreactor process. Chemical Engineering Journal. 2011;172:61-7.
2. Zolfaghari M, Drogui P, Seyhi B, Brar S, Buelna G, Dubé R. Occurrence, fate and effects of di (2-ethylhexyl) phthalate in wastewater treatment plants: a review. Environmental Pollution. 2014;194:281-93.
3. Hörsing M, Ledin A, Grabic R, Fick J, Tysklind M, Jansen JlC, Andersen HR. Determination of sorption of seventy-five pharmaceuticals in sewage sludge. Water research. 2011;45:4470-82.
4. Jelic A, Gros M, Ginebreda A, Cespedes-Sánchez R, Ventura F, Petrovic M, Barcelo D. Occurrence, partition and removal of pharmaceuticals in sewage water and sludge during wastewater treatment. Water research. 2011;45:1165-76.
5. Manoli E, Samara C. Polycyclic aromatic hydrocarbons in natural waters: sources, occurrence and analysis. TrAC Trends in Analytical Chemistry. 1999;18:417-28.
6. Clara M, Strenn B, Kreuzinger N. Carbamazepine as a possible anthropogenic marker in the aquatic environment: investigations on the behaviour of Carbamazepine in wastewater treatment and during groundwater infiltration. Water research. 2004;38:947-54. Epub 2004/02/11.
7. Hyland KC, Dickenson ERV, Drewes JE, Higgins CP. Sorption of ionized and neutral emerging trace organic compounds onto activated sludge from different wastewater treatment configurations. Water research. 2012;46:1958-68.
8. USEPA. Standard methods for the examination of water and wastewater: selected analytical methods approved and cited by the United States Environmental Protection Agency, American Public Health Association, American Water Works Association: American Public Health Association; 1981. 9. Akkanen J, Penttinen S, Haitzer M, Kukkonen JVK. Bioavailability of atrazine, pyrene and benzo[a]pyrene in European river waters. Chemosphere. 2001;45:453-62.
10. Frolund B, Griebe T, Nielsen P. Enzymatic activity in the activated-sludge floc matrix. Applied Microbiology and Biotechnology. 1995;43:755-61.
11. Qiu H, Lv L, Pan B-c, Zhang Q-j, Zhang W-m, Zhang Q-x. Critical review in adsorption kinetic models. Journal of Zhejiang University SCIENCE A. 2009;10:716-24.
12. Ocampo-Pérez R, Rivera-Utrilla J, Gómez-Pacheco C, Sánchez-Polo M, López-Peñalver J. Kinetic study of tetracycline adsorption on sludge-derived adsorbents in aqueous phase. Chemical engineering journal. 2012;213:88-96.
13. Wightman PG, Fein JB. Ternary interactions in a humic acid–Cd–bacteria system. Chemical Geology. 2001;180:55-65.
14. Stevens-Garmon J, Drewes JE, Khan SJ, McDonald JA, Dickenson ERV. Sorption of emerging trace organic compounds onto wastewater sludge solids. Water research. 2011;45:3417-26.
15. Chan H, Lau T, Ang P, Wu M, Wong P. Biosorption of di (2-ethylhexyl) phthalate by seaweed biomass. Journal of applied phycology. 2004;16:263-74.
16. Balarak D, Jaafari J, Hassani G, Mahdavi Y, Tyagi I, Agarwal S, Gupta VK. The use of low-cost adsorbent (Canola residues) for the adsorption of methylene blue from aqueous solution: Isotherm, kinetic and thermodynamic studies. Colloids and Interface Science Communications. 2015;7:16-9.
17. Chan C, Wong K, Chung W, Chow T, Wong P. Photocatalytic degradation of di (2-ethylhexyl) phthalate adsorbed by chitin A. Water Science & Technology. 2007;56.
18. Foo KY, Hameed BH. Insights into the modeling of adsorption isotherm systems. Chemical Engineering Journal. 2010;156:2-10.
19. Feng H-J, Hu L-F, Mahmood Q, Long Y, Shen D-S. Study on biosorption of humic acid by activated sludge. Biochemical Engineering Journal. 2008;39:478-85.
20. Vinken R, Hllrigl-Rosta A, Schmidt B, Schffer A, Corvini P. Bioavailability of a nonylphenol isomer in dependence on the association to dissolved humic substances. Water Science & Technology. 2004;50:277-83.
21. Zheng Z, He P-J, Shao L-M, Lee D-J. Phthalic acid esters in dissolved fractions of landfill leachates. Water research. 2007;41:4696-702.
22. Mittal A, Mittal J, Malviya A, Gupta VK. Adsorptive removal of hazardous anionic dye “Congo red” from wastewater using waste materials and recovery by desorption. Journal of Colloid and Interface Science. 2009;340:16-26.
23. Biggar J, Cheung M. Adsorption of picloram (4-amino-3, 5, 6-trichloropicolinic acid) on Panoche, Ephrata, and Palouse soils: a thermodynamic approach to the adsorption mechanism. Soil Science Society of America Journal. 1973;37:863-8.
24. Shahbeig H, Bagheri N, Ghorbanian SA, Hallajisani A, Poorkarimi S. A new adsorption isotherm model of aqueous solutions on granular activated carbon. World J Modell Simul. 2013;9:243-54.
25. Haitzer M, Höss S, Traunspurger W, Steinberg C. Relationship between concentration of dissolved organic matter (DOM) and the effect of DOM on the bioconcentration of benzo [a] pyrene. Aquatic toxicology. 1999;45:147-58.
Figure 1: Hypothetical pathway of emerging contaminants in secondary treatment of ordinary wastewater treatment plants (consider aeration process), according to their volatility, biodegradability, charge and hydrophobicity.
Figure 2. Adsorption equilibrium time of DEHP, FLAN, CBZ on sludge and humic acid (Sludge concentration = 10 gTS/L, Humic acid concentration =500 mg/L, initial concentration of TrOCs = 500 µg/L, Temperature = 21±1 ˚C, pH =7.4±0.2, Shaking rate = 150 rpm).
0 100 200 300 400 500 0 4 8 12 16 20 24 TrOCs Conc. (µg/L) Time(h) DEHP FLAN CBZ Sludge Humic acid
(a)
(b)
Figure 3. (a) Pseudo-first-order and (b)Pseudo-second-order adsorption kinetic model of DEHP, FLAN, CBZ on (a) sludge (b) humic acid (HA concentration = 500 mg/L, Sludge concentration = 5 gTS/L, initial concentration of TrOCs = 500 µg/L, temperature = 21±1 ˚C, pH =7.4±0.2, shaking rate = 150 rpm). 0 1 2 3 4 5 0 0.4 0.8 1.2 1.6 2 2.4 Ln (q e/(q e-q t)) Time (h) DEHP FLAN CBZ 0 0.03 0.06 0.09 0.12 0.15 0.18 0 3 6 9 12 15 18 qt/q e( q e-q t) Time (h) DEHP FLAN CBZ
Figure 4. Effect of pH on the adsorption capacity of DEHP, FLAN and CBZ on the sludge (Initial concentration of sludge = 5 gTS/L, TrOCs concentration = 500 µg/L, temperature = 22 ˚C). 0 25 50 75 100 125 0 2 4 6 8 10 12 14 Qe (µg/g) pH DEHP FLAN CBZ
Figure 5. Adsorption of DEHP and FLAN on the sludge in the presence of humic acid (Initial concentration of sludge = 5 gTS/L, TrOCs concentration = 500 µg/L, temperature = 22 ˚C, pH = 7.4). 0 5 10 15 20 25 30 0 40 80 120 160 200 5.0 50.0 500.0 Desorption Fraction (%) TrOCs Final Conc. (µg/L) HA Conc. (mg/L)
Table 1. The main chemical and physical characteristics of DEHP, FLAN and CBZ 1, 2.
Parameter Compound
DEHP FLAN CBZ
Chemical formula C24H38O4 C16H10 C15H12N2O
Molecular Weight (g/mol) 390.56 202.26 236.27
Solubility (µg/L) 3 265 17,700
Log Kow 7.55 5.16 2.77
pKa -6.7 >15 13.9
Melting Point (˚C) -55 107.8 190.2
Vapor Pressure (mmHg) ×10-7 @ 25 ˚C 1.42 92.2 1.8
Hydrogen Bond Acceptor 4 0 1
Hydrogen Bond Donor 0 0 1
Charge Negative Positive Neutral
1
pubchem (2015)
Table 2. Rate constant of kinetics model for adsorption of TrOCs on sludge and humic acid.
1st Order Kinetic Model (TrOCs-Sludge)
2ed Order Kinetic Model
(TrOCs-HA)
Compound K1 (1/h) R2 (%) K2 (g.h/mg) R2 (%)
DEHP 2.53 88.1 0.9 97.7
FLAN 5.11 91.7 5.4 96.3
Table 3. Constant of isotherm adsorption model of ternary system of TrOCs, sludge and humic acid.
Freundlich Isotherm Model Langmuir Isotherm Model
Compound Kf (mg1-n.Ln/g) n R2 (%) Qmax (mg/g) b(L/mg) RL R2 (%) TrOCs-Sludge DEHP 1.13 1.55 95.2 0.64 9.33 0.176 91 FLAN 2.27 1.78 93.7 2.28 6.13 0.246 95.3 CBZ 0.19 0.69 86.8 Not applicable TrOCs-HA DEHP 0.50 0.76 82.5 4.28 0.77 0.96 84.8 FLAN 29.1 0.86 95.1 14.04 3.12 0.865 97.9 CBZ 2.25 ×10⁻¹⁵ 0.15 84.6 Not applicable HA-Sludge 2.85 1.83 99.4 70.4 0.014 0.019 99
Table 4. Calculation and estimation of solid/liquid portioning factor and organic carbon distribution coefficient of DEHP and FLAN in the sludge and humic acid.
Media Parameter DEHP FLAN CBZ
Kd (L/gTS) 1.521 3.20 0.143
Sludge calculated log Koc 3.4 3.72 2.37
estimated log Koc 5.24 3.80 2.36
Humic Kd (L/gTS) 3.27 57.43 0.195
Table 5. Values of various thermodynamic parameters for adsorption of FLAN and DEHP on sludge. Temperature (˚C) 10 17 22 29 35 43 Parameter Compound ΔG (Cal/mol) DEHP -3600 -3812 -3940 -4140 -4462 -4741 FLAN -2734 -2335 -2212 -1990 -1428 -1155 ΔH (Cal/mol) DEHP -6252 FLAN -7900 ΔS (Cal/mol/K) DEHP -9.4 -8.4 -7.8 -7.0 -5.8 -4.8 FLAN -18.2 -19.1 -19.2 -19.5 -21 -21.3
Graphical Abstract
60 75 90 105 120 0 50 100 150 200 250 sl ud ge a ds or pt ion ca pa ci ty (µ g/ g)humic acid/ sludge ratio in sloution (mg/g)