OATAO is an open access repository that collects the work of Toulouse
researchers and makes it freely available over the web where possible
This is a Publisher’s version published in:
http://oatao.univ-toulouse.fr/25449
Official URL:
https://doi.org/10.1155/2015/485864
Any correspondence concerning this service should be sent
to the repository administrator:
[email protected]
To cite this version:
Levasseur-Garcia, Cécile
and Bailly, Sylviane
and Kleiber, Didier and Bailly,
Jean-Denis
Assessing Risk of Fumonisin Contamination in Maize Using
Near-Infrared Spectroscopy. (2015) Journal of Chemistry, 2015. 1-10. ISSN 2090-9063
Research Article
Assessing Risk of Fumonisin Contamination in Maize
Using Near-Infrared Spectroscopy
Cecile Levasseur-Garcia,
1,2Sylviane Bailly,
3,4Didier Kleiber,
5and Jean-Denis Bailly
3,41Universit´e de Toulouse, Ecole d’Ing´enieurs de Purpan, INPT, LCA, 31076 Toulouse Cedex 03, France 2INRA, UMR1010 CAI, 31030 Toulouse, France
3INRA, UMR1331, Research Centre in Food Toxicology (Toxalim), 31027 Toulouse, France 4Universit´e de Toulouse, ENVT, INP, Toxalim, 31076 Toulouse, France
5D´epartement Sciences Agronomiques et Agroalimentaires, Universit´e de Toulouse, Ecole d’Ing´enieurs de Purpan, INPT,
31076 Toulouse Cedex 03, France
Correspondence should be addressed to Cecile Levasseur-Garcia; [email protected] Received 6 January 2015; Revised 23 March 2015; Accepted 24 March 2015
Academic Editor: Leiqing Pan
Copyright © 2015 Cecile Levasseur-Garcia et al. This is an open access article distributed under the Creative Commons Attribution License, which permits unrestricted use, distribution, and reproduction in any medium, provided the original work is properly cited. Fumonisins are major mycotoxins found worldwide in maize and maize products. Because of their toxicity for both human and animals, European Union regulations were created to fix the maximal fumonisin B1 and B2 content allowed in foods and feeds. Unfortunately, directly measuring these mycotoxins by current analytical techniques is tedious and expensive and most measurement methods do not lend themselves to online control. Alternative approaches to chemical analysis have been developed and involve models that allow the mycotoxin contamination to be predicted based on environmental conditions and analysis by near-infrared (NIR) spectroscopy. In the present work, we use NIR spectroscopy to determine the fumonisin and fungal contents of 117 samples of maize. The determination coefficient between fumonisin and fungal-biomass content was 0.44. We establish herein a threshold for the number of CFUs for fungal biomass beyond which the fumonisin content is likely to exceed the European
regulatory level of 4000𝜇g/kg. In addition, we determine the fungal content by using a NIR-spectroscopy model that allows us to
sort samples of maize. Upon calibration, the percentage of well-classified samples was 96%, which compares favorably to the 82% obtained by independent verification.
1. Introduction
Fumonisins are the main mycotoxins produced by the fungi Fusarium verticillioides and F. proliferatum, which are found worldwide as contaminants of maize and maize byproducts
[1].
Fumonisin B1, the most toxic compound of the family, is suspected to be related to the increase in esophageal cancers
in some areas (e.g., China and South Africa) [2, 3] and
to the rising rate of neural tube defects reported in North
and Central America [4,5]. This compound is also hepatic
and nephrotoxic in many animal species [6]. Therefore, the
withdrawal of maize batches contaminated by this toxin is a major food-safety concern.
For human and animal health, the hazard associated with exposure to fumonisins led to the creation of European regu-lations and recommendations that fix the maximal tolerable
fumonisin content in foods and feeds, respectively [7,8].
Currently, the most commonly used methods to determine fumonisin contamination are based on high-performance liquid chromatography (HPLC) coupled with fluorescence detection and/or mass spectrometry and/or
enzyme-linked immunosorbent assays [9]. However, these
methods depend directly on how representative the sample is of the overall batch of feed or food. In fact, mycotoxin contamination is generally heterogeneous, and characterizing an entire batch of several tons of maize would require preparing many subsamples to form a representative sample Volume 2015, Article ID 485864, 10 pages
of the sanitary status of the entire lot. The cost and time required for such an analytical method limit its use for rapid screening of raw materials.
Thus, a dire need exists for alternative methods that would enable real-time screening of maize batches vis-`a-vis their fumonisin content thereby to determine their subsequent orientation toward human or animal feeding. Toward this end, other specific grain parameters could be used to indirectly predict fumonisin contamination. In fact, because mycotoxins are secondary fungal metabolites, their
production is directly linked with fungal development [10].
Therefore, the assessment of fungal contamination may be used to indirectly predict mycotoxin contamination; indeed, previous studies demonstrate that both fungal counts and ergosterol measurements could be used as indirect markers
to assess the risk of mycotoxin contamination [11,12].
Near-infrared spectroscopy (NIR) is now commonly
used to verify various quality parameters of cereals [13].
As detailed elsewhere, the NIR absorption spectrum of a substance is obtained from its optical parameters (reflectance, transmission, etc.) in the NIR. The interpretation of these spectra is based on the fact that molecules absorb specific NIR frequencies depending on the characteristics of their
structure [14].
To date, two main factors have hindered attempts to use NIRS to directly measure mycotoxin content in the field: (1) mycotoxins are present in quantities too small (in the order of parts per million) for direct detection. Their detection is thus associated with a complex ensemble of information related to the growth of the fungus on the cereal. (2) The associated prediction errors are too high to satisfy the European regulation EC number 1127/2007. For instance,
Vignola et al. [15] reported that 68% of the predicted values
lie within±𝜎 (where 𝜎 is the standard error of prediction)
of the mean predicted value, and 95% lie within±1.96𝜎. If
we consider, for example,𝜎 = 3610 𝜇g/kg [16], then NIR
of an uncharacterized sample would predict a contamination
level of±1.96 × 3610 𝜇g/kg. This would actually correspond
to 7000𝜇g/kg, whereas the European Union (EU) limit for
deoxynivalenol is 1750𝜇g/kg (EC number 1881/2006/CE).
The details for each study and the associated standard errors
of prediction were published by Levasseur-Garcia [17].
However, some recent studies demonstrated that NIR could be used to discriminate between fungal species grown in culture media, and NIR has even been used to differentiate
between toxigenic and nontoxigenic isolates [18,19].
There-fore, the aim of the present study is to evaluate NIR as an indirect method that uses fungal counts as indirect markers to assess the risk of fumonisin contamination in maize. For that, we characterized 117 samples of maize for fungal and fumonisin contamination by using both conventional methods and NIR.
2. Materials and Methods
2.1. General Procedure. Figure 1shows the general procedure
for classifying maize according to fumonisin content.
Fungal count, ergosterol, and fumonisins
contents Infrared spectra
Step 1 Step 2
Rules to classifiy maize into two categories of fumonisins (above or
Mathematical preprocessing Decision tree based on fungal count and
ergosterol content, to classify maize into two categories of fumonisins (above or below the
Discriminant analysis
below the EU limit of4000 𝜇g/kg)
EU limit of4000 𝜇g/kg)
Figure 1: Procedure for classifying maize according to fumonisin content.
This procedure involves two steps. The first step considers only the benchmark values obtained in the laboratory: the ergosterol content, the number of colony-forming units (CFUs), and the fumonisin concentration. In this first step, a sequence of rules is embedded in a decision tree to determine whether the fumonisin content in a batch of maize is above or below the European regulatory threshold for human
consumption (4000𝜇g/kg) [8]. A decision tree is a method
of classification that uses a tree-like model. It is a flowchart-like structure consisting of internal nodes, leaf nodes, and branches. Each internal node represents a test, each outgoing branch corresponds to a possible outcome of the test, and
each leaf node represents a class [20].
The second step is based on NIR. The spectra are first pro-cessed by mathematical algorithms and then are used as input into a discriminant analysis to automate the implementation of the decision tree from Step 1.
Our objective is to evaluate the fungal count and the ergosterol content as indirect indicators to efficiently predict whether the fumonisin content of a batch of maize is greater than or less than the EU limit. If this is possible, then rules must be created that allow users in the field to classify maize using fungal count and ergosterol content. In addition, these rules must be automated according to NIR spectra from maize samples.
Thus, the sequence of these two steps should constitute a model that, based on the NIR spectra, allows maize samples to be classified according to whether their fumonisin content is above or below the EU regulatory limit.
2.2. Chemicals. All solvents (methanol, ethanol, toluene, and acetonitrile) and reagents (O-phthalaldehyde, pyrogallol, and potassium hydroxide) used for mycotoxin and ergosterol measurements were analytic grade and were purchased from Prolabo (Paris, France).
2.3. Maize Samples. A total of 117 samples of maize were used in this study. Samples were harvested in 2007 in Italy, Denmark, France, Hungary, The Netherlands, and Poland.
Each sample consisted of 1.5 kg of grains dried at 40∘C. Two
0.750 kg subsamples were drawn from each sample. One subsample was used to quantify ergosterol, count CFUs, and
identify the fungal species. The other subsample (0.150 kg) was used for mycotoxin analysis and to collect the infrared spectra.
2.4. Determination of Fumonisin B1 Content. Fumonisin B1
(FB1) was quantified by HPLC as described previously [21].
Briefly, FB1 was extracted and purified as described by Le
Bars et al. [22]; namely, by mixing with 100 mL of
methanol-water solution (3 : 1) and grinding for 3 min in a Warring blender. After filtration by a fluted number 3 filter (Fioroni, VWR, Fontenay Sous Bois, France), 10 mL of the extract was applied to Bond-Elut SAX cartridges (500 mg, 2.8 mL; VWR, Fontenay Sous Bois, France) and eluted with 14 mL of acidified methanol (0.5% acetic acid). These extracts were evaporated to dryness under a gentle stream of nitrogen and then dissolved in methanol.
For HPLC quantification, 25𝜇L of extract or 25 𝜇L
of standard was derivatized with a mixture of 25𝜇L of
borate buffer (pH 8.3), 25𝜇L of water, and 25 𝜇L of
O-phthaldialdehyde (15 mM) and separated by HPLC with an M2200 pump (ICS, Toulouse, France), a Prontosil C18,
5𝜇m, 250 × 4 mm column equipped with a precolumn (ICS,
Toulouse, France), and an 8450 fluorescence HPLC monitor (Shimadzu, Kyoto, Japan). The HPLC used liquid-phase
NaH2PO4(0.1 M, pH 3.3)/methanol (25/75 v/v), a 1 mL/min
flow rate, a 10𝜇L injection volume, and fluorescence detection
at the excitation (emission) wavelength 335 nm (440 nm). The spectra were quantified by comparing the peak area measured by a Pic3 data system from ICS (Toulouse, France) with a standard calibration curve. The mean retention time was 7.5 and 17.5 min for FB1 and FB2, respectively. The quantification
limits were 0.1 and 0.2𝜇g/g for FB1 and FB2, respectively [23].
2.5. Fungal Contamination
2.5.1. Ergosterol Measurement. Ergosterol was quantified as
per Bailly et al. [24]. Fifteen grams of crushed grains were
mixed with 45 mL of methanol, 15 mL of ethanol, 60𝜇L
of pyrogallol, and 6 g of potassium hydroxide in a 250 mL round-bottom flask. The mixture was refluxed with agitation
at 80∘C for precisely 30 min and then quickly cooled in a water
bath to 20∘C. The extract was filtered through a GF/A 1.6𝜇m
Whatman paper and the ergosterol was extracted from 15 mL
of filtrate by petrol ether (2× 30 mL with 2 min of strong
mechanical agitation) and washed with acid water (pH = 2.5,
2× 30 mL with 2 min of strong mechanical agitation). The
petrol-ether extract was evaporated until no visible solvent
was present in the tube and then redissolved in 100𝜇L of
a 98/2 v/v toluene/acetonitrile solution. Three 𝜇L of the
solution was placed on a silica support plate and separated by migration in an 85/15 v/v toluene/acetonitrile solution. After
drying, the support plate was heated to 130∘C and held at this
temperature for 30 min to make the ergosterol fluorescent. A fluorodensitometer at 365 nm (Shimadzu CS930) was used to quantify the ergosterol concentration. Each extract was analyzed twice and was quantified by comparing with a standard calibration curve obtained from the same plate that was used for the samples.
2.5.2. Fungal Count and Identification. The fungal count of the maize samples was done according to the AFNOR norm
[25]. Briefly, 20 g of crushed sample was mixed with 180 mL
of tween 80 (0.05%) by mechanical agitation for 30 min.
Decimal dilutions (10−1 to 10−5) were prepared in tween 80
(0.05%). One hundred𝜇L of each dilution was inoculated in
Petri dishes containing a malt medium (2% agar, 2% malt, and 50 ppm chloramphenicol) and a salted malt medium (malt medium + 6% NaCl). Colony forming units (CFU)
were counted after 3 and 5 days of incubation at 25∘C, and
the results were expressed as number of CFU per gram of sample.
To further identify the fungal species, mycelia were planted out on potato dextrose agar (PDA) and grown at
25∘C. The identification was done by macro- and microscopic
examination of the isolates according to Raper and Fennel for
Aspergillus [26] and according to Nelson et al. for Fusarium
[27].
2.6. Near-Infrared-Spectroscopy Procedure. A near-infrared spectrometer (NIR Systems 6500, FOSS Tecator, Sweden) was used in reflectance mode to collect reflectance spectra of whole-maize samples over the spectral range 400–2498 nm. Each spectrum was obtained by averaging 32 scans, and the spectral resolution was 2 nm.
The spectra were collected at room temperature. Mea-surements were repeated three times and averaged for each sample. The spectra were used for multivariate analysis. The 117 samples were divided randomly into two sets: one set was for calibration to develop the model (100 samples) and one set (17 samples) was to test the model.
2.7. Statistical Analysis Step 1.
(i) Pearson’s Correlation. Pearson-correlation coefficients were used to find any significant relationships between the quantitative variables. The level of dissimilarities was fixed
at±0.5. Statistical analyses were done with XLSTAT version
2014.5.02 (Addinsoft, New York, USA).
(ii) Decision Tree. A chi-squared automatic interaction detec-tor (CHAID) decision tree was used to construct a statis-tical model from a given training dataset. In the CHAID technique, the first step is to create categories from the ergosterol content and fungal count. Next, a chi-squared test is used to determine the best split with which we predict whether, considering ergosterol content and fungal count, the fumonisin content is greater than or less than the EU limit. In the present work, we use the fumonisin content for human
consumption (i.e., 4000𝜇g/kg) [8].
The model was evaluated by using confusion matrices [28]. Table 1 shows the confusion matrix for a two-class classifier.
The prediction accuracy and classification error can be calculated from the number of samples belonging to
Table 1: Two-way confusion matrix.
Predicted by model
Negative (fumonisin content<4000 𝜇g/kg) Positive (fumonisin content>4000 𝜇g/kg)
Actual content
Negative (fumonisin content<4000 𝜇g/kg) 𝑎 𝑏
Positive (fumonisin content>4000 𝜇g/kg) 𝑐 𝑑
𝑎: number of correct negative predictions (maize samples with a mycotoxin content below the limit and properly classified); 𝑏: number of incorrect positive
predictions (maize samples with a mycotoxin content below the limit and improperly classified);𝑐: number of incorrect negative predictions (maize samples
with a mycotoxin content above the limit and improperly classified),𝑑: number of correct positive predictions (maize samples with a mycotoxin content above
the limit and properly classified).
the different categories indicated inTable 1[20]. The
predic-tion accuracy is obtained as follows:
Accuracy= (𝑎 + 𝑑)
(𝑎 + 𝑏 + 𝑐 + 𝑑). (1)
The classification error is obtained from the confusion matrix as follows:
Error= (𝑏 + 𝑐)
(𝑎 + 𝑏 + 𝑐 + 𝑑). (2)
The best model is defined as the model with the highest
accuracy and the lowest error. Samples in groups 𝑎 and 𝑑
are properly classified, whereas samples in groups𝑏 and 𝑐 are
not. Group𝑏 contains maize incorrectly predicted as positive.
These samples have mycotoxin content below the limit but are improperly classified as being above the limit. Samples
in group𝑐 have mycotoxin content above the limit and are
improperly classified as safe. Step 2.
(i) Multiplicative Scatter Correction. The spectra were pre-processed to remove the effects of light scattering and to
compensate for baseline offsets and bias [29]. Treating a
spectrum by multiplicative scatter correction (MSC) involves the following calculations:
𝑥org= 𝑏0+ 𝑏ref,1𝑥ref+ 𝑒,
𝑥corr =𝑥org− 𝑏0
𝑏ref,1 ,
(3)
where𝑏𝑖are the correction coefficients,𝑒 is the unmodeled
part, 𝑥org is the original spectrum, 𝑥ref is the reference
spectrum, and𝑥corris the corrected spectrum.
Preprocessing the MSC was done by using the Unscram-bler Multivariate Data Analysis (v. X; CAMO A/S, Oslo, Norway).
(ii) Principal Component Analysis. After preprocessing, a principal component analysis (PCA) was done to highlight sample clustering and to compress the spectral data. A PCA is an orthogonal transformation that converts the set of 1050 possibly correlated infrared variables (400–2498 nm, every 2 nm) into a set of linearly uncorrelated variables called principal components (PCs). PCA is defined so that the first
Table 2: Fungal contamination of 117 maize samples.
Fungal species Mycoflora content (log CFU/g)
Min. Max. Mean Occurrence (%)
Fusarium (total) ND∗ 6.3 5.37 97 F. verticillioides ND 6.3 5.32 90 F. proliferatum ND 5 3.69 38 F. subglutinans ND 5.6 3.23 59 F. oxysporum ND 2.95 0.95 2 F. poae ND 2.6 0.48 1 F. equisiti ND 3 1.15 3 F. graminearum ND 2 0.48 3 Aspergillus ND 4.33 2.61 56 Mucor ND 3.78 2.66 56 Penicillium ND 4.78 3.54 71 Yeast ND 4.3 3.08 50 Acremonium ND 5.48 4.25 69 Cladosporium ND 4.3 3.06 90
∗ND means “not detected”.
PC accounts for the maximum possible variability in the infrared spectra, with the subsequent principle components
accounting for less and less variability [30].
PCA was done by using the Unscrambler Multivariate Data Analysis (v. X; CAMO A/S, Oslo, Norway).
(iii) Quadratic Discriminant Analysis. The quadratic dis-criminant analysis is a nonlinear model that constructs a nonlinear boundary between principal components (PCs) and fumonisin class. For the decision tree, the model was
evaluated by using confusion matrices [20].
3. Results and Discussion
3.1. Fungal and Fumonisin Contamination of Maize Samples. One hundred and seventeen maize samples were charac-terized in terms of their fungal and fumonisin contamina-tion. The fungal content was simultaneously determined by counting CFUs, identifying fungal species and quantifying
ergosterol. The results are presented in Tables2and3.
The maize samples were mainly contaminated with fungal species belonging to the Fusarium genus, which were found in 97% of the maize samples. F. verticillioides was the most important species in terms of both occurrence and
Table 3: Ergosterol and fumonisins content of 117 maize samples.
Min. Max. Mean Standard deviation Samples above limit∗
Ergosterol content (mg/kg) 2.1 7.5 4.6 1.1 85%
Fumonisins content (𝜇g/kg) 60 9850 2509 2418 26%
∗ICMFS or European regulation.
0 2,000 4,000 6,000 8,000 10,000 0 1 2 3 4 5 6 7 8 9 10 11 12 13 14 15 16 17 18 19 20 Mycoflora content (UFC/g)
F u mo nisin co n ten t ( 𝜇 g/kg) ×105 R2= 0.4424
Figure 2: Relationship between fungal count and fumonisins contamination based on 117 samples of maize.
the number of CFUs, in agreement with reports for European
maize [31]. The average fungal count was far higher than
the maximum tolerance limits set by the International Com-mission on Microbiological Specification for Foods (ICMFS),
which is 10 000 CFU/g [32,33]. Only 15% of the samples had
fungal counts lower than the ICMSF limit.
The mean ergosterol content of the samples was 4.6 mg/kg with extreme values ranging from 2.1 to 7.5 mg/kg, which are
typical values for this type of cereal [34,35].
Table 3 summarizes the fumonisin content. FB1 was detected in all samples at concentrations ranging from 60
to 9850𝜇g/kg. Although such contamination is commonly
reported for European maize [35, 36], 26% of the
sam-ples exceeded European regulations for fumonisin content
(4000𝜇g/kg).
Step 1 (correlation between fumonisin and fungal contam-ination). To reliably sort maize according to the indirect markers of fumonisin contamination, we investigated the correlation between fumonisin content and markers of fungal contamination (i.e., ergosterol content and fungal count).
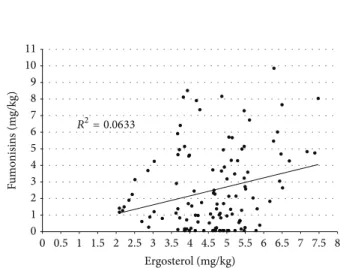
Figures 2 and 3 show the correlation obtained between
fumonisin content and fungal count or ergosterol respec-tively.
The coefficient of determination between fumonisin
con-tent and mycoflora (ergosterol) concon-tent is 0.44 with 𝑃 >
0.01 (0.06 with 𝑃 = 0.006). In the two situations, no clear regressions were obtained between the two variables. Thus, the ergosterol content is not proportional to the mycotoxin content. A weak fungal biomass combined with a relatively high level of mycotoxins is possible, as is the opposite. Of several other studies that focused on this subject, some concluded that a correlation exists between these variables
[11, 37–41], whereas others either made no conclusion or
0 1 2 3 4 5 6 7 8 9 10 11 0 0.5 1 1.5 2 2.5 3 3.5 4 4.5 5 5.5 6 6.5 7 7.5 8 F u mo nisin s (m g/kg) Ergosterol (mg/kg) R2= 0.0633
Figure 3: Relationship between ergosterol and fumonisins contam-ination based on 117 samples of maize.
concluded that no relationship exists, as is the case for the
present study [42–47]. This situation may be directly related
to the nature of the fungal flora present in the samples. Specifically, the organization of the fungal membranes, the physiology of the species, and especially the sporulation (number and size of spores) may cause the ergosterol con-centration to vary between fungal species, thereby leading to a nonlinear relationship between mycotoxin and ergosterol content. In the present study, the dominant species was Fusarium verticillioides, which is characterized by numerous small spores with weak ergosterol content. Such differences in ergosterol content between fungal species may explain the absence of a linear relationship between mycotoxin and ergosterol content. Nevertheless, because mycotoxin synthe-sis is directly related to fungal development, it is probable that a threshold for ergosterol content could be established whereby if the ergosterol content was below the threshold, the mycotoxin concentration would not exceed the regulatory limit.
Decision Tree Based on Fungal Count and Ergosterol Content to Classify Fumonisin Content of Maize as Either above
or below EU Limit of 4000𝜇g/kg. We used the CHAID
algorithm to create a classification tree to separate maize samples into two categories: one with a fumonisin content
greater than 4000𝜇g/kg and one with a fumonisin content
less than this limit. We used ergosterol content and fungal count as explanatory variables and fumonisin content as a binary dependent variable (above or below the EU limit of
4000𝜇g/kg).
After calculations, we used the software XLSTAT to check the results of the stages in which the decision tree
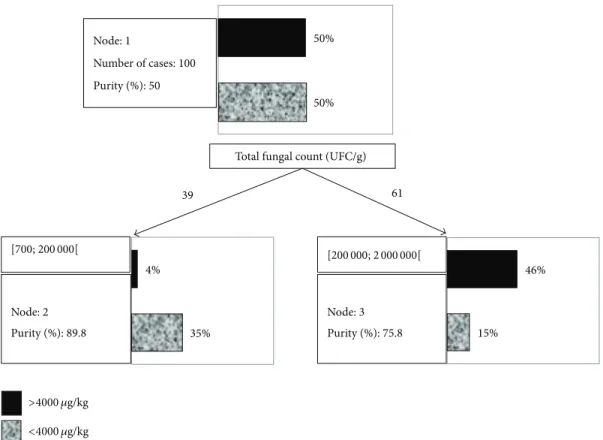
Node: 1 Number of cases: 100 Purity (%): 50 50% 50% Node: 2 Purity (%): 89.8 35% 4% Node: 3 Purity (%): 75.8 15% 46% Total fungal count (UFC/g)
39 61
>4000 𝜇g/kg <4000 𝜇g/kg
[700; 200 000[ [200 000; 2 000 000[
Figure 4: Binary decision tree obtained to predict fumonisin content (greater than or less than 4000𝜇g/kg) from ergosterol content and
fungal count.
Table 4: Confusion matrix for fumonisin contents with fungal count as sorting parameter.
From To
Fumonisin content<4000 𝜇g/kg Fumonisin content>4000 𝜇g/kg Total Well-classified samples
Calibration Fumonisin content<4000 𝜇g/kg 35 15 50 71% Fumonisin content>4000 𝜇g/kg 4 46 50 92% Total 39 61 100 81% Independent verification Fumonisin content<4000 𝜇g/kg 10 1 11 91% Fumonisin content>4000 𝜇g/kg 1 5 6 83% Total 11 6 17 88%
is automatically created and select the most stable tree (i.e., the tree that gives the best purity and called accuracy). The best split is the one that best separates the data into the two
groups (i.e., greater than and less than 4000𝜇g/kg), where a
single class predominates in each group. The measure used to evaluate a potential split is called “purity.” Thus, the best split is the one that results in the greatest increase in purity of the subsets. In addition, we automatically corrected the class weights.
In Figure 4, intermediate node-division conditions are given next to each node. This tree contains one decisive node (node 1) and two final nodes, called leaves (nodes 2 and 3). For each node, a histogram gives an overview of
the distribution of the decision variable (i.e., the number of maize samples with fumonisin content above or below the EU
threshold of 4000𝜇g/kg). The purity is also indicated for each
node, and the splitting attribute is the fungal count. Even if ergosterol was used as the explicative variable, it would not be sufficiently explicative compared with fungal count. The attribute used for splitting is 200 000 CFU/g. The resulting decision tree has a simple structure, and only a single question needs to be asked to classify a maize sample; namely, is its
fungal count above or below 200 000𝜇g/kg? The results of
applying this model are presented inTable 4.
Applying this detection method to 100 maize samples resulted in 71% of the samples with fumonisin content below
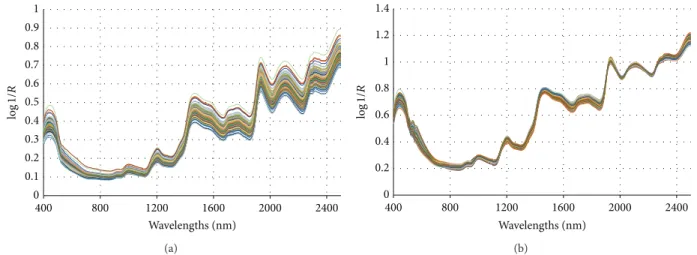
0 0.1 0.2 0.3 0.4 0.5 0.6 0.7 0.8 0.9 1 400 800 1200 1600 2000 2400 Wavelengths (nm) log 1/ R (a) 0 0.2 0.4 0.6 0.8 1 1.2 1.4 400 800 1200 1600 2000 2400 Wavelengths (nm) log 1/ R (b) Figure 5: (a) Raw and (b) MSC infrared spectra of 117 maize samples.
the EU limit being properly recognized as such, with this figure climbing to 92% for samples with a fumonisin content above the EU limit. Independent verification by using the 17 control samples resulted in 91% and 83%, respectively.
The content threshold of 200 000 CFU/g seems to be a good benchmark with which we assess fumonisin content in maize. The last step of this work, which we present in the following section, involves using NIRS to rapidly predict the CFU content of maize samples.
Step 2 (using NIRS to screen samples for risk of fumonisin contamination).
(i) Infrared Spectra of 117 Maize Samples.Figure 5(a)shows
the raw NIR spectra andFigure 5(b)shows the same spectra
preprocessed by MSC.
Figure 5(a) shows that the infrared-reflectance peaks
are broad and overlap each other. In Figure 5(b), small
differences appear in the infrared preprocessed spectra in three ranges: 400–900, 1500–1800, and 2300–2500 nm. These
differences are confirmed by the plot inFigure 6, which shows
the mean spectra of samples with fumonisin content above
and below the EU threshold of 4000𝜇g/kg.
Mycotoxins were present in the maize samples in quan-tities too small (on the order of parts per million) to allow
direct detection [17]. Thus, the variations between the spectra
shown in Figure 6 may be due to a complex ensemble of
information related to the growth of fungus on the cereal, which is related notably with modifications of the protein or carbohydrate level (starch, cellulose, etc.).
(ii) Principal Component Analysis. The entire spectrum (400– 2498 nm) was analyzed by PCA. The PCA model was built by
using twenty PCs.Figure 7shows a bidimensional
represen-tation of PC 1 and PC 2, which together account for 92% of the variance in the data. The first six PCs account for about 99% of the total variance in the spectra (65%, 27%, 3%, 1%, 1%, and 1%, resp.). All samples were labelled by their fumonisin status (i.e., above or below the EU regulatory threshold).
0 0.2 0.4 0.6 0.8 1 1.2 1.4 400 800 1200 1600 2000 2400 Wavelengths (nm) Fumonisin content< 4000 𝜇g/kg Fumonisin content> 4000 𝜇g/kg log 1/ R
Figure 6: NIR reflectance spectra for maize sample with fumonisin content above (solid line) and below (dashed line) the EU threshold.
Figure 7shows that the samples do not cluster within the two categories and no obvious outliers appear.
Figure 8shows the loadings of the first two PCs.
A higher loading means that the corresponding wave-length carries greater weight for explaining the variance in the
data. As shown inFigure 8, the wavelength ranges 400–600
and 1900–2500 nm are the most important for PC 1 because of higher loading in these ranges. For PC 2, the most important ranges are 400–600 and 1400–1900 nm.
The first six PCs are used as inputs for a discriminant analysis to discriminate between maize samples having fungal counts greater than and less than 200 000 CFU/g.
(iii) Discriminant Analysis. Starting from the six PCs of the NIR spectra, which together represent 99.9% of the variance, we used a quadratic discriminant analysis to determine if the fungal count of the sample was above or below the threshold of 200 000 CFU/g. Using NIRS to predict the fungal count
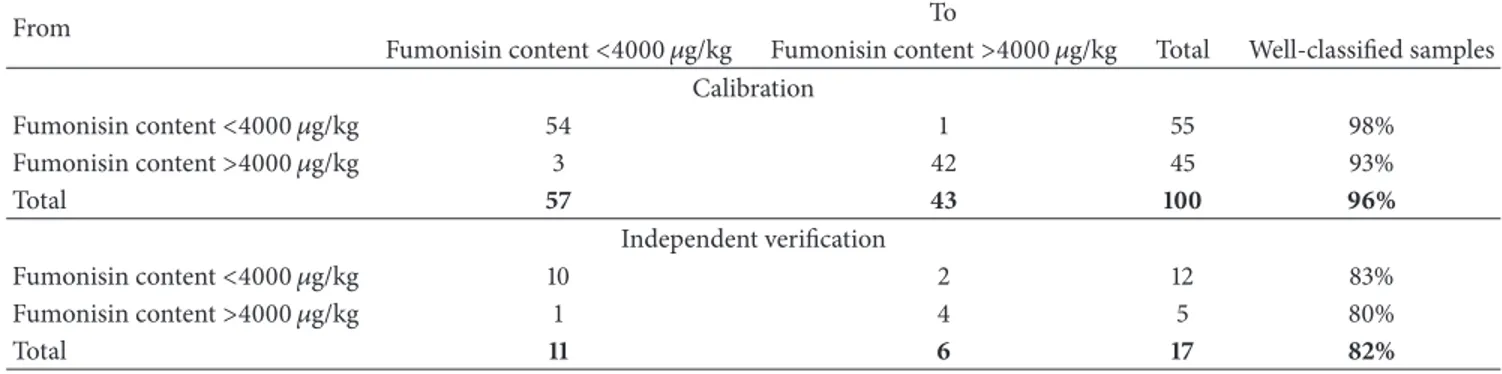
Table 5: Results of discriminant analysis based on NIRS to sort maize samples according to their risk of contamination with fumonisins.
From To
Fumonisin content<4000 𝜇g/kg Fumonisin content>4000 𝜇g/kg Total Well-classified samples
Calibration Fumonisin content<4000 𝜇g/kg 54 1 55 98% Fumonisin content>4000 𝜇g/kg 3 42 45 93% Total 57 43 100 96% Independent verification Fumonisin content<4000 𝜇g/kg 10 2 12 83% Fumonisin content>4000 𝜇g/kg 1 4 5 80% Total 11 6 17 82% 0 0.2 0.4 0.6 0.8 0 0.5 1 1.5 PC 2 (27%) PC 1 (65%) −0.6 −0.4 −0.2 −1 −0.5 Fumonisin content< 4000 𝜇g/kg Fumonisin content> 4000 𝜇g/kg Scores
Figure 7: Scatter plot of first two principal components (PC 1 and PC 2) for all spectra. The variance explained by each principal component is indicated in parentheses.
0 0.02 0.04 0.06 0.08 0.1 400 800 1200 1600 2000 2400 Wavelengths (nm) PC 1 −0.06 −0.04 −0.02 PC 2 log 1/ R
Figure 8: Loading-vector plot of first two principal components corresponding to the dataset constructed from the 117 maize samples.
summarizes the results obtained by using this method to sort maize samples according to their risk of fumonisin contamination.
Upon calibration, we found that 96% of the maize samples were properly classified, which compares favorably with the 82% properly classified by independent verification of the 17 control samples. In both cases, the number of false negatives was low: 3 out of 57 samples (5%) for the proposed calibration method and 1 out of 11 samples (9%) for the independent verification.
Models with which we classify maize contaminated by mycotoxins have been proposed by various authors.
Levasseur-Garcia et al. [48] summarize the main results for
classifying contaminated samples, with the targets being fun-gus, mycotoxin, or both. These works deal with the presence of Aspergillus, Fusarium, or Penicillium and the mycotoxins aflatoxin, deoxynivalenol, and fumonisins in samples of wheat, maize, or barley. Overall, the rate of proper classifi-cation is good to excellent, which underlines the interest in applying NIRS to the analysis of mycotoxin contamination in grains. However, most works in this area were done on grains that were individually scanned after artificial contamination, which can modify the final level of contamination and/or the interactions between grains, molds, and mycotoxins. The present study was done on relatively large samples (150 g) that were contaminated naturally and are therefore representative of real situations found in the field. In addition, the only
study that details false negatives is that of Gordon [49],
which reports a 4% rate of false negatives. We could probably decrease the rate of false negatives obtained in our work by increasing the number of samples used to construct our database.
Finally, these models may also allow industry to sort maize according to whether it is destined for human or animal consumption. Batches found to contain fumonisin content greater than the threshold established for human
consumption (i.e., 4000𝜇g/kg) can be oriented toward
ani-mal consumption, which has a higher regulatory threshold. Such sorting would improve food safety. The use of a rapid, nondestructive method to inspect grain would also allow grain to be sorted before being stocked in silos.
4. Conclusions
In this work, we searched for correlations in maize samples between mycotoxin content and markers of fungal con-tamination. We used these correlations to establish indirect markers of mycotoxin contamination, thereby allowing us to predict fumonisin contamination and thus to sort the maize samples accordingly. This study demonstrates that thresholds exist for fungal count that can be used to screen samples according to the risk of fumonisin contamination. In this study, all maize samples that exceeded the EU regulatory
limit for fumonisin content (4000𝜇g/kg) had a fungal count
over 200 000 CFU/g. Therefore, we used this threshold in an analysis by near-infrared spectroscopy (NIRS) to screen samples for fumonisin contamination.
This study demonstrates the potential of NIRS as a rapid method for screening maize samples according to their risk of fumonisin contamination. The models developed herein led to proper classification of 96% of the maize samples, versus 82% proper classification obtained by independent verification. Moreover, the number of false negatives (i.e., contaminated samples classified as safe) was low. Therefore, NIRS is a promising alternative to the time-consuming ana-lytical method that is currently used to determine mycotoxin content. With results available within 1 min, the proposed method may prove useful for rapid first screening of maize batches according to their risk of fumonisin contamination. The ultimate goal is to develop this technology into a tool for real-time screening of maize batches.
Conflict of Interests
The authors declare that there is no conflict of interests regarding the publication of this paper.
Acknowledgments
This work was partially financed by a grant from the Institut National Polytechnique de Toulouse (BQR Mycospir project) and the POCTEFA Project EFA 292/13 MYCOPREV.
References
[1] J. D. Miller, “Mycotoxins in small grains and maize: old problems, new challenges,” Food Additives & Contaminants, vol. 25, no. 2, pp. 219–230, 2008.
[2] G. Sun, S. Wang, X. Hu et al., “Fumonisin B1contamination of
home-grown corn in high-risk areas for esophageal and liver cancer in China,” Food Additives & Contaminants, vol. 24, no. 2, pp. 181–185, 2007.
[3] L. van der Westhuizen, G. S. Shephard, J. P. Rheeder, N. I. M. Somdyala, and W. F. O. Marasas, “Sphingoid base levels in humans consuming fumonisin-contaminated maize in rural areas of the former Transkei, South Africa: a cross-sectional study,” Food Additives and Contaminants, Part A, Chemistry,
Analysis, Control, Exposure and Risk Assessment, vol. 25, no. 11,
pp. 1385–1391, 2008.
[4] J. Gelineau-van Waes, K. A. Voss, V. L. Stevens, M. C. Speer, and R. T. Riley, “Maternal fumonisin exposure as a risk factor for
neural tube defects,” Advances in Food and Nutrition Research, vol. 56, pp. 145–181, 2009.
[5] R. T. Riley, E. Enongene, K. A. Voss et al., “Sphingolipid perturbations as mechanisms for fumonisin carcinogenesis,”
Environmental Health Perspectives, vol. 109, no. 2, pp. 301–308,
2001.
[6] H. Stockmann-Juvala and K. Savolainen, “A review of the toxic effects and mechanisms of action of fumonisin B1,” Human and
Experimental Toxicology, vol. 27, no. 11, pp. 799–809, 2008.
[7] European Commission, “Commission recommendation of 17 August 2006 on the presence of deoxynivalenol, zearalenone, ochratoxin A, T-2 and HT-2 and fumonisins in products intended for animal feeding (2006/576/EC),” Journal Officiel de
l’Union Europ´eenne, vol. L229, pp. 7–9, 2006.
[8] European Commission, “Commission Regulation (EC) No 1126/2007 of 28 September 2007 amending Regulation (EC) No 1881/2006 setting maximum levels for certain contaminants in foodstuffs as regards Fusarium toxins in maize and maize products,” Journal Officiel de l’Union Europ´eenne, vol. L255, pp. 14–17, 2007.
[9] C. M. Maragos and M. Busman, “Rapid and advanced tools for mycotoxin analysis: a review,” Food Additives & Contaminants,
Part A: Chemistry, Analysis, Control, Exposure & Risk Assess-ment, vol. 27, no. 5, pp. 688–700, 2010.
[10] S. Samapundo, F. Devliehgere, B. de Meulenaer, and J. Debevere, “Effect of water activity and temperature on growth and the relationship between fumonisin production and the radial growth of Fusarium verticillioides and Fusarium proliferatum on corn,” Journal of Food Protection, vol. 68, no. 5, pp. 1054–1059, 2005.
[11] C. Lamper, J. Teren, T. Bartok, R. Komoroczy, A. Mesterhazy, and F. Sagi, “Predicting DON contamination in Fusarium-infected wheat grains via determination of the ergosterol content,” Cereal Research Communications, vol. 28, no. 3, pp. 337–344, 2000.
[12] J. Perkowski, M. Wiwart, M. Bu´sko et al., “Fusarium toxins and total fungal biomass indicators in naturally contaminated wheat samples from north-eastern Poland in 2003,” Food Additives &
Contaminants, vol. 24, no. 11, pp. 1292–1298, 2007.
[13] D. Bertrand, “La spectroscopie proche infrarouge et ses appli-cations dans les industries de l’alimentation animale,” INRA
Productions Animales, vol. 15, no. 3, pp. 209–219, 2002.
[14] D. W. Sun, Ed., Infrared Spectroscopy for Food Quality Analysis
and Control, National University of Ireland, Dublin, Ireland,
Academic Press, Elsevier Science, 2009.
[15] F. Vignola, J. Michalsky, and T. Stoffel, Solar and Infrared
Radiation Measurements (Energy and the Environment), CRC
Press, New York, NY, USA, 2012.
[16] M. Beyer, F. Pogoda, F. K. Ronellenfitsch, L. Hoffmann, and T. Udelhoven, “Estimating deoxynivalenol contents of wheat samples containing different levels of Fusarium-damaged ker-nels by diffuse reflectance spectrometry and partial least square regression,” International Journal of Food Microbiology, vol. 142, no. 3, pp. 370–374, 2010.
[17] C. Levasseur-Garcia, “Infrared spectroscopy applied to identi-fication and detection of microorganisms and their metabolites on cereals (corn, wheat, and barley),” in Agricultural Science, D. G. Aflakpui, Ed., pp. 185–196, 2012.
[18] D. Garon, A. El Kaddoumi, A. Carayon, and C. Amiel, “FT-IR Spectroscopy for rapid differentiation of Aspergillus flavus,
Aspergillus fumigatus, Aspergillus parasiticus and
character-ization of aflatoxigenic Isolates collected from agricultural environments,” Mycopathologia, vol. 170, no. 2, pp. 131–142, 2010. [19] C. Levasseur, L. Pinson-Gadais, D. Kleiber, and O. Surel, “Near infrared spectroscopy used as a support to the diagnostic of Fusarium species,” Revue de Medecine Veterinaire, vol. 161, no. 10, pp. 438–444, 2010.
[20] S. Tuffery, Data Mining and Statistics for Decision Making, John Wiley & Sons, Hoboken, NJ, USA, 2007.
[21] J. D. Bailly, A. Querin, D. Tardieu, and P. Guerre, “Production and purification of fumonisins from a highly toxigenic Fusar-ium verticilloides strain,” Revue de Medecine Veterinaire, vol. 156, no. 11, pp. 547–554, 2005.
[22] J. Le Bars, P. Le Bars, J. Dupuy, and H. Boudra, “Biotic and abiotic factors in fumonisin B1 production and stability,” Journal
of the Association of Official Analytical Chemists, vol. 77, pp. 517–
521, 1994.
[23] L. G. Rice, P. F. Ross, J. Dejong, R. D. Plattner, and J. R. Coats, “Evaluation of a liquid chromatographic method for the determination of fumonisins in corn, poultry feed, and Fusarium culture material,” Journal of AOAC International, vol. 78, no. 4, pp. 1002–1009, 1995.
[24] J. D. Bailly, P. Le Bars, A. Pietri, G. Benard, and J. Le Bars, “Evaluation of a fluorodensitometric method for analysis of ergosterol as a fungal marker in compound feeds,” Journal of
Food Protection, vol. 62, no. 6, pp. 686–690, 1999.
[25] AFNOR, Aliment des animaux: d´enombrement des moisissures, Association Franc¸aise de Normalisation, Paris, France, 1983. [26] K. Raper and D. I. Fennel, The Genus Aspergillus 1965, Baltimore,
Williams and Wilkins, Baltimore, Md, USA, 1965.
[27] P. E. Nelson, T. A. Toussoun, and W. F. O. Marassas, Fusarium
Species: An Illustrated Manual for Identification, Pennsylvania
State University, State College, Pa, USA, 1983.
[28] S. Visa, B. Ramsay, A. Ralescu, and E. van der Knaap, “Confu-sion matrix-based feature selection,” in Proceedings of the 22nd
Midwest Artificial Intelligence and Cognitive Science Conference (MAICS ’11), pp. 120–127, Cincinnati, Ohio, USA, April 2011.
[29] J. P. Conzen, Multivariate Calibration. A Practical Guide for
Developing Methods in the Quantitative Analytical Chemistry,
Bruker Optik GmbH, Ettlingen, Germany, 2006.
[30] H. Martens and T. Naes, Multivariate Calibration, John Wiley & Sons, Chichester, UK, 1989.
[31] A. Ari˜no, T. Juan, G. Estopa˜nan, and J. F. Gonz´alez-Cabo, “Nat-ural occurrence of Fusarium species, fumonisin production by toxigenic strains, and concentrations of fumonisins B-1 and B-2 in conventional and organic maize grown in Spain,” Journal of
Food Protection, vol. 70, no. 1, pp. 151–156, 2007.
[32] L. L. F. Costa and V. M. Scussel, “Toxigenic fungi in beans (Phaseolus vulgaris L.) classes black and color cultivated in the State of Santa Catarina, Brazil,” Brazilian Journal of
Microbiol-ogy, vol. 33, no. 2, pp. 138–144, 2002.
[33] R. B. Orsi, B. Corrˆea, C. R. Possi et al., “Mycoflora and occurrence of fumonisins in freshly harvested and stored hybrid maize,” Journal of Stored Products Research, vol. 36, no. 1, pp. 75– 87, 2000.
[34] B. Cahagnier, Moisissures des Aliments peu Hydrat´es, Lavoisier, Paris, France, 1998.
[35] A. Pietri, T. Bertuzzi, L. Pallaroni, and G. Piva, “Occurrence of mycotoxins and ergosterol in maize harvested over 5 years in Northern Italy,” Food Additives & Contaminants, vol. 21, no. 5, pp. 479–487, 2004.
[36] K. A. Scudamore and S. Patel, “Occurrence of Fusarium
mycotoxins in maize imported into the UK, 2004–2007,” Food Additives and Contaminants Part A, vol. 26, no. 3, pp. 363–371,
2009.
[37] R. Le Bouquin, A. Lebrihi, F. Mathieu, F. Letournel, F. Gros-jean, and A. Guyonvarc’h, “D´etection et quantification des champignons mycotoxinog`enes par PCR en temps r´eel : est-ce un outil de pr´ediction des mycotoxines?” in Mycotoxines
Fusariennes des C´er´eales, Arcachon, France, September 2007.
[38] T. Miedaner, C. Reinbrecht, and A. G. Schilling, “Association among aggressiveness, fungal colonization, and mycotoxin production of 26 isolates of Fusarium graminearum in winter rye head blight,” Journal of Plant Diseases and Protection, vol. 107, no. 2, pp. 124–134, 2000.
[39] L. M. Seitz, H. E. Mohr, H. E. Burroughs, and D. B. Sauer, “Ergosterol as an indicator of fungal invasion in grains,” Cereal
Chemistry, vol. 54, no. 6, pp. 1207–1217, 1977.
[40] M. W. Wanyoike, F. Walker, and H. Buchenauer, “Relationship between virulence, fungal biomass and mycotoxin production by Fusarium graminearum in winter wheat head blight,” Journal
of Plant Diseases and Protection, vol. 109, no. 6, pp. 589–600,
2002.
[41] G. Zill, G. Engelhardt, and P. R. Wallnofer, “Determination of ergosterol as a measure of fungal growth using Si 60 HPLC,”
Zeitschrift Fur Lebensmittel-Untersuchung Und-Forschung, vol.
187, no. 3, pp. 246–249, 1988.
[42] M. Beyer, M. B. Klix, and J.-A. Verreet, “Estimating mycotoxin contents of Fusarium-damaged winter wheat kernels,”
Interna-tional Journal of Food Microbiology, vol. 119, no. 3, pp. 153–158,
2007.
[43] U. L. Diener and N. D. Davis, “Aflatoxins in corn,” Abstracts of
Papers of the American Chemical Society, vol. 184, SEP, p. 86,
1982.
[44] J. Gilbert, D. Abramson, B. Mccallum, and R. Clear, “Compari-son of Canadian Fusarium graminearum isolates for aggressive-ness, vegetative compatibility, and production of ergosterol and mycotoxins,” Mycopathologia, vol. 153, no. 4, pp. 209–215, 2002. [45] T. Nowicki, “CCF/CWFHB: Session 2—Toxicologie, qualit´e
du grain et impact sur l’industrie,” 2007,http://www.cwfhb.org/
programs/5 CWFHB 2007 Winnipeg.pdf.
[46] M. F. P. Moretzsohn de Castro, N. Bragagnolo, and S. R. de Toledo Valentini, “The relationship between fungi growth and aflatoxin production with ergosterol content of corn grains,”
Brazilian Journal of Microbiology, vol. 33, no. 1, pp. 22–26, 2002.
[47] J. Perkowski, T. Miedaner, H. H. Geiger, H.-M. Muller, and J. Chelkowski, “Occurrence of deoxynivalenol (DON), 3-acetyl-DON, zearalenone, and ergosterol in winter rye inoculated with
Fusarium culmorum,” Cereal Chemistry, vol. 72, no. 2, pp. 205–
209, 1995.
[48] C. Levasseur-Garcia, D. Kleiber, and O. Surel, “Infrared spec-troscopy used as a decision-making support for the determina-tion of fungal and mycotoxic risk,” Cahiers Agricultures, vol. 22, no. 3, pp. 216–227, 2013.
[49] S. H. Gordon, B. C. Wheeler, R. B. Schudy, D. T. Wicklow, and R. V. Greene, “Neural network pattern recognition of photoacoustic FTIR spectra and knowledge-based techniques for detection of mycotoxigenic fungi in food grains,” Journal of
Submit your manuscripts at
http://www.hindawi.com
Hindawi Publishing Corporation
http://www.hindawi.com Volume 2014
Inorganic Chemistry International Journal of
Hindawi Publishing Corporation
http://www.hindawi.com Volume 2014
Photoenergy
Hindawi Publishing Corporation
http://www.hindawi.com Volume 2014
Carbohydrate
Chemistry
International Journal of
Hindawi Publishing Corporation
http://www.hindawi.com Volume 2014
Journal of
Chemistry
Hindawi Publishing Corporation
http://www.hindawi.com Volume 2014
Physical Chemistry
Hindawi Publishing Corporation http://www.hindawi.com Analytical Methods in Chemistry Journal of Volume 2014 Bioinorganic Chemistry and Applications
Hindawi Publishing Corporation
http://www.hindawi.com Volume 2014
Spectroscopy
International Journal ofHindawi Publishing Corporation
http://www.hindawi.com Volume 2014
The Scientific
World Journal
Hindawi Publishing Corporation
http://www.hindawi.com Volume 2014
Medicinal Chemistry
Hindawi Publishing Corporation
http://www.hindawi.com Volume 2014
Chromatography Research International Hindawi Publishing Corporation
http://www.hindawi.com Volume 2014
Applied ChemistryJournal of
Hindawi Publishing Corporation
http://www.hindawi.com Volume 2014
Hindawi Publishing Corporation
http://www.hindawi.com Volume 2014 Theoretical Chemistry Journal of
Hindawi Publishing Corporation
http://www.hindawi.com Volume 2014
Journal of
Spectroscopy
Analytical Chemistry
Hindawi Publishing Corporation
http://www.hindawi.com Volume 2014
Journal of
Hindawi Publishing Corporation
http://www.hindawi.com Volume 2014 Quantum Chemistry
Hindawi Publishing Corporation
http://www.hindawi.com Volume 2014 International
Electrochemistry
International Journal ofHindawi Publishing Corporation
http://www.hindawi.com Volume 2014
Hindawi Publishing Corporation
http://www.hindawi.com Volume 2014