Open Archive TOULOUSE Archive Ouverte (OATAO)
OATAO is an open access repository that collects the work of Toulouse researchers and
makes it freely available over the web where possible.
This is an author-deposited version published in :
http://oatao.univ-toulouse.fr/
Eprints ID : 16654
To link to this article : DOI:10.1016/j.carbon.2016.05.010
URL :
http://dx.doi.org/10.1016/j.carbon.2016.05.010
To cite this version :
Moussa, Georges and Matei Ghimbeu, Camélia
and Taberna, Pierre-Louis and Simon, Patrice and Vix-Guterl,
Cathie Relationship between the carbon nano-onions (CNOs)
surface chemistry/defects and their capacitance in aqueous and
organic electrolytes. (2016) Carbon, vol. 105. pp. 628-637. ISSN
0008-6223
Any correspondence concerning this service should be sent to the repository
administrator:
staff-oatao@listes-diff.inp-toulouse.fr
Relationship between the carbon nano-onions (CNOs) surface
chemistry/defects and their capacitance in aqueous and organic
electrolytes
Georges Moussa
a,b,c, Cam!
elia Matei Ghimbeu
a,c,*, Pierre-Louis Taberna
b,c,
Patrice Simon
b,c, Cathie Vix-Guterl
a,caInstitut de Science des Mat!eriaux de Mulhouse (IS2M), UMR CNRS 7361, Universit!e de Haute Alsace, 15 rue Jean Starcky, 68057 Mulhouse, France bCentre Interuniversitaire de Recherche et d’Ing!enierie des Mat!eriaux(CIRIMAT), UMR CNRS 5085, Universit!e Paul Sabatier, 118 route de Narbonne, 31062
Toulouse, France
cR!eseau sur le Stockage Electrochimique de l’!energie (RS2E), FR CNRS 3459, 33 Rue Saint Leu, 80039 Amiens Cedex, France
a b s t r a c t
The effect of surface functionalities on the supercapacitors performances has been highlighted often in many works. However, studies devoted to the influence of carbon defects did not gain particular attention due to the difficulty to quantify such parameter. In this context, carbon nano-onions were used as model material in order to understand the influence of the surface chemistry (nature and amount of oxygen groups) and structural defects (active surface area, ASA) on the capacitance. Different types of thermal treatments in oxidizing or reducing atmospheres allowed to finely tune the surface chemistry and the ASA as demonstrated by temperature programmed desorption coupled with mass spectrometry (TPD-MS). For the first time, the presice control of these characteristics independently one of each other allowed to highlight an important influence of the carbon defects on the capacitance in organic and aqueous electrolytes which outbalance the oxygen functional group effect.
1. Introduction
During the past years, important scientific and industrial de-velopments have led to an extensive development of super-capacitors as electrochemical energy storage devices. Supercapacitors are environmentally friendly, of high safety and can be operated in a wide temperature range with a near-infinite long cycling life[1]. They exhibit high power density, which ex-plains their utilization in many applications requiring energy pulses during short periods of time (automobiles, tramways, buses, wind turbines etc)[2]. Depending on the charge storage mechanism, two types of supercapacitors can be defined[3]: EDLC (electrical double layer capacitors) and redox-based electrochemical capacitors [4e7]. In the first one, the charge is stored by reversible electro-static adsorption of ions at high surface area electrode/electrolyte
interface[8]while in redox-based electrochemical capacitors the storage is achieved through faradic processes [9]. In a first approach, energy density in EDLC is proportional to the electrode accessible surface area and therefore the electrode materials with large porous volume and high surface area are required[1]. Owing to their low cost, chemical stability and sustainable origin from natural/abundant sources, carbon materials are the most popular materials employed as electrodes for supercapacitor[3,5,10,11].
Since 2005, several studies have shown that not only the surface area but also the carbon pore size distribution (PSD) and the elec-trolyte ions size play an important role in carbon capacitance [3,12e21]. It was shown that the capacitance increases when the micropore size distribution approaches the bare electrolyte ions size[12,18]. In some cases, limitation of capacitance was observed due to the saturation of the carbon pores with ions or due to steric (volumetric) effects[19]. Aside, the presence of mesopores facili-tates the transport of electrolyte ions, acting as electrolyte reser-voir, thereby increasing the access of the electrolyte to the microporosity [22e24]. Therefore, the relationship between the textural properties of porous carbons and the capacitance are well
* Corresponding author. Institut de Science des Mat!eriaux de Mulhouse (IS2M), UMR CNRS 7361, Universit!e de Haute Alsace, 15 rue Jean Starcky, 68057 Mulhouse, France.
E-mail address:camelia.ghimbeu@uha.fr(C. Matei Ghimbeu).
described in the literature for all sorts of electrolytes (aqueous, organic and ionic liquids)[18,25].
Another important parameter known to influence the capaci-tance is the surface chemistry[26]. The presence of oxygen, sulfur, phosphorus and nitrogen based functional groups[27e29]in the carbon structure/surface leads to improvement of the capacitance through redox reactions with the electrolyte by so-called pseudo-capacitance mechanisms [4,7,30,31]. The presence of oxygen functionalities allows increasing the specific capacitance in aqueous electrolytes [28,29] while it might be detrimental in organic electrolytes, where irreversible redox reactions may take place between the electrolyte and oxygen groups [4,26]. The capacitance is influenced by the nature of oxygen groups (carbox-ylic, phenols, ethers…) but also by their amount. Oxidation by thermal treatment under air or by chemical treatments with spe-cific agents (H2O2, HNO3) led to the increase of the quantity of
surface oxygen groups, while heating under inert atmosphere (Ar, H2) is efficient to selectively remove some of these groups. While
the nature of oxygen groups may be assessed by several methods, including X-ray photoelectron spectroscopy (XPS), Fourier trans-form infrared spectroscopy (FTIR), titration and temperature-programmed desorption coupled with mass spectrometry (TPD-MS) [32e35], the quantification of functional groups in whole carbon material can be accurately determined only by TPD-MS.
Although the effect of surface functionalities groups on capaci-tance have been many times addressed in the literature and reviewed recently[10], works devoted to further understanding of the effect of carbon defects are scarce. Carbon defects such as dislocation, stacking faults or atom vacancies are mainly located in the edge planes of carbon and constitute the so-called active sites or active surface area (ASA)[36,37]. The ASA is an intrinsic struc-tural characteristic of graphitic carbon materials which can be quantified by oxygen chemisorptions at 300!C followed by TPD-MS
to quantify the formed CO and CO2groups, as described in detail
elsewhere[38]. We have previously shown that the ASA is a key parameter that influences the irreversible capacity of graphitic and hard carbon in lithium and Na ion batteries, respectively[38e40]. However, the influence of the presence of active sites on the elec-trochemical performances of carbon materials in organic- and aqueous-based supercapacitors has not been yet reported to the best of our knowledge.
In this work, carbon nano-onions (CNOs) were selected as model electrode materials due to their high electrical conductivity, short time charging and high power density [11,41e43]. CNOs exhibit moderate specific surface area (200e600 m2g"1)[11,43,44] compared to that of activated carbons, but their surface is fully accessible to ion adsorption due to the absence of a porous network inside the particles. In addition, they have a hydrophobic character leading to limited capacitance (25e50 F g"1)[43,44].
Therefore, due to their hydrophobic nature and their non-porous texture, they were selected in this work as model material in order to understand the influence of surface chemistry and presence of defects on their electrochemical performance in aqueous and organic electrolytes. Several thermal treatments allowed to independently modifying their structure and surface chemistry/defects while keeping similar their porous texture.
This systematic study highlighted a Langmuir correlation be-tween the capacitance and the desorbed quantity of oxygenated groups (DQ) while a linear relationship between the capacitance and ASA was found in organic and aqueous electrolyte. The effect in aqueous electrolytes was more pronounced, and high capacitance of ~95 F/g could be reached for some specific treatments. Never-theless, a predominant effect of the carbon defects (ASA) on the capacitance is evidenced which outbalance the functional group effect.
2. Experimental section
2.1. CNOs synthesis and modification
Ultra-pure nanodiamonds particles (ADAMAS Nanotechnologies Inc.) with nanodiamonds content #98% were used as received without any further purification. Polytetrafluoroethylene (PTFE) binder was purchased from Aldrich, with 60wt% suspension in water. Tetraethylammonium tetrafluoroborate (NEt4BF4) (Acros
Organics) was dissolved in acetonitrile (ACN) (Acros Organics, H2O < 10 ppm) to prepare 1.5 M NEt4BF4in AN electrolyte. Sulfuric
acid (H2SO4, Aldrich) was diluted in deionized water, which was
further purified with a milli-Q system (Millipore), to prepare 0.1 M H2SO4aqueous electrolyte.
A standard procedure was used to synthesis CNOs from ultra-high pure nanodiamonds (Nds) particles[44e46]. Typically, Nds were heated during one hour under Ar at 1350!C or vacuum at
1700!C, respectively. The resulting materials are denoted C1350
and C1700. The surface chemistry and the quantity of defects of the as-prepared CNOs materials were modified by thermal treatment under air for 1 h and 2 h respectively, at 470!C for C1350 and 580!C
for C1700. The resulting modified CNOs are noted as C1350-Tair, C1350-2Tair and C1700-Tair, C1700-2Tair, respectively. Further thermal annealing under hydrogen at 900!C for 1 h was performed
on C1350-Tair and C1700-Tair to remove their oxygen surface groups content and the derived materials were labeled as C1350-Tair-H2 and C1700-C1350-Tair-H2. A flowchart (Fig. 1) schematically shows the preparation process of the samples.
2.2. Structural and textural characterization
Thermogravimetric analysis (TGA) measurements were per-formed with a METTLER TOLEDO TGA851 device under air (100 mL min"1) using a heating rate of 10!C min"1in the
tem-perature range of 25e700!C.
The carbon structure was observed by transmission electron microscopy (TEM, JEOL ARM200F instrument) operating at 200 kV. X-Ray powder diffraction (XRD) data were collected with a Philips X’Pert MPD diffractometer with a Cu Ka1,2doublet and a flat-plate
BraggeBrentano thetaetheta geometry. N2 adsorption analysis
was performed with a Micromeritics ASAP 2420 instrument using N2as adsorbate at "196!C. Prior to the analysis, the samples were
out-gassed overnight under vacuum at 150 !C. BET
(Bru-nauereEmmetteTeller) specific surface area (SSA) was calculated from the linear plot in the relative pressure range of 0.05e0.3. The pore size distribution was determined using a DFT model.
Qualitative and quantitative measurements of oxygen surface groups content was done by temperature programmed desorption coupled with mass spectrometry as described in details elsewhere [38,47]. Briefly, in a typical measurement, the CNOs are placed in a quartz tube and heated under vacuum up to 950!C with a rate of
2!C min"1. The gases evolved during this step were quantitatively
detected by a mass spectrometer. The total amount of each gas released was computed by time integration of the TPD curves.
After this treatment at 950!C for 30 min under high vacuum
(10"4Pa), the CNOs surface is considered cleaned and ready to the
second step where the active surface area is determined as described in the literature[38]. In summary, the CNOs are exposed to oxygen atmosphere at 300!C during 10 h allowing surface
ox-ygen complexes to be formed. Further thermal treatment up to 950!C was used to decompose oxygenated groups in CO and CO
2,
which were quantified by TPD-MS. Considering the number of moles of desorbed gases and the area of an edge carbon site that chemisorbs an oxygen atom (0.083 nm2)[38,47], the active surface area, ASA (surface area occupied by the chemisorbed oxygen) can
be determined.
2.3. Electrochemical characterizations
The CNOs were tested using Swagelok cells in a 2-electrode configuration, by cyclic voltammetry using a multichannel VMP3 potentiostat/galvanostat (Biologic, France). Electrodes were pre-pared by mixing 95% of CNOs with 5% of polytetrafluoroethylene (PTFE) binder in the presence of ethanol. Electrochemical capaci-tors were built using two carbon electrodes (8 mm diameter) with comparable mass (~7 mg) and thickness (200
m
m)[48]and elec-trically isolated by a 50m
m-thick porous cellulose as separator disk. The counter electrode was a platinum disk. 0.1 M H2SO4as aqueouselectrolyte and 1.5 M NEt4BF4/ACN organic electrolyte were used.
Cyclic voltammetry was performed in a voltage window between 0 and 0.9 V for aqueous electrolytes and between 0 and 2.5 V for the organic electrolytes at scan rates of 20 mV s"1.
3. Results and discussion
Fig. 2a shows the X-ray diffraction (XRD) patterns of the as received Nds and CNOs obtained at the different annealing tem-peratures, i.e., 1350!C and 1700!C, respectively.
The XRD pattern of Nds shows an intense peak around 44!(2
q
)specific to the (111) interlayer distance, characteristic to sp3 -bonded carbon with a cubic structural phase (PDF 00-006-0675). For the C1700 sample, an intense peak at around 26!(2
q
),charac-teristic to the (002) interlayer distance, confirms the hexagonal structural phase (sp2-bonded carbon, PDF 00-041-1487). However, for the C1350 sample a mix of peaks corresponding to both sp3and sp2-bonded carbons is observed. The area ratio between the sp3 (111) and sp2(002) peaks decreases from 0.56 to 0.18 when heating from 1350!C to 1700!C. The air oxidation of C1350 (C1350-2Tair)
also results in the decrease of the (111)/(002) area peak ratio, from 0.56 for C1350 down to 0.51 for C1350-2Tair (seeFig. S2, Supporting Information). This is explained by the removal of some sp3
amor-phous carbon existing between the particles.
More insights about the structure of Nds and the CNOs were obtained by high-resolution TEM (Fig. 2aec). Nds particles present irregular shapes with a crystalline structure (Fig. 2a). When treated at 1350 !C, the morphology changes (Fig. 2b) and the particles
become more spherical. We notice that a fraction of particles exhibit a graphitic concentric structure while another part shows a core of un-reacted nanodiamond and a shell of graphitic structure. The ratio between the core and the shell varies with the size of the
particles, i.e., smaller the particles the higher the amount of graphitic shell. This suggests a graphitization process starting from the outer part of the particles. The oxidation process tends to ho-mogenize the particle morphology due to the removal of amor-phous carbon necks between the particles; this is particularly visible with the C1350 (seeFig. S2-Supporting Information). For higher annealing temperatures, concentric stacked layers (4e8 shells) of (002) graphitic planes are observed (Fig. 2c), thus con-firming the formation of the onion-like structure[44]. The trans-formation from diamond into graphitic structure is mainly induced by temperature although the annealing atmosphere (Ar for 1350!C
and vaccum for 1700 !C) may have an influence on the particle
morphology/structure[49]. In addition, the transformation of Nds in CNOs is accompanied by an increase of the particle size for ~6 nm for Nds to ~10 nm for C1700, respectively. This is mainly due to the (002) graphitic space layer (~0.34 nm) which is higher than the distance of CeC bond of diamond (0.154 nm).
The surface chemistry and active site amounts of the as-prepared CNOs materials were modified by thermal treatment under air to obtain C1350-Tair and C1700-Tair samples. The two oxidizing temperatures (470! and 580 !C) were selected on the
basis of TGA experiments. The sample weight loss profiles are given inFig. S1(Supporting Informations). The C1350 starts to oxidize at around 450!C while the onset oxidation temperature of the C1700
was 550!C. This is related to the different graphitization level as
shown by XRD analysis (Fig. 2): the higher the graphitization level (C1700) the lower the reactivity towards oxygen and the higher the oxidation temperature. Because of the reactivity difference in air between the two materials, the same oxidation temperature cannot be used; therefore, a burn-off percentage of ~15% was fixed for both carbons to ensure efficient oxidation treatment but to avoid excessive mass loss during the oxidation.
The textural properties of the as prepared materials and modi-fied ones were determined by nitrogen adsorption/desorption isotherms (Fig. 3). All materials exhibit isotherms with similar shapes and can be classified as type II with a H3 hysteresis loop, characteristic to non-porous materials.
The specific surface area of Nds is 283 m2g"1and slightly
in-creases up to 294 m2 g"1when treated at 1350 !C. For higher
temperatures (1700!C) the SSA greatly increases up to 437 m2g"1
(seeTable 1), in good agreement with other works[50]. The ther-mal treatment under air induces a significant increase of the SSA of the C1350 material (from 294 to 403 m2g"1), while only a slight increase is noticed for the C1700 sample (from 437 to 501 m2g"1).
The increase of the surface area by oxidation is associated with the
removal of the inter-particle bottlenecks amorphous carbon and a part of the outer shell of CNOs. For both C1350 and C1700, only a slight modification of SSA by hydrogen thermal treatment was observed (Table 1).
The pore size distribution (Fig. 3b) shows, for all materials, a pore size in the micropore region (~1 nm) and mesopores of about 10 nm, corresponding to the interparticles and inter-cluster spaces between the CNOs. However, the assignment of the pore size dis-tribution to different “spaces” in the CNOs is much complex as highlighted recently elsewhere[51].
The surface chemistry and defects modifications induced by the air and hydrogen treatments were monitored by temperature programmed desorption coupled with mass-spectrometry. The material is heated under vacuum and the oxygenated groups pre-sent on the carbon surface are removed with the formation of CO and CO2gases. The release temperature of gases gives indication of
their chemical nature[32].Fig. 4a and b shows the CO2 and CO
desorption profiles of C1350 and C1700 and their corresponding modified materials after subsequent thermal oxidation under air and oxidation under air followed by hydrogen treatment.
Generally, CO2desorption occurs in the 150e700!C
tempera-ture range, while CO desorbs at higher temperatempera-ture between 320 and 950!C (in-setFig. 4a). The pristine CNOs i.e., C1350 and C1700
show low CO and CO2signals (Fig. 4a and b) suggesting a
hydro-phobic surface, with a low content in oxygenated groups. When treated under air, an intense CO desorption peak is observed in the high temperature range, i.e., 400e950!C and 500e950!C, for the
C1350 and C1700 samples, respectively. This indicates the presence of basic oxygenated groups such as anhydrides, ethers, phenols or quinones[38,52e54].
It can be noticed as well that a small fraction of additional oxygenated groups could be formed on C1350 between 400 and 500 !C, which is related to the lower oxidation temperature
(470!C) compared to C1700 (580!C). This can be well seen on the
desorption peaks showing higher intensity for materials oxidized at
1350!C.
In addition to CO desorption, CO2 gas evolution is observed
within the 400e600!C temperature range mainly on the C1350
materials, suggesting the formation of acidic oxygenated groups such as anhydrides[38,52e54]. The intensity of the CO2peaks is
significantly much lower than those of CO, showing that basic groups are predominantly formed on the materials by thermal oxidation. The hydrogenation treatment performed on these oxidized materials allows to remove the functional groups as shown by the low intensity CO and CO2profiles.
By integration of TPD-MS desorption curves, the amounts of desorbed CO and CO2groups can be determined as can be seen in
Fig. 4c andTable 1. The calculated amounts well agree with the intensity of desorption profiles. The pristine materials C1350 and C1700 desorb very low quantities of COx, (<0.1 mmol/g), while the
oxidation greatly improves the functionalization of the CNOs (C1300-Tair, C1300-2Tair, C1700-Tair, C1700-2Tair), with desorbed surface groups contents ranging from 1.4 to 4.0 mmol/g. We note that the COxamounts desorbed increase for longer oxidation times
and for the C1350 family materials which are more reactive. The hydrogen treatment allows to remove most of the groups (C1350-Tair-H2, C1700-Tair-H2); the desorbed quantities are low (from 0.1 to 0.3 mmol/g) but slightly higher that of the pristine carbons (C1300, C1700).
After cleaning the CNOs surface by a treatment at 950!C under
vacuum (TPD) the surface defects concentration e active surface area is measured by chemisorption of oxygen at 300!C overnight,
followed by a TPD-MS analysis. The ASA values are shown inFig. 4d and are also listed inTable 1.
The well graphitized C1700 sample contains only small amounts of surface functional groups and is also poor in defects with the lowest value of the ASA. This sample can therefore be considered as a reference sample, having no surface chemistry and structural defects. After oxidation under air, oxygenated groups were created on the C1700 carbon surface as can be seen from the TPD-MS
analysis (1.4 mmol g"1). This step also led to the formation of de-fects (ASA ¼ 22 m2g"1). Although further annealing under H2of
this material allows removing most functional groups (0.2 mmol g"1), very interestingly, the ASA is kept high (17 m2g"1).
Considering the error of an ASA measurement (maximum 10%) these values can be considered similar. This result suggests a location of the functional groups in the defect sites; if not, the
removal of these groups would induce the formation of defects and therefore an increase in the ASA. Three different CNOs were thus obtained, with various surface chemistry and active sites: one sample (C1700) free of oxygenated groups and defects; a second sample (C1700-Tair) with oxygenated groups and defects and the third one (C1700-Tair-H2) with low oxygen groups content but with significant amount of defects. For the second series of C1350,
1 10 100 0.00 0.02 0.04 0.06 0.08 1 10 100 0.00 0.02 0.04 0.06 0.08
e
m
ul
o
V
er
o
P
(cm³.g
-1)
Pore width (nm) Nds C1350 C1350-Tair C1350-Tair-H2 C1350-2TairP
o
re
V
o
lu
m
e
(
c
m
³.
g
-1)
Pore width (nm) Nds C1700 C1700-Tair C1700-Tair-H2 C1700-2Tair 0.0 0.2 0.4 0.6 0.8 1.0 0 200 400 600 800 1000 Nds C1350 C1350-Tair C1350-Tair-H2 C1350-2Taire
m
ul
o
V
d
e
br
o
s
d
A
(c
m
3/g
)
Relative pressure P/P
0 0.0 0.2 0.4 0.6 0.8 1.0 0 200 400 600 800 1000 Nds C1700 C1700-Tair C1700-Tair-H2 C1700-2TairA
d
s
o
rb
e
d
V
o
lu
m
e
(
c
m
3/g
)
Relative pressure P/P
0Fig. 3. (a) Nitrogen adsorption/desorption isotherms and (b) DFT pore size distribution of nanodiamonds, C1350 (left) and C1700 (right) carbons modified by different treatments. (A color version of this figure can be viewed online.)
Table 1
Specific surface area, amount of oxygen functional groups and active surface area values of CNOs treated under different conditions, and their corresponding capacitance in organic and aqueous electrolytes.
CNOs SSA m2g"1 DQ
ðCOþCO2Þmmol g"1 ASA m2g"1 ASA/SSA CorgF/g CaqF/g
C1350 294 0.05 5 0.017 26 54 C1350-Tair 403 3 59 0.146 30 94 C1350-Tair-H2 433 0.3 49 0.113 31 79 C1350-2Tair 466 4 70 0.150 30 82 C1700 437 0.0 2 0.004 21 22 C1700-Tair 501 1.4 22 0.039 32 55 C1700-Tair-H2 466 0.1 17 0.037 30 41 C1700-2Tair 516 1.9 34 0.066 32 60
the same trend was observed but the experimental value shows that the amount of oxygenated groups and defects is three times higher than that of the C1700 series. Since the SSA area changes with these treatments, the ASA/SSA ratio was determined and we notice the same trend between the materials (Table 1).
These materials with distinct surface chemistry and defects contents will be used to understand the electrochemical perfor-mances of supercapacitors operating with different electrolytes.
The electrochemical performances of CNOs sample were determined in Swagelok cells in two-electrode configuration, in organic and aqueous electrolytes. Cyclic voltammograms at 20 mV s"1in 1.5 M NEt4BF4/ACN and 0.1 M H2SO4are shown in
Fig. 5a and b, respectively. All CVs exhibit a rectangular shape, which is characteristic of a capacitive behavior [24,44,55]. The peaks at 0.4 V and 0.8 V in aqueous electrolyte for CNOs1350 are associated with the pseudocapacitive contributions of surface functional groups[56e58].
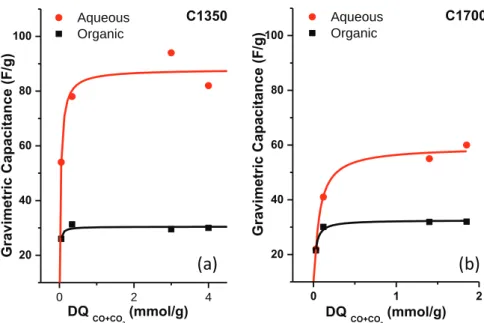
The resulting gravimetric capacitance for all CNOs in both electrolytes as a function of desorbed CO and CO2quantities (DQ)
are shown inFig. 6. As a general trend, the capacitance increases with the amount of DQ for both CNOs series (Fig. 6a and b). Since the amount of DQ is three times greater for the C1350 series than that of the 1700 series, therefore the capacitance is also three times higher. The maximum capacitance approaches 100 F/g, which is
higher than those reported before for such materials[4,7,26,30,31]. Aside, the increase in the capacitance is much pronounced in aqueous electrolyte than in organic electrolytes. This suggests more specific interactions between the oxygenated groups and the aqueous electrolyte, in agreement with the existence of pseudo-capacitive mechanism[59,60] in addition to the electric double layer capacitive behavior[56].
As pointed out by Macdonald et al.[61], interactions between adsorbed species depends on the Helmholtz free energy and the chemical potential. In other words, the capacitance associated with the adsorption is now assimilated to a new capacitance expressed as a “Langmuir” capacitance[61]. Cð
q
Þ ¼ q$ !z iF RT " $q
ð1 "q
Þ 1 þ rq
ð1 "q
Þ (1)where C is the capacitance,
q
is the number of sites of the surface which are covered with gaseous molecules ((1 eq
) being the fraction of surface which is free from gas molecules), q is the charge corresponding to one monolayer, ziis the charge of the ion and F isthe faraday, r is the average pore radius. This is agreement with the trend curves represented in Fig. 6. All trend curves follow the Langmuir expression that we’ve cited before and their equation is assimilated to
Fig. 4. TPD-MS desorption curves of a) CO2and b) CO along with the types of oxygen functional groups related to the CO and CO2desorption’s profile c) Desorbed quantities of
y ¼ a$x
ð1 þ b$xÞ (2)
With the values of a and b are reported inTable 2.
This correlation is obtained for materials with similar charac-teristics in terms of SSA and surface chemistry (similar type of basic oxygen groups). However, by changing the process, different types/ amounts of oxygen groups can be introduced onto the carbon sample surface (seeTable S1andFig. S3) leading to an absence of any clear correlation between the capacitance in organic/aqueous electrolytes and the quantity of oxygen groups (seeFig. S4). This suggests the importance of the nature of the oxygen groups on the capacitance. Additional studies are needed to fully understand the influence functional groups nature on the capacitance response.
An important concern deals with the role of the defects (ASA) on the capacitance in both aqueous and organic electrolytes. Such
effect has not been studied in detail before.Fig. 7shows the cor-relation between the capacitance and the ASA/SSA ratio, in aqueous and organic electrolytes. We notice that in aqueous and organic electrolytes, the capacitance for both CNO series (1350 and 1700) increases linearly with the increase of the ratio ASA/SSA. Similarly to the effect of DQ, the effect of ASA is greater for C1350 series and in aqueous electrolytes.
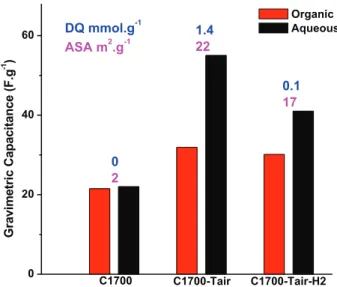
However, both the ASA and the surface functional groups (sur-face chemistry) changes for all the samples (see Table 1). To discriminate the influence of the presence of surface groups or the ASA on the capacitance, three samples have been prepared: C1700, C1700-Tair and C1700-Tair-H2. The results of the electrochemical tests are shown inFig. 8.
C1700 and C1700-Tair-H2 samples exhibit similar low quantities of oxygenated groups (<0.1 mmol/g,Table 1) but very different ASA (1.3 and 17 m2g"1for C1700 and C1700-Tair-H2, respectively). The
0.0 0.5 1.0 1.5 2.0
-40
-20
0
20
40
60
)
g/
F(
e
c
n
ati
c
a
p
a
C
E(V)
C1350-Tair-H2
C1350-2Tair
C1350-Tair
C1350
0.0 0.5 1.0 1.5 2.0-40
-20
0
20
40
60
C1700-Tair-H2
C1700-2Tair
C1700-Tair
C1700
C
a
p
a
c
it
a
n
c
e
(
F
/g
)
E(V)
0.0 0.2 0.4 0.6 0.8 -160 -120 -80 -40 0 40 80 120 160C
a
p
a
c
it
a
n
c
e
(
F
/g
)
E(V)
C1350-Tair-H2
C1350-2Tair
C1350-Tair
C1350
0.0 0.2 0.4 0.6 0.8 -60 -40 -20 0 20 40 60 80C1700-Tair-H2
C1700-2Tair
C1700-Tair
C1700
C
a
p
a
c
it
a
n
c
e
(
F
/g
)
E(V)
Fig. 5. Cyclic voltammetry curves of CNOs materials modified by different treatments at scan rate 20 mV s"1using Swagelok assembling (2-electrodes) (a) in organic electrolyte
capacitance in aqueous electrolyte for the C1700 sample was measured at 22 F/g vs. 41 F/g for C1700Tair-H2. Hence, since C1700 has low surface chemistry content and ASA, the capacitance (22 F/
g) mainly arises from the porosity (surface area). Differently, for the C1700-Tair-H2 sample with high ASA and low surface group con-tent, the approx. 2-fold increase in capacitance (41 F/g) can be associated with the ASA increase. This clearly shows a major contribution of ASA to capacitance compared to functional groups. C1700-Tair and C1700-Tair-H2 show similar high ASA values (22 and 17 m2g"1for C1700-Tair and C1700-Tair-H2, respectively) but different quantities of oxygenated groups (1.4 mmol/g and 0.1 mmol/g for C1700-Tair and C1700-Tair-H2, respectively). The capacitance was measured at 60 and 40 F/g for C1700-Tair and
C1700-Tair-H2,respectively. This suggests that the contribution of
functional groups to the total capacitance in the C1700-Tair mate-rial is about 20 F/g, while the other 40 F/g comes from the porosity
0 2 4 20 40 60 80 100
C1700
C1350
)
g/
F(
e
c
n
ati
c
a
p
a
C
ci
rt
e
mi
v
ar
G
DQ
CO+CO(mmol/g)
Aqueous
Organic
0 1 2 20 40 60 80 100G
ra
v
im
e
tr
ic
C
a
p
a
c
it
a
n
c
e
(
F
/g
)
DQ
CO+CO(mmol/g)
Aqueous
Organic
Fig. 6. The correlation between the capacitance and the desorbed quantities (DQ) of CO and CO2in aqueous and organic electrolytes for (a) C1350 and (b) C1700 carbons. (A color
version of this figure can be viewed online.)
Table 2
Different values of a and b used in the expression of “Langmuir” capacitance to calculate the trend curves of the C1350 and 1700 carbon series in aqueous elec-trolyte (0.1 M H2SO4) and organic electrolyte (1.5 M NEt4BF4/AN).
Samples a b C1350 series_Organic Elec. 3813 125 C1350 series_Aqueous Elec. 2715 31 C1700 series_Organic Elec. 2239 69 C1700 series_Aqueous Elec. 1134 19 0.00 0.05 0.10 0.15 20 40 60 80 100 Aqueous Organic
C1350
ASA/SSA
0.00 0.02 0.04 0.06 20 40 60 80 100 Aqueous OrganicC1700
G
ra
v
im
e
tr
ic
C
a
p
a
c
it
a
n
c
e
(
F
/g
)
G
ra
v
im
e
tr
ic
C
a
p
a
c
it
a
n
c
e
(
F
/g
)
ASA/SSA
Fig. 7. The correlation between the capacitance and the ratio ASA/SSA in organic electrolytes (NEt4BF4/ACN) and aqueous electrolytes (H2SO4) for (a) C1350 and (b) C1700 carbons.
and ASA. These results clearly show the important role of ASA in the capacitance improvement.
Similar behavior was seen for C1350, but higher capacitance values were obtained (95 F/g for C1350-Tair). To explain the improvement of the capacitance only by the presence of defects, we must consider that carbon atoms at the prismatic surface are more reactive than the basal plane atoms since they have an unpaired electron available to form bonds with oxygen[38]. In the case of graphitized carbon, the ASA represents essentially the reactivity of carbon edge planes. This means that the CNOs defects could interact with the aqueous electrolytes throughout oxygen bonds, allowing the improvement of interactions with the electrolyte and in consequence the capacitance behavior.
4. Conclusions
CNOs materials were synthesized from high-purity nano-diamonds and they underwent different types of thermal treat-ments in reducing or oxidizing atmosphere in order to modify their surface chemistry and their defects content (active sites). The proposed treatments allowed to finely tune the surface chemistry while keeping unchanged the amount of defects or inversely. For the first time, the precise control of these characteristics allowed highlighting a predominant influence of the carbon defects on the capacitance in organic and aqueous electrolytes which counter-balance the functional group effect. Hence, the functional groups have less influence on capacitance than usually stated and they influence more the CNOs performances in aqueous medium than organic one. These results bring new insights on the important characteristics of carbon to be improved in order to design new electrodes with high capacitance and energy density for super-capacitor applications. The extrapolation of these findings to commercially used activated carbon electrodes is of prime impor-tance and will be discussed in our future works.
Acknowledgments
The R!eseau sur le Stockage Electrochimique de l’Energie (RS2E) is acknowledged for financial support of this project through the ANR project Storex (ANR-10-LABX-76-01). The authors thank Joseph Denzter, Loïc Vidal, Jean-Marc Le Meins, Barbara Daffos and
Wan-Yu Tsai for their assistance with the TEM, TPD-MS, XRD and Cy-clic Voltammetry measurements.
Appendix A. Supplementary data
Supplementary data related to this article can be found athttp:// dx.doi.org/10.1016/j.carbon.2016.05.010.
References
[1]C. Liu, F. Li, L. Ma, H. Cheng, Advanced materials for energy storage, Adv. Mater. 22 (2010) 28e62.
[2]F. Beguin, F. Frackowiak, Carbons for Electrochemical Energy Storage and Conversion Systems, CRC Press, New York, 2010.
[3]P. Simon, Y. Gogotsi, Materials for electrochemical capacitors, Nat. Mater. 7 (2008) 845e854.
[4]S. Candelaria, Y. Shao, W. Zhou, X. Li, J. Xiao, J. Zhang, Y. Wang, J. Liu, J. Li, G. Cao, Nanostructured carbon for energy storage and conversion, Nano En-ergy 1 (2012) 195e220.
[5]B. Conway, Electrochemical Supercapacitors: Scientific Fundamentals and Technological Applications, Kluwer Academic Plenum Publisher, New York, 1999.
[6]K. Kim, S. Park, Synthesis and high electrochemical capacitance of N-doped microporous carbon/carbon nanotubes for supercapacitor, J. Electroanal. Chem. 673 (2012) 58e64.
[7]Q. Zhang, E. Uchaker, S. Candelaria, G. Cao, Nanomaterials for energy con-version and storage, Chem. Soc. Rev. 42 (2013) 3127e3171.
[8]H. Helmholtz, Ueber einige Gesetze der Vertheilung elektrischer Str€ome in k€orperlichen Leitern mit Anwendung auf die thierisch-elektrischen Versuche, Ann. Phys. 89 (1853) 211e233.
[9]O. Mykhailiv, M. Imierska, M. Petelczyc, L. Echegoyen, M. Plonska-Brzezinska, Chemical vs. electrochemical synthesis of carbon nano-onion/polypyrrole composites for supercapacitor electrodes, Chem. Eur. J. 21 (2015) 5783e5793. [10] F. Beguin, V. Presser, A. Balducci, E. Frackowiak, Carbons and electrolytes for
advanced supercapacitors, Adv. Mater. 26 (2014) 2219e2251.
[11] K. Makgopa, P. Ejikeme, C. Jafta, K. Raju, M. Zeiger, V. Presser, K. Ozoemena, A high-rate aqueous symmetric pseudocapacitor based on highly graphitized onion-like carbon/birnessite-type manganese oxide nanohybrids, J. Mater. Chem. A 3 (2015) 3480e3490.
[12] J. Chmiola, G. Yushin, Y. Gogotsi, C. Portret, P. Simon, P. Taberna, Anomalous increase in carbon capacitance at pore sizes less than 1 nanometer, Science 313 (2006) 1760e1763.
[13] C. Decaux, C. Matei-Ghimbeu, M. Dahbi, M. Anouti, D. Lemordant, F. Beguin, C. Vix-Guterl, E. Raymundo-Pi~nero, Influence of electrolyte ion-solvent in-teractions on the performances of supercapacitors porous carbon electrodes, J. Power Sources 263 (2014) 130e140.
[14] G. Gong, Q. Xie, Y. Zheng, Y. Chen, S. Ye, Regulation of pore size distribution in coal-based activated carbon, New Carbon Mater. 24 (2009) 141e146. [15] I. Kim, M. Egashira, N. Yoshimoto, M. Morita, On the electric double-layer
structure at carbon electrode/organic electrolyte solution interface analysed by ac impedance and electrochemical quarz-crystal microbalance responses, Electrochim. Acta 56 (2011) 7319e7326.
[16] P. Liu, M. Verbrugge, S. Soukiazian, Influence of temperature and electrolyte on the performance of activated-carbon supercapacitors, J. Power Sources 156 (2006) 712e718.
[17] R. Mysyk, E. Raymundo-Pi~nero, J. Pernak, F. Beguin, Confinement of symmetric tetraalkylammonium ions in nanoporous carbon electrodes of electric double-layer capacitors, J. Phys. Chem. C 113 (2009) 13443e13449.
[18] E. Raymundo-Pinero, K. Kierzek, J. Machnikowski, F. Beguin, Relationship between the nanoporous texture of activated carbons and their capacitance properties in different electrolytes, Carbon 44 (2006) 2498e2507.
[19] J. Segalini, E. Iwama, P. Taberna, Y. Gogotsi, P. Simon, Steric effects in adsorption of ions form mixed electrolytes into microporous carbon, Elec-trochem. Comm. 15 (2012) 63e65.
[20] C. Vix-Guterl, E. Frackowiak, K. Jurewicz, M. Friebe, J. Parmentier, F. B!eguin, Electrochemical energy storage in ordered porous carbon materials, Carbon 43 (2005) 1293e1302.
[21] X. Zhang, R. Zhang, B. XIng, G. Cheng, Y. Xie, W. Qiao, L. Zhan, X. Liang, L. Ling, Effect of pore structure on the electrochemical performance of coal-based activated carbons in non-aqueous electrolyte, New Carbon Mater. 25 (2010) 129e133.
[22] E. Calvo, N. Rey-Raap, A. Arenillas, A. Menendez, The effect of the carbon surface chemistry and electrolyte pH on the energy storage of super-capacitors, RSC Adv. 4 (2014) 32398e32404.
[23] E. Frackowiak, Carbon materials for supercapacitors applications, Phys. Chem. Chem. Phys. 9 (2007) 1774e1785.
[24] W. Tsai, P. Gao, B. Daffos, P. Taberna, C. Perez, Y. Gogotsi, F. Favier, P. Simon, Ordered mesoporous silicon carbide-derived carbon for high-power super-capacitors, Electrochem. Comm. 34 (2013) 109e112.
[25] J. Chmiola, G. Yushin, Y. Gogotsi, C. Portet, P. Simon, P. Taberna, Anomalous increase in carbon capacitance at pore sizes less than 1 nanometer, Science 313 (2006) 1760e1763. 0 20 40 60
DQ mmol.g
-1ASA m
2.g
-10.1
17
1.4
22
0
2
C1700-Tair-H2 C1700-Tair G ra v im e tr ic C a p a c it a n c e ( F .g -1 ) C1700 Organic AqueousFig. 8. Gravimetric capacitances of C1700 series in organic electrolytes (NEt4BF4/ACN)
and aqueous electrolytes (H2SO4) and their corresponding values in terms of desorbed
[26] Q. Huang, D. Yu, B. Xu, W. Hu, Y. Ma, Y. Wang, Z. Zhao, B. Wen, J. He, Z. Liu, Y. Tian, Nanotwinned diamond with unprecedented hardness and stability, Nature 510 (2014) 250e253.
[27] Y. Xia, Y. Zhu, Y. Tang, Preparation of sulfur-doped microporous carbons for the storage of hydrogen and carbon dioxide, Carbon 50 (2012) 5543e5553. [28] K. Jurewicz, K. Babel, A. Ziolkowski, H. Wachwoska, Ammoxidation of active
carbons for improvement of supercapacitor characteristics, Electrochim. Acta 48 (2003) 1491e1498.
[29] H. Andreas, B. Conway, Examination of the double-layer capacitance of an high specific-area C-cloth electrode as titrated from acidic to alkaline pHs, Electrochim. Acta 51 (2006) 6510e6520.
[30] C. Largeot, C. Portet, J. Chmiola, P. Taberna, Y. Gogotsi, P. Simon, Relation between the ion size and pore size for an electric double-layer capacitor, J. Am. Chem. Soc. 130 (2008) 2730e2731.
[31] B. Garcia, S. Candelaria, G. Cao, Nitrogenated porous carbon electrodes for supercapacitors, J. Mater. Sci. 47 (2012) 5996e6004.
[32] J.L. Figueiredo, M.F.R. Pereira, M.M.A. Freitas, J.J.M. Orfao, Modification of the surface chemistry of activated carbons, Carbon 37 (1999) 1379e1389. [33] J. Figueiredo, J. Sousa, C. Orgek, M. Pereira, J. Orfao, Adsorption of dyes on
carbon xerogels and templated carbons: influence of surface chemistry, Adsorption 17 (2011) 431e441.
[34] C. Matei Ghimbeu, R. Gadiou, J. Dentzer, D. Schwartz, C. Vix-Guterl, Influence of surface chemistry on the adsorption of oxygenated hydrocarbons on acti-vated carbons, Langmuir 26 (2010) 18824e18833.
[35] J.H. Zhou, Z.J. Sui, J. Zhu, P. Li, D. Chen, Y.C. Dai, W.K. Yuan, Characterization of surface oxygen complexes on carbon nanofibres by TPD, XPS and FT-IR, Car-bon 45 (2007) 785e796.
[36] M. Ismail, K. Ismail, Structure and active surface area of carbon fibers, Carbon (1987) 653e662.
[37] P. Ehrburger, N. Pusset, P. Dziedzinl, Active surface area of microporous car-bons, Carbon 30 (1992) 1105e1109.
[38] Bernardo Ph, J. Dentzer, R. Gadiou, W. M€arkle, D. Goers, P. Nov!ak, M.E. Spahr, C. Vix-Guterl, Influence of graphite surface properties on the first electro-chemical lithium intercalation, Carbon 49 (2011) 4867e4876.
[39] B. Zhang, C. Matei-Ghimbeu, C. Laberty, C. Vix-Guterl, J. Tarascon, Correlation between microstructure and Na storage behavior in hard carbon, Adv. Energy Mater. 6 (2016) 1501588.
[40] C. Matei Ghimbeu, C. Decaux, P. Brender, M. Dahbi, D. Lemordant, E. Raymundo-Pinero, M. Anouti, F. Beguin, C. Vix-Guterl, Influence of graphite characteristics on the electrochemical performance in alkylcarbonate LiTFSI electrolyte for Li-ion capacitors and Li-ion batteries, J. Electrochem. Soc. 160 (2013) A1907eA1915.
[41] E. Bushueva, P. Galkin, A. Okotrub, L. Bulusheva, N. Gavrilov, V. Kuznetsov, S. Moiseekov, Double layer supercapacitor properties of onion-like carbon materials, Phys. Status Solidi 245 (2008) 2296e2299.
[42] Y. Gao, Y. Zhou, M. Qian, X. He, J. Redepenning, P. Goodman, H. Li, L. Jiang, Y. Lu, Chemical activation of carbon nano-onions for high-rate supercapacitor electrodes, Carbon 51 (2013) 52e58.
[43] C. Portet, G. Yushin, Y. Gogotsi, Electrochemical performance of carbon onions, nanodiamonds, carbon black and multiwalled nanotubes in electrical double layer capacitors, Carbon 45 (2007) 2511e2518.
[44] J. Mcdonough, A. Frolov, V. Presser, J. Niu, C. Miller, T. Ubieto, M. Fedorov, Y. Gogotsi, Influence of the structure of carbon onions on their electro-chemical performance in supercapacitor electrodes, Carbon 50 (2012)
3298e3309.
[45] S. Tomita, T. Sakurai, H. Ohta, M. Fujii, S. Hayashi, Structure and electronic properties of carbon onions, Chem. Phys. 114 (2001) 7477e7482.
[46] V. Kuznetov, A. Chuvilin, Y. Butenko, I. Malkov, V. Titov, Onion-like carbon from ultra-disperse diamond, Chem. Phys. Lett. 222 (1994) 343e348. [47] C. Matei-Ghimbeu, C. Decaux, P. Brender, M. Dahbl, D. Lemordant,
E. Raymundo-Pi~nero, M. Anouti, F. Beguin, C. Vix-Guterl, Influence of graphite characteristics on the electrochemical performance in alkylcarbonate LiTFSI electrolyte for Li-Ion capacitors and Li-Ion batteries, J. Electrochem. Soc. 160 (2013) A1907eA1915.
[48] Y. Gogotsi, P. Simon, True performance metrics in electrochemical energy storage, Science 334 (2011) 917e918.
[49] M. Zeiger, N. Jackel, D. Weingarth, V. Presser, Vacuum or flowing argon: what is the best synthesis atmosphere for nanodiamond-derived carbon onions for supercapacitor electrodes? Carbon 94 (2015) 507e517.
[50] V. Roddatis, V. Kuznetov, Y. Butenko, D. Sua, R. Schlogla, Transformation of diamond nanoparticles into carbon onions under electron irradiation, Phys. Chem. Chem. Phys. 4 (2002) 1964e1967.
[51] M. Zeiger, N. Jackel, M. Aslan, D. Weingarth, V. Presser, Understanding structure and porosity of nanodiamond-derived carbon onions, Carbon 84 (2015) 584e598.
[52] V. Ruiz, C. Blanco, E. Raymundo-Pinero, V. Khomenko, F. B!eguin, R. Santamaria, Effects of thermal treatment of activated carbon on the elec-trochemical behaviour in supercapacitors, Electrochem. Acta 52 (2007) 4968e4973.
[53] P. Brender, R. Gadiou, J.C. Rietsch, P. Fioux, J. Dentzer, A. Ponche, C. Vix-Guterl, Characterization of carbon surface chemistry by combined temperature pro-grammed desorption with in situ X-ray photoelectron spectrometry and temperature programmed desorption with mass spectrometry analysis, Anal. Chem. 84 (2012) 2147e2153.
[54] C. Matei Ghimbeu, R. Gadiou, J. Dentzer, L. Vidal, C. Vix-Guterl, A TPD-MS study of the adsorption of ethanol/cyclohexane mixture on activated carbons, Adsorption 17 (2011) 227e233.
[55] M. Plonska-Brzezinska, A. Molina-Ontoria, L. Echegoyen, Post-modification by low-temperature annealing of carbon nano-onions in the presence of carbo-hydrates, Carbon 67 (2014) 304e317.
[56] Y. Oh, J. Yooa, Y. Kima, J. Yoona, H. Yoona, J. Kima, S. Park, Oxygen functional groups and electrochemical capacitive behavior of incompletely reduced graphene oxides as a thin-film electrode of supercapacitor, Electrochim. Acta 116 (2014) 118e128.
[57] M. He, K. Fic, E. Frackowiak, P. Nov!ak, E.J. Berg, Ageing phenomena in high-voltage aqueous supercapacitors investigated by in situ gas analysis, Energy Environ. Sci. 9 (2016) 623e633.
[58] V. Khomenko, E. Raymundo-Pi~nero, F. B!eguin, A new type of high energy asymmetri asymmetric capacitor with nanoporous carbon electrodes in aqueous electrolyte, J. Power Sources 195 (2010) 4234e4241.
[59] H. Byon, S. Lee, S. Chen, P. Hammond, Y. Horn, Thin films of carbon nanotubes and chemically reduced graphenes for electrochemical micro-capacitors, Carbon 49 (2011) 457e467.
[60] L. Lai, H. Yang, L. Wang, B. The, J. Zhong, H. Chou, L. Chen, W. Chen, Z. Shen, R. Ruoff, J. Lin, Preparation of supercapacitor electrodes through selection of graphene surface functionalities, ACS Nano 6 (2012) 5941e5951.
[61] J. Macdonald, Impedance Spectroscopy: Theory, Experiment, and Applica-tions, John Wiley and Sons, New York, 1987.