OATAO is an open access repository that collects the work of Toulouse
researchers and makes it freely available over the web where possible
Any correspondence concerning this service should be sent
to the repository administrator:
[email protected]
This is an author’s version published in:
http://oatao.univ-toulouse.fr/26122
To cite this version:
Allard, Charlotte and Schué, Léonard and Fossard, Frédéric and Recher, Gaëlle and
Nascimento, Rafaella and Flahaut, Emmanuel
and Loiseau, Annick and
Desjardins, Patrick and Martel, Richard and Gaufrès, Etienne Confinement of Dyes
inside Boron Nitride Nanotubes: Photostable and Shifted Fluorescence down to the
Near Infrared. (2020) Advanced Materials (2001429). 1-10. ISSN 0935-9648
Confinement of Dyes inside Boron Nitride Nanotubes:
Photostable and Shifted Fluorescence down to the Near Infrared
Charlotte Allard, Léonard Schué, Frédéric Fossard, Gaëlle Recher, Rafaella Nascimento,
Emmanuel Flahaut, Annick Loiseau, Patrick Desjardins, Richard Martel,*
and Etienne Gaufrès*
DOI: 10.1002/adma.202001429
displays. Although they have become ubiquitous in our lives, organic dyes are inherently photodegradable and reac-tive in physiological conditions.[1] Known since the nineteenth century,[2] the dyes’ instabilities stem in part from different photo activated physical and chemical pro-cesses occurring during the lifetime of the excited-state, which include dark state formation by intersystem crossing,[3,4] molecular conformation change,[5] and light-induced charging and triggering of temporary perturbations (blinking) due to random excursions between bright and dark states.[6–8] More significantly, reactive oxidizing species (ROS) placed in contact with the dye induce irreversible photo-luminescence (PL) extinction, known as photobleaching or fading.[9,10] These pro-cesses drastically reduce the time window to perform experiments and hence limit bioimaging applications and in vivo moni-toring in various conditions. For example, the green fluorescent protein (GFP) provides a limited number of absorption/emission cycles in the range between 104 and 105 emitted photons before photobleaching. GFPs remain never-theless very popular as fluorescence probes albeit their use is limited in typical imaging conditions to only few minutes.[11,12] Fluorescence is ubiquitous in life science and used in many fields of research
ranging from ecology to medicine. Among the most common fluorogenic compounds, dyes are being exploited in bioimaging for their outstanding optical properties from UV down to the near IR (NIR). However, dye mole-cules are often toxic to living organisms and photodegradable, which limits the time window for in vivo experiments. Here, it is demonstrated that organic dye molecules are passivated and photostable when they are encap-sulated inside a boron nitride nanotube (dyes@BNNT). The results show that the BNNTs drive an aggregation of the encapsulated dyes, which induces a redshifted fluorescence from visible to NIR-II. The fluorescence remains strong and stable, exempt of bleaching and blinking, over a time scale longer than that of free dyes by more than 104. This passivation also reduces the
toxicity of the dyes and induces exceptional chemical robustness, even in harsh conditions. These properties are highlighted in bioimaging where the dyes@BNNT nanohybrids are used as fluorescent nanoprobes for in vivo monitoring of Daphnia Pulex microorganisms and for diffusion tracking on human hepatoblastoma cells with two-photon imaging.
Dye molecules produce intense absorption bands and fluo-rescence signals over a broad range of wavelengths from the near infrared (NIR) to the ultraviolet (UV). Because of these exceptional properties, they are widely used to color and emit light in various applications, ranging from dyeing fabrics to
C. Allard, Prof. P. Desjardins Département de génie physique Polytechnique Montréal
Montréal, Québec H3C 3A7, Canada
Dr. L. Schué, Dr. R. Nascimento, Prof. R. Martel Département de chimie
Université de Montréal
Montréal, Québec H3C 3J7, Canada E-mail: [email protected]
Dr. F. Fossard, Dr. A. Loiseau, Dr. E. Gaufrès
Laboratoire d’Etude des Microstructures, ONERA-CNRS, UMR104 Université Paris-Saclay
BP 72, Châtillon 92322, France E-mail: [email protected]
The ORCID identification number(s) for the author(s) of this article can be found under https://doi.org/10.1002/adma.202001429.
Dr. G. Recher, Dr. E. Gaufrès CNRS & Institut d’Optique UMR 5298, Talence F-33400, France Dr. G. Recher, Dr. E. Gaufrès
LP2N, Laboratoire Photonique Numerique et Nanosciences University of Bordeaux
Talence F-33400, France Dr. E. Flahaut
CIRIMAT, Université de Toulouse, CNRS, INPT, UPS, UMR CNRS-UPS-INP N°5085
Université Toulouse 3 Paul Sabatier
Expedients to delay photobleaching have been developed and good examples include the addition of oxygen-blocking mole-cules, such as anoxia,[13] and a passivation of the dyes against ROS by a polymer, a porous material, or a supramolecular assembly.[14–16] These approaches have had, however, a limited success due to a significant increase in size and a general loss of brightness by the quenchers present in the passivation layers. As an example, inorganic calcium phosphate nanoparticles mixed with dyes (called FloDots) have been developed to pre-pare photostable fluorescence probes for imaging,[17] but the size constraints (10–120 nm) do limit the diffusion properties of the probe.
Inspired by these passivation strategies and advances on the encapsulation of organic dyes inside single-walled carbon nanotubes (SWCNTs),[18–21] we explored different hosts to pro-tect dyes while keeping both small (nanometer) sizes and good optical properties (e.g., brightness and stability). Because of efficient energy transfer processes between dyes and SWCNT hosts (Eg < 1 eV), it became apparent that the dye fluorescence is readily quenched in most, if not all, of the nanohybrids with carbon nanotubes.[22,23] Hence, we turn our attention to the boron nitride nanotube (BNNT), which has a large bandgap (Eg ≈ 5.5 eV)[24,25] and hence high optical transparency over a wide range of wavelengths. In the context of life science, large diameter BNNTs (d ≈ 50 nm) have been studied as cargo for drug delivery[26] and the toxicity in vivo and in vitro of dif-ferent BNNTs is currently investigated in the field.[27] Here, we present a method to encapsulate dyes inside small-diameter BNNTs (dyes@BNNTs) and explore, using different dyes, their chemical and fluorescence properties for imaging appli-cations. Our experiments on α-sexithiophene (6T) and deriva-tives of 3,6-bis[2,2′]bithiophenyl-5-yl-2,5-di-n-oc-tylpyrrolo[3,4-c] pyrrole-1,4-dione (DPP) encapsulated inside small-diameter BNNTs (dinner < 3 nm) show a drastic improvement of the photostability compared to free dyes against laser exposure. We observe strong absorption and emission bands from three different e ncapsulated d yes, which a re significantly re dshifted compared to “free” (i.e., not encapsulated) dyes. We also report on an effective passivation of the dyes against the environment. Using various imaging demonstrations with living organ-isms (Daphnia pulex) and human cells (HuH6), we observe a reduced toxicity compared to free dyes and demonstrate their exceptional photostability. Finally, their use as nanoprobes for multimodal imaging at wavelengths in the visible and NIR is presented along with examples of two-photons imaging and single nanoprobe tracking experiments.
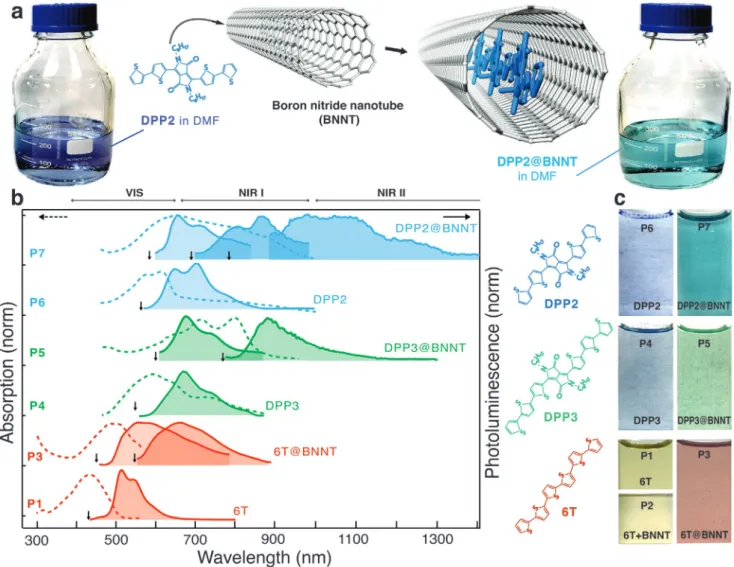
Figure 1 schematizes the main synthesis steps of the dye nanohybrids along with the absorption and fluorescence responses obtained before and after the encapsulation step. The synthesis begins by cutting raw BNNTs (BNNT LLC sup-plier) using mechanical grinding and ultrasound treatments. The resulting material is then purified in nitric acid and annealed at high temperature in air[28] to suppress photolumi-nescence background from BN defects and BxOy impurities[29] (Figure S1, Supporting information). The last step is a liquid phase encapsulation of a selected dye molecule, for example, DPP2 (Figure 1a), in thus processed BNNTs, followed by a thor-ough rinsing in dimethylformamide (DMF)/toluene and finally briefly in a piranha s olution at room temperature to r emove
excess of dye molecules. (Warning, piranha solutions are highly corrosive and must be handled with great care while avoiding contact of the solution with residue of organic solvents). The resulting solid residue can be dispersed in a solvent and yields a highly colored solution, such as shown in Figure 1a,c.
The first signature of encapsulation is a clear color change compared to that of free dyes. In Figure 1c, the coloration of the free 6T in DMF (P1) is compared to that of a mixture of 6T and BNNTs after an encapsulation step in toluene for 24 h at 25 °C (P2) and 115 °C (P3). No change is observed between P1 and P2, whereas a clear change from yellow to red is observed for P3. As detailed below, the change in color is driven by temperature and unambiguously indicates that the dyes have filled the BNNTs. Similar spectral changes of the dye reso-nances are also observed with other rod-like molecules. For example, the derivatives of 3,6-bis[2,2’]bithiophenyl-5-yl-2,5-di-n-oc-tylpyrrolo[3,4-c]pyrrole-1,4-dione (DPP2 and DPP3) are encapsulated using the same protocol but at 80 °C (Figure 1c; Section S2.2, Supporting Information). The behavior observed here with BNNTs is fully consistent with previous results from our group on dye encapsulation in SWCNTs.[22] For both types of nanotubes, the filling process is endothermic, due to a heat unbalance from intermolecular interactions between dyes (encapsulated) molecules and between (free) dyes and solvent molecules.
In Figure 1b, we explore more quantitatively the trans-formation using a comparison of different Dyes@BNNTs (P3, P5, and P7) in DMF with solutions of the same dyes in DMF (P1, P4, P6). The solutions of free dyes, namely 6T (P1), DPP3 (P4), and DPP2 (P6), display absorption (dashed line) and fluorescence (continuous line) spectra character-ized by vibronic band progressions that are typical for the dyes in DMF.[30,31] Note that the concentration used for the solutions of free dyes have been adjusted to minimize self-aggregation in solution, which can significantly modify the vibronic progression.[32] Surprisingly, the solutions of encap-sulated dye molecules (P3–P5–P7) display drastically modi-fied spectra and more complex vibronic structures. DPP3@ BNNT and DPP2@BNNT present remarkable changes, such as new absorption and emissions bands that are significantly redshifted compared to that of free dyes. Interestingly, photoexcitation experiments on P5 and P7 solutions at energies within the absorption bands produce very distinct PL spectra, typically characterized by a broadened vibronic progressions and new emission bands significantly redshifted compared to free dyes. For example, DPP2@BNNT excited at 690 nm and 800 nm show emission bands that are clearly shifted at around 900 nm and 1050–1200 nm, respectively. A similar behavior, although not as drastic, is seen with 6T@BNNT solutions (P3). A more direct comparison of the spectral shifts with that of free dyes is presented in Figure S9, Supporting Information. The unusual redshift could be explained by dif-ferent phenomena, such as charge transfer, photoinduced electrochromism, structural changes, but these effects have been ruled out by experimental evidences. Charge transfer is impeded considering the good insulating capability of the BNNT sheath from the environment. The wide gap of the BNNTs minimizes also the presence of electronic traps in the proximity of the encapsulated dyes. The selected dyes are rigid
and planar and they are not prone to conformational changes and photochromism. Furthermore, the mild conditions used for the encapsulation procedure (see Supporting Information) pre-vent chemical reaction between dyes.
Such drastic changes in optical properties strongly suggest that the inner space of the BNNT has templated the encapsu-lated dyes into well-defined aggregates. To test this hypothesis, we examine the morphological arrangements of the dyes using high-resolution transmission electron microscopy (HRTEM).
Figure 2 shows images of double- and multiwalled BNNTs
deposited onto a molybdenum–SiO2 (Mo/SiO2) TEM grid after applying a filling process in solution with 6T molecules. More examples of HRTEM are also shown in Figures S11 and S12, Supporting Information. To determine that the filling material is composed of 6T molecules, preliminary experiments were performed using scanning transmission electron microscopy and energy electron loss spectroscopy (STEM-EELS) recorded
at 80 kV to gain information on the chemical composition (core-loss) and the near-band edge response (low-loss) of the filling materials with a spatial resolution of around 2.5 nm (Figure S10, Supporting Information). The HRTEM image in Figure 2b provides distinct responses in the empty and filled regions (open circles 1 and 2, respectively), which are presented in Figure 2c–e. The boron K-edge from the shell structure of the BNNT at 192 eV is measured, as expected, in both regions 1 and 2, but a new contribution is detected only in region 1 at the energy corresponding to the L2,3-edge of the sulfur atoms in a 6T molecule. Local energy loss measurements in regions 1 and 2 (Figure 2e) show the expected transitions at around 3 eV (region 1) for the HOMO–LUMO gap of 6T molecules and at 5.5 eV (region 2) for the BNNT bandgap. Consistent to other HRTEM studies on similar oligothiophenes encapsulation inside SWCNTs,[19,20,33,34] the EELS results presented here con-firm that the 6Ts are encapsulated inside BNNTs.
Figure 1. Absorption and fluorescence properties of 6T@BNNTs, DPP2@BNNTs, and DPP3@BNNTs. a) Schematic view of the encapsulation of DPP2 dye in a double-wall BNNT and the resulting color change before and after encapsulation in DMF. b) Absorption (dashed) and fluorescence (continuous) spectra at room temperature of the solutions P1 and P3–P7. The excitation wavelength used for each PL spectrum is indicated by a vertical black arrow. c) Schematics of 6T and DPP-based dyes molecules (left) and pictures of the solutions in DMF before and after a liquid phase (toluene) encapsulation at different temperatures: 25 °C (P2) and 115 °C (P3) for 6T; 80 °C for DPPs (P5 and P7). P1, P4, and P6 are solutions of free dyes (no BNNT) in DMF.
The HRTEM images in Figure 2f show a progressive ordering of the 6T dyes, from disordered assemblies to well-aligned individual molecules, for inner diameters (dinner) from 7 nm down to 0.9 nm, respectively. A key result for this study is the presence of single and double aggregates of 6T molecules inside BNNTs having the smallest dinner. These aggregates are nicely resolved in Figure 2f as short sticks (pointing orange arrows) located inside BNNTs of dinner = 0.90, 1.00, and 1.55 nm for single, double, and triple aggregates, respectively. Note that the double aggregate is schematically shown in Figure 2a. It is clear from the TEM experiments that high confinement (i.e., low dinner) induces molecular ordering and alignment along the nanotube axis. A cavity of dinner = 4 nm is, for instance, much larger (about twice) than the length of the molecule and provides higher degrees of freedom to accommodate various assemblies, whereas dinner = 0.9 nm (the smallest diameter observed in our samples) provides just enough space to fit one molecule in a head-to-tail type of stacking.
The assembly of elongated dyes inside BNNTs into aligned and structured aggregates is consistent with what was observed previously with SWCNTs.[19–22,33,35] However, the distribution of the inner dimeters in our BNNT samples is much wider than
SWCNTs, which adds complexity to the population distribu-tion of aggregates. Depending on the diameter, both complex or simple alignments between adjacent molecular transition dipole moments are formed, which lead de facto to a mixture of aggregation states in our samples. As seen in the HRTEM images (Figure 2f), the head-to-tail stacking of the encapsu-lated dyes in small-diameter BNNTs coexists in solution with face-to-face arrangements in larger diameter BNNTs, giving in some cases double and triple rows of molecules. The former morphology corresponds to the emblematic J-aggregation state, while the latter is consistent with a H-aggregate, each pro-moting specific intermolecular interactions.[36,37]
Considering the diversity of morphologies in our samples, one should therefore expect specific optical signatures associ-ated to possible H-like, J-like, and HJ-states, as well as other photophysical phenomena such as Davidov splitting, excimers and energy transfers.[32,36,37] By shifting the excitation wave-lengths well below the gap of free dyes (arrows, Figure 1), we clearly see for instance new vibronic bands that are strongly shifted toward the NIR. This reflects subpopulations of aggre-gation states that are consistent with J- or HJ-like bright emit-ters in small-diameter BNNTs.[32,38,39] Such J-aggregation
Figure 2. Structural properties of α-sexithiophene (6T) encapsulated inside a double-walled boron nitride nanotubes (6T@BNNTs). a) Schematic view
of the structure of 6T molecules encapsulated in double-wall BNNTs. b) HRTEM image of a partially filled 6T@BNNT suspended on a molybdenum– SiO2 TEM grid. c,d) Chemical analysis of selected areas (1) and (2) in (b) using core-loss STEM-EELS at the boron K-edge (192 eV) and sulfur L2,3-edge
(165 eV). e) Measurements of the energy levels in the same two areas by STEM-EELS in the 1–10 eV energy range. f) HRTEM images of 6T molecules inside BNNTs of different diameters. The HRTEM and STEM-EELS data are recorded at 80 kV.
fingerprints with large redshifts have been previously observed by Sun et al. in self-assembled nitroazo dyes or cyanine dyes and applied in demonstrations of in vivo bioimaging in the NIR II.[40,41] The case of P7 is of particular interest because the emission is redshifted by more than 600 nm, which is sur-prising for dyes that normally fluoresce in the visible. Under-standing the bands and vibronic structures in such a complex mixture of aggregates is obviously not straight forward and clearly outside the scope of this work. Ongoing work explores approaches to disentangle each population of aggregates using for instance sorted BNNTs by inner diameters.
Using CdSe/ZnS quantum dots as quantum yield (QY) internal reference,[42,43] we estimated a lower bond value between 8% and 16% for 6T@ BNNTs on Si/SiO2 (see details in Figure S13, Supporting Information). The QY value is signifi-cantly higher than 0.5%, which is a typical for 6T films,[44] and it is close to the values measured on individual 6T in solution or assemble as J-aggregates.[45]
The passivation of the dyes with the crystalline dielectric sheath of the BNNT walls is tested next using stability meas-urements against photobleaching and chemical reactions. To do so, we compared in Figure 3 the PL properties of free dyes with that of individual or small bundles of 6T@BNNTs
deposited on an inert Si/SiO2 substrate in ambient condi-tions. A typical AFM image is shown in Figure S2, Supporting Information. Note that an oxide thickness of ≈300 nm was chosen to avoid destructive optical interference with the sub-strate. To gain statistics, a global hyperspectral imager (RIMA, Photon etc.) was used to photoexcite uniformly a large area of the sample (200 × 200 µm2) with continuous laser light[46] at λex = 532 nm. This configuration has given us a large statis-tical ensemble of measurements on individualized bundles of 6T@BNNT as a function of exposure time and fluence condi-tions. As an example, Figure 2a shows a zoomed view of the PL image of a 5 µm long bundle at a laser fluence typical for bioimaging (1.2 µW µm−2). In Figure 3b, the PL signal of the bundle shows no noticeable intensity loss with exposure time, even after exposure for more than 8 h in air. This interesting result indicates a clear resistance against photobleaching, which is also demon strated with the DPP nanohybrids in Figure 3b. The result contrasts with the fast fading PL signal (in red) of free dyes (not encapsulated) dispersed on the sub-strate. As expected, the half lifetime of the integrated emission (τ1/2) of free dyes is only few minutes, which is typical for an organic dye, whereas individual dyes@BNNT bundles produce unaltered PL after more than 30 h. The measurement is only
d
a
PL (a.u)
0.0 0.5 1.0 0 2 4 6 8Time exposure (h)
b
Free DPP2 DPP2@BNNT 6T@BNNTPL (a.u)
0.0 0.4 0.8 1.2Wavelength (nm)
600Before O2 plasma After O2 plasma
Free 6T 6T@BNNT 2 µm 1.5 0.0 0.4 0.8 1.2 800 700 500 900 500 600 700 800 900
Wavelength (nm)
6T@BNNT Free 6T 6T@BNNTPL (a.u)
Time exposure (sec)
0.0 1.0 0 40 80 120 6T@BNNT
PL (a.u)
c
20 30 2 µm DPP2@BNNT (1300 nm) (550-800 nm)Figure 3. Photostability and chemical resistance of 6T@BNNTs. a) Left panel: Fluorescence image recorded at 1300 nm (4 nm of spectral interval) from a DPP2@BNNT deposited on a Si/SiO2 substrate (λex = 800 nm). The acquisition time is 10 s at a fluence of 1.0 µW µm−2. Right panel: Integrated
luminescence imaging of a typical microbundle of a 6T@BNNT deposited on a Si/SiO2 substrate (λex = 532 nm). The time acquisition is 0.2 s and
the laser fluence is 1.2 µW µm−2. b) Time evolution of the integrated PL of isolated bundles of 6T@BNNTs (blue) and DPP2@BNNTs (green) on a Si/
SiO2 surface, compared to free DPP2 (red) photoexcited under a fluence of 1.2 µW µm−2 at λex = 532 nm (long pass filter at 533 nm). c) PL intensity
recorded at time intervals of 0.5 s. d) PL spectra (λex = 473 nm) of free 6T and 6T@BNNT deposited on a substrate recorded before (left) and after
limited here by our setup to a factor of 1 × 10⁴. Furthermore, PL images taken at the level of a single dye nanohybrid with a frame rate of 0.5 s indicate no blinking under a fluence of 1.2 µW µm−2 at λ
ex = 532 nm (Figure 2c). These photostability results are impressive considering that this is a lower bound estimate.
The chemical stability of the nanohybrids is tested using individualized 6T@BNNT bundles on Si/SiO2 exposed to an oxygen plasma of 100 W for 10 min. No significant change in the PL spectral shape and intensity is detected after this treat-ment, whereas free 6T molecules on Si/SiO2 have completely vanished (Figure 3d). The enhanced stability of the encapsu-lated dyes has also been observed upon thermal annealing up to 350 °C in air and using piranha solutions (not shown). These results demonstrate that the 6T@BNNT is far more stable than free 6T dyes. The chemical and physical stability experiments have been repeated on a number of Dyes@BNNT nanohybrids of different lengths deposited on substrates or dispersed in a solution (see, e.g., Figures S5 and S6, Supporting Informa-tion). All of the results lead us to the same conclusion, which
underlines the tremendous gain in stability inferred by the con-finement of the 1D cavity of BNNTs.
The impressive robustness and fading-free properties of the Dyes@BNNT are appealing for bioimaging applications.
Figure 4 presents an example of the use of nanohybrids
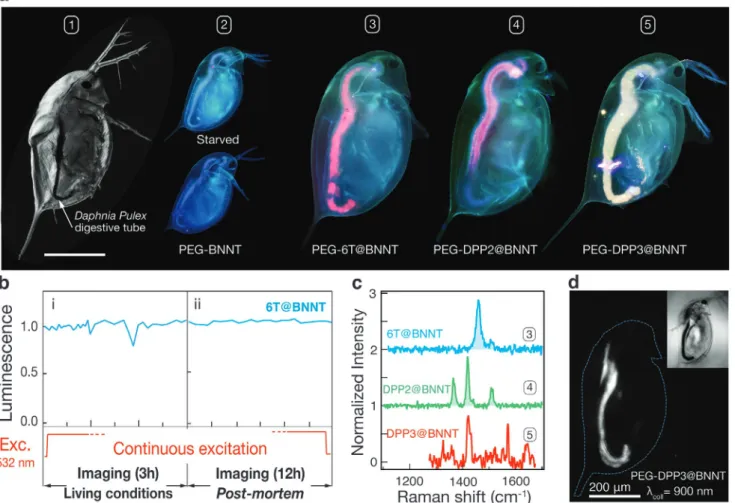
to make optical nanoprobes for imaging living Daphina Pulex microorganisms in water—see bright-field image in Figure 4a#1. Daphnia (also called water fleas) are common planktonic crustaceans, which find use as chemical sensors in ecotoxicology studies, thanks to their high sensitivity to water quality.[47] To acquire the bioimages (Figure 4a#2–5), we first solubilized the Dyes@BNNTs in a water-based living medium called FLAMES,[48] using a poly (ethylene) glycol derivative (mPEG-DSPE) (Section S2.9, Supporting Information). We then performed a first incubation test by placing a Daphnia in different FLAMES containing either free 6T, only PEG-BNNTs, or PEG-dyes@BNNTs (see Table S1 and Figure S3, Supporting Information). After an incubation time of only a few minutes, all daphniids exposed to free 6T were found dead. This is con-sistent with the known toxicity of the dyes to living organisms, Figure 4. Dyes@BNNTs as hypermodal nanoprobes illustrated for Vis-NIR bioimaging of Daphnia Pulex. a) Z-reconstructed confocal optical image of a Daphnia immobilized in Leica medium (#1). PL images recorded through a fluorescence microscope mounted with a UBG filter and 10× objective lens of living starved Daphnia (top #2) and after incubation in a solution of unfilled BNNTs (bottom #2), 6T@BNNTs (#3), DPP2@BNNTs (#4), and DPP3@BNNTs (#5). b) Luminescence intensity time-lapses of dyes@BNNTs: i) in living conditions, ii) in post-mortem conditions. c) Raman spectra at λex = 532 nm taken in the region of the digestive tube of Daphnia for #3 and at λex = 633 nm for #4 and #5. d) PL image of a living Daphnia collected
at a wavelength of 900 nm using an excitation at λex = 532 nm. Inset: Optical image of the Daphnia. The scale bar is 200 µm for images #1, #3–#5
as evidenced already in the twentieth century by many studies on drugs and contrast agents.[49] On the contrary, all of the Daphnia assays incubated with both BNNT and PEG-dyes@BNNT remain alive and active after incubation times ranging from a few minutes to 36 h at concentrations between 10 and 50 µg mL−1 (see video in Figure S4, Supporting Infor-mation). This underlines the multiple roles of the BNNT host: i) stabilizing the PL signal from the nanoprobe, ii) acting as a protective barrier against ROS, and iii) reducing dye toxicity to the living organisms. Living daphniids were imaged under a fluorescence microscope equipped with UBG filter and a 10× objective. D. Pulex incubated with PEG-BNNTs (i.e., no dye, Figure 4a#2 down) presents similar signal than that observed from non-incubated Daphnia (Figure 4a#2 top). This natural blue-green signal originates from the autofluorescence of the tissues in FLAMES through the UBG filter, which disappears after death or after a few minutes only of photobleaching. In contrast, Daphniids incubated with PEG-Dyes@BNNTs (Figure 4a#3–5) exhibit a distinct digestive tube emitting bright signals assigned to the spectral lineshape of each PEG-Dyes@ BNNTs nanohybrids.
In a second set of experiments, we investigated the photo-stability of the nanoprobes during in vivo PL imaging of D. Pulex under continuous light excitation. Daphniids were main-tained alive during the first 3 h of the time-lapse by adding more FLAMES to maintain temperature and compensate water evaporation under the microscope. The PL intensity, recorded every 3 min at six different points of the digestive tube (Figure 4a), remains flat with time, which indicates that bleaching is suppressed in such continuous photoexcitation despite the fact that the nanoprobes are in close contact with the ROS present in the water-based medium of the digestive tube of Daphniids. The brief and temporary drops of signal at 1 h and 3 h are attributed to sudden movements of the Daphnia in the exiguous swimming pool under the microscope objec-tive (Figure 4b). Even after death, which is typically caused by a drying of the FLAMES medium, the signal of the nanoprobes remain stable for an additional 12 h of continuous excitation/ imaging without any noticeable loss of signal (Figure 4b). Inter-estingly, the Raman spectra in Figure 4c, recorded at the level of the digestive tube of Daphnia #4 and #5, show that the spe-cific vibrational fingerprint of the encapsulated 6T (or DPP) in BNNTs remain intact. This signal can be readily extracted and identified from the luminescence signal, thanks to the reso-nance enhancement of the dyes at λex = 532 nm. This experi-ment demonstrates that the encapsulated dyes are not altered in the digestive tube of the living Daphnia and that they are highly photostable, giving further statistics of the effective pas-sivation by the BNNT hosts.
The capability to probe in situ both the fluorescence and Raman scattering of different nanoprobes over a timescale of many hours is interesting for bioimaging using multi-modal probes. Similar to the work on carbon nanotubes based NIR nanoprobes,[50–53] which emit at wavelengths beyond 900 nm, we performed experiments using a DPP3@BNNT incubated in Daphnia. By changing the dyes, we were able to easily extend the PL emission of the nanoprobes (Figure 4d) to the NIR I optical biowindow.[54,55] From this and the results in Figure 1, it is clear that the emission properties of
DPP2@BNNT allows excitation in the NIR I and detection in the NIR II, which is of interest for deep imaging studies on animals such as mice.
To further assess a possible toxicity of the Dyes@BNNT, we performed an additional set of experiments at the scale of individual cells. We incubated 10 µg mL−1 of a PEG-6T@ BNNT solution for 24 h with human hepatoblastoma HuH6 cells, which is one of the model cell lines used for toxicology studies.[56,57] After removal of the media containing Dyes@ BNNTs, the cells membranes was revealed using 5 µL mL−1 of DiA fluorophore for 10 min (see Supporting Information).
Figure 5a,c show fluorescence spectra consistent with DiA
(green) and PEG-6T@BNNT (red) separated in the regions 2 and 1, respectively. In these conditions, we observe that the DiA are fixed, as expected in the cell membranes, while the nano-probes are internalized by the cells and accumulated in endo-cytoplasmic compartments.[57] In addition, a positive green Calcein staining assay shows no lethality of the cells in this time scale (Figure S7, Supporting Information). In Figure 5b, we investigated the imaging capability and photostability of the PEG-6T@BNNT using two-photon imaging techniques on HuH6 cells fixed after an incubation of nanoprobes followed by DiA at a concentration of 10 µg mL−1 and 5 µL mL−1, respec-tively (see Supporting Information). The fluorescence of both the DiA and PEG-6T@BNNT, as a function of the excitation wavelength between 740 and 1020 nm, is shown in Figure 5d. Consistent with the work by Ruthazer et al.,[58] the resonance maximum of DiA is measured at 880 nm, which is distinct from the resonance of the PEG-6T@BNNT located at ≈740 nm, a position similar to that of functionalized polythiophene.[59] A wavelength centered at 860 nm was used in Figure 5a to expose simultaneously DiA and PEG-6T@BNNT in the bleaching test area highlighted (dashed line) with two-photon imaging condi-tions during 30 min (400 Hz, laser output power of 2.55 W). To directly compare exposed and non-exposed cells, Figure 5b pre-sents a two-photon hyperspectral fluorescence image taken in a field of view slightly larger than the photobleaching test area. The exposed DiA have been significantly photobleached, while the PEG-6T@BNNTs are still strongly fluorescent without loss of signal. This result highlights the photostable response of the Dyes@BNNT against the stringent two-photon illumina-tion condiillumina-tions. This result demonstrates long term (day-scale) monitoring without the need of periodic injection of contrast agents.
Finally, the last experiment tracks individual Dyes@BNNT in cellular environment. Because of their 1D architectures, these nanoprobes should have similar diffusion properties than individual SWCNTs, which are advantageous for studies in biological media.[60,61] Using another solution of PEG-6T@ BNNT with an excess of PEG to lower the interaction with the cell membrane (0.5 µg mL−1 in DMEM), we incubated the nanoprobes for 24 h followed by rinsing to remove non-inter-acting nanoprobes with the confluent cell mat (see Supporting Information). Time-lapse luminescence during 30 min with a time interval ∆t of 650 ms between two images is shown in Figure 5e. The superposition of few sequential fluorescence images of a single 6T@BNNT nanoprobe, extracted for clarity from the datacube every ≈10 s, is displayed in the top panel of Figure 5e. By using a single object tracking algorithm,[62]
we reconstructed the trajectory of four individual nanoprobes in the Figure 5e (bottom panel). As expected, the nanoprobes are clearly photostable and the diffusion length is larger than the size of the cells. We do not observe internalization of the nanoprobes in this case, which is probably due to the high coverage of PEGs promoting higher biological furtivity of the nanoprobes.
Previous works on the functionalization of multiwalled BNNTs have shown that BNNTs are outstanding as templates to develop biocompatible nanostructures for drug delivery.[26,63,64] In this work, we have shown that small-diameter BNNTs can template active organic molecules for: 1) unlocking and sta-bilizing naturally unfavorable aggregation states with dyes that will gain access to complex fluorescence engineering on the nanometer scale for the design of bright emitters; 2) pro-tecting the dyes against photobleaching and chemical degrada-tion mechanisms; 3) reducing the inherent toxicity of organic dyes on living tissues; 4) enabling both chemical processing and easy functionalization of the dyes aggregates, thanks to the BNNT carriers. Capitalizing on these synergetic advances, we have finally highlighted the use of the dyes@BNNTs as fluo-rescence nanoprobes. Since the preparation of dyes@BNNT is simple and general, we trust that the approach can be further expanded to include other dyes and diameter-sorted BNNTs so as to produce a library of nanoprobes with tuneable colors from the visible down to the NIR I and II for deeper imaging into living organisms.
Experimental Section
The boron nitride nanotubes (BNNTs) used in this work are provided by BNNT. See Sections S2.1 and S2.2, Supporting Information, for details on cleaning and encapsulation of BNNTs. Briefly, the BNNT powder was sonicated in DMF until complete dispersion, and filtrated on a poly(tetrafluoroethylene) (PTFE) filter (0.2 µm pore size). The obtained film was annealed at 800 °C for 2 h under atmospheric conditions. About 5 mg of dyes and 20 mg of purified BNNTs were dispersed sequentially in 20 or 300 mL of toluene, depending on the dye used, by sonication. The solution was then refluxed at 80 °C or 115 °C, again depending of the dyes used, to activate the encapsulation. The solution was finally washed in toluene and DMF at least 10 times to remove the free dyes molecules, until the filtrate became colorless. The absorption spectra presented in Figure 1 were acquired using a Bruker vertex v80 spectrometer with CaF2 beamsplitter and Si and GaP detector. The fluorescence spectra
presented in Figure 1 were recorded using a spectrofluometer from Horiba JY equipped with PMT and InGaAs detectors.
For experiments on individualized Dyes@BNNTs on surface, the Dyes@BNNTs were suspended in N,N-dimethylformamide (DMF) and diluted as needed, typically at a concentration of ≈0.1 mg mL−1. This
solution was spin-coated at 3000 rpm on a cleaned Si/SiO2 substrate
with aminopropyltriethoxysilane functionalization.
For experiment with Daphnia, an incubation solution was prepared by dispersing Dyes@BNNT in FLAMES culture medium at a concentration ranging from 5 to 100 µg mL−1. Adult individuals of D. Pulex (clones
DISP 1312) were kept at 22 °C in FLAMES with algae for 4 days before the experiment, allowing for a new reproducing cycle. Then, the specimens were transferred to a FLAMES medium algae-free and remained there for 1 day at minimum to clean the digestive system and limit any PL from algae during the images/time lapse acquisition. Daphniids were then Figure 5. Imaging of Dyes@BNNTs in a HuH6 cells mat. a) Hyperspectral and confocal fluorescence imaging of liver cells incubated with PEG-6T@BNNT for 24 h and with DiA for 10 min before imaging. The red and green channels correspond to the integrated intensity from 600 to 780 nm and 490 to 520 nm, respectively. b) Hyperspectral two-photon fluorescence image of fixed hepatoblastoma cells previously incubated for 24 h with PEG-6T@BNNTs. The dashed line highlights a bleaching test area where the DiA and the PEG-6T@BNNTs were illuminated in two-photon imaging conditions at λex = 860 nm for 30 min. The red and green channels correspond to the integrated intensity from 645 to 715 nm
and from 500 to 530 nm, respectively. c) Fluorescence spectra extracted from the hyperspectral datacube of regions 1 and 2 in (a). d) Two-photon fluorescence excitation profiles of the DiA and PEG-6T@BNNT extracted from an hyperspectral fluorescence image datacube. e) Top: Tracking of a single PEG-6T@BNNT nanoprobe in confluent HuH6 cells using a superposition of luminescence images extracted every 30 s from a time-lapse datacube (∆t = 650 ms, λex = 488 nm). Bottom: Full trajectory reconstruction using a tracking algorithm (see Supporting Information) of the four
placed in the incubation solution for the required time. More details on the experiments with Daphnia and characterizations of the samples are provided in Sections S2.9 and S3, Supporting Information.
The AFM images were produced using a Dimension 3100 microscope. The Raman/PL measurements were taken from different set-up depending on the experiments and these instruments and conditions are summarized in Table S2, Supporting information. In summary, luminescence images and photobleaching experiments were performed at λex = 532 nm using the Raman/PL mapping system RIMA
(Photon etc.) using a 100× objective and a laser power ranging from 0.5 to 80 µW µm−2. The fluorescence images on Daphnia were acquired with
an Olympus confocal microscope equipped with a U-RFL-T mercury light source, a BX-UCB controller and a DP71 digital camera. The images were acquired with a 10× objective and UBG, TRITC and TXRED filters. The acquiring conditions were an exposure time of 1/20 s and ISO 200 sensitivity. Z-stack of 20 images to probe the volume of the Daphnia was acquired by confocal imaging and stacked using the Auto-blend function in Photoshop. The hyperspectral and confocal fluorescence images on confluent HuH6 hepatoblastoma cells, previously incubated for 24 h with PEG-6T-BNNT at a concentration ranging from 0.5 to 10 µg mL−1, were recorded on two different setup: a Leica microscope
SP8 WLL2 using a HCX Plan Apo CS2 63× oil NA 1.40 objective or a HC PL FLUOTAR 10×/0.30 DRY objective and a Leica TCS SP5, using either Argon laser or Mai Tai HP laser (SpectraPhysics, Irvine, USA) and a HC PL APO CS2 40.0 × 1.30 oil objective.
Supporting Information
Supporting Information is available from the Wiley Online Library or from the author.
Acknowledgements
This work received financial support from the Natural Sciences and Engineering Research Council of Canada (NSERC) under grants RGPIN-2019-06545 and RGPAS-2019-00050 and Canada Research Chairs and the Canada foundation for innovation, 35637. C.A., R.N., P.D., and R.M. acknowledge support from the consortium industriel de recherche et d’innovation en technologies médicales du Québec (MEDTEQ) in collaboration with the partners Photon etc. and La fondation du cancer du sein du Québec. E.G. acknowledges funding from the Marie-Skłodowska-Curie-IF 706476-BrightPhoton, the GDRi Graphene and Co, the GDRi multifunctional nanomaterials for travel support, and Graphene Flagship Core 1 (No. 604391). The authors warmly acknowledge G. Wang for support on the Cs-corrected TEM of MPQ – Paris Diderot University and METSA support for access to the Cs-corrected TEM of MPQ. The authors thank Cristescu’s team (McGill University) for providing Daphniids, culture medium, algae, and technical assistance, L. Gaboury and J. Hinsinger for access to the Platform of Histology at Institut de Recherche en Immunologie et en Cancerologie (IRIC), and BNNT LLC for providing raw BNNTs. The authors thank the Bordeaux Imaging Center (a service unit of the CNRS-INSERM and Bordeaux University, member of the national infrastructure France BioImaging supported by the French National Research Agency [ANR-10-INBS-04]) and Sebastien Marais and Christel Poujol for her technical assistance. The authors also thank N. Courtois-Allain and F. Saltel for providing the HuH6 cell line. G.R. is a board member of the GdR CNRS ImaBio, funded by La Ligue contre le Cancer (Gironde), the Association de Recherche contre le Cancer, and the GSO Cancéropole. Ethical approval for work on Daphnia is not required.
Conflict of Interest
The authors declare no conflict of interest.
Authors Contributions
C.A., R.N., F.F., L.S., G.R., A.L., R.M., and E.G. performed the experiments and analyzed the results. C.A., R.M., and E.G. designed the experiments. C.A., R.N., R.G., E.F., and E.G. prepared the samples. P.D., R.M., and E.G. supervised the work and discussed the results. All authors contributed to the scientific discussions, manuscript preparation, and final version.
Keywords
bio-imaging, nanotube heterostructure, NIR-II fluorescence, molecular aggregation, photostable fluorescence
[1] V. Marx, Nat. Methods 2015, 12, 187. [2] A. Dufton, J. Soc. Dyers Colour. 1894, 10, 90. [3] M. Kasha, Discuss. Faraday Soc. 1950, 9, 14.
[4] J. Widengren, U. Mets, R. Rigler, J. Phys. Chem. 1995, 99, 13368. [5] R. E. Di Paolo, L. B. Scaffardi, R. Duchowicz, G. M. Bilmes, J. Phys.
Chem. 1995, 99, 13796.
[6] W. E. Moerner, M. Orrit, Science 1999, 283, 1670. [7] Al. L. Efros, M. Rosen, Phys. Rev. Lett. 1997, 78, 1110.
[8] C. Galland, Y. Ghosh, A. Steinbrück, M. Sykora, J. A. Hollingsworth, V. I. Klimov, H. Htoon, Nature 2011, 479, 203.
[9] J. Widengren, R. Rigler, Bioimaging 1996, 4, 149.
[10] E. M. S. Stennett, M. A. Ciuba, M. Levitus, Chem. Soc. Rev. 2014, 43, 1057.
[11] A. Diaspro, G. Chirico, C. Usai, P. Ramoino, J. Dobrucki, in Hand
book Of Biological Confocal Microscopy (Ed: J. B. Pawley), Springer,
Boston, MA, USA 2006, pp. 690–702. [12] J. White, E. Stelzer, Trends Cell Biol. 1999, 9, 61.
[13] T. Bernas, M. Zarebski, R. R. Cook, J. W. Dobrucki, J. Microsc. 2004,
215, 281.
[14] D. Thomsson, R. Camacho, Y. Tian, D. Yadav, G. Sforazzini, H. L. Anderson, I. G. Scheblykin, Small 2013, 9, 2619.
[15] K. J. Lee, J. H. Oh, Y. Kim, J. Jang, Chem. Mater. 2006, 18, 5002. [16] M. J. Frampton, H. L. Anderson, Angew. Chem., Int. Ed. 2007, 46,
1028.
[17] G. Yao, L. Wang, Y. Wu, J. Smith, J. Xu, W. Zhao, E. Lee, W. Tan,
Anal. Bioanal. Chem. 2006, 385, 518.
[18] K. Yanagi, Y. Miyata, H. Kataura, Adv. Mater. 2006, 18, 437. [19] M. A. Loi, J. Gao, F. Cordella, P. Blondeau, E. Menna, B. Bártová,
C. Hébert, S. Lazar, G. A. Botton, M. Milko, C. Ambrosch-Draxl,
Adv. Mater. 2010, 22, 1635.
[20] E. Gaufrès, N. Y.-W. Tang, F. Lapointe, J. Cabana, M.-A. Nadon, N. Cottenye, F. Raymond, T. Szkopek, R. Martel, Nat. Photonics 2014, 8, 72.
[21] S. Cambré, J. Campo, C. Beirnaert, C. Verlackt, P. Cool, W. Wenseleers, Nat. Nanotechnol. 2015, 10, 248.
[22] E. Gaufrès, N. Y.-W. Tang, A. Favron, C. Allard, F. Lapointe, V. Jourdain, S. Tahir, C.-N. Brosseau, R. Leonelli, R. Martel, ACS
Nano 2016, 10, 10220.
[23] S. van Bezouw, D. H. Arias, R. Ihly, S. Cambré, A. J. Ferguson, J. Campo, J. C. Johnson, J. Defillet, W. Wenseleers, J. L. Blackburn,
ACS Nano 2018, 12, 6881.
[24] X. Blase, A. Rubio, S. G. Louie, M. L. Cohen, Europhys. Lett. 1994,
28, 335.
[25] R. Arenal, O. Stéphan, M. Kociak, D. Taverna, A. Loiseau, C. Colliex,
[26] J. Niskanen, I. Zhang, Y. Xue, D. Golberg, D. Maysinger, F. M. Winnik, Nanomedicine 2016, 11, 447.
[27] A. Merlo, V. R. S. S. Mokkapati, S. Pandit, I. Mijakovic, Biomater.
Sci. 2018, 6, 2298.
[28] H. Chen, Y. Chen, J. Yu, J. S. Williams, Chem. Phys. Lett. 2006, 425, 315.
[29] N. Chejanovsky, Y. Kim, A. Zappe, B. Stuhlhofer, T. Taniguchi, K. Watanabe, D. Dasari, A. Finkler, J. H. Smet, J. Wrachtrup, Sci.
Rep. 2017, 7, 14758.
[30] F. C. Spano, J. Clark, C. Silva, R. H. Friend, J. Chem. Phys. 2009, 130, 074904.
[31] D. P. Ostrowski, L. A. Lytwak, M. L. Mejia, K. J. Stevenson, B. J. Holliday, D. A. Vanden Bout, ACS Nano 2012, 6, 5507. [32] A. J. Musser, S. K. Rajendran, K. Georgiou, L. Gai, R. T. Grant,
Z. Shen, M. Cavazzini, A. Ruseckas, G. A. Turnbull, I. D. W. Samuel, J. Clark, D. G. Lidzey, J. Mater. Chem. C 2017, 5, 8380.
[33] Y. Almadori, L. Alvarez, R. Le Parc, R. Aznar, F. Fossard, A. Loiseau, B. Jousselme, S. Campidelli, P. Hermet, A. Belhboub, A. Rahmani, T. Saito, J.-L. Bantignies, J. Phys. Chem. C 2014, 118, 19462.
[34] A. Belhboub, P. Hermet, L. Alvarez, R. Le Parc, S. Rols, A. C. Lopes Selvati, B. Jousselme, Y. Sato, K. Suenaga, A. Rahmani, J.-L. Bantignies, J. Phys. Chem. C 2016, 120, 28802.
[35] S. T. Skowron, T. W. Chamberlain, J. Biskupek, U. Kaiser, E. Besley, A. N. Khlobystov, Acc. Chem. Res. 2017, 50, 1797.
[36] E. Jelley, 1936, 138, 1009.
[37] F. C. Spano, Annu. Rev. Phys. Chem. 2006, 57, 217. [38] F. C. Spano, C. Silva, Annu. Rev. Phys. Chem. 2014, 65, 477. [39] H. Manzano, I. Esnal, T. Marqués-Matesanz, J. Bañuelos,
I. López-Arbeloa, M. J. Ortiz, L. Cerdán, A. Costela, I. García-Moreno, J. L. Chiara, Adv. Funct. Mater. 2016, 26, 2756.
[40] C. Sun, B. Li, M. Zhao, S. Wang, Z. Lei, L. Lu, H. Zhang, L. Feng, C. Dou, D. Yin, H. Xu, Y. Cheng, F. Zhang, J. Am. Chem. Soc. 2019,
141, 19221.
[41] T. Tanaka, M. Ishitobi, T. Aoyama, S. Matsumoto, Langmuir 2016,
32, 4710.
[42] M. Grabolle, M. Spieles, V. Lesnyak, N. Gaponik, A. Eychmüller, U. Resch-Genger, Anal. Chem. 2009, 81, 6285.
[43] U. Resch-Genger, M. Grabolle, S. Cavaliere-Jaricot, R. Nitschke, T. Nann, Nat. Methods 2008, 5, 763.
[44] Y. Kanemitsu, N. Shimizu, K. Suzuki, Y. Shiraishi, M. Kuroda, Phys.
Rev. B 1996, 54, 2198.
[45] E. Da Como, M. A. Loi, M. Murgia, R. Zamboni, M. Muccini, J. Am.
Chem. Soc. 2006, 128, 4277.
[46] E. Gaufrès, S. Marcet, V. Aymong, N. Y.-W. Tang, A. Favron, F. Thouin, C. Allard, D. Rioux, N. Cottenye, M. Verhaegen, R. Martel,
J. Raman Spectrosc. 2018, 49, 174.
[47] A. Siciliano, R. Gesuele, G. Pagano, M. Guida, J. Biotechnol. Bio
diversity 2015, 1, 1.
[48] M. P. Celis-Salgado, A. Cairns, N. Kim, N. D. Yan, Verh. Int. Ver.
Limnol. 2008, 30, 265.
[49] J. W. Churchman, J. Am. Med. Assoc. 1925, 85, 1849.
[50] K. Welsher, Z. Liu, S. P. Sherlock, J. T. Robinson, Z. Chen, D. Daranciang, H. Dai, Nat. Nanotechnol. 2009, 4, 773.
[51] K. Welsher, S. P. Sherlock, H. Dai, Proc. Natl. Acad. Sci. USA 2011,
108, 8943.
[52] N. Danné, A. G. Godin, Z. Gao, J. A. Varela, L. Groc, B. Lounis, L. Cognet, ACS Photonics 2018, 5, 359.
[53] D. Roxbury, P. V. Jena, R. M. Williams, B. Enyedi, P. Niethammer, S. Marcet, M. Verhaegen, S. Blais-Ouellette, D. A. Heller, Sci. Rep. 2015, 5, 14167.
[54] L. Shi, L. A. Sordillo, A. Rodríguez-Contreras, R. Alfano, J. Biopho
tonics 2016, 9, 38.
[55] A. L. Antaris, H. Chen, K. Cheng, Y. Sun, G. Hong, C. Qu, S. Diao, Z. Deng, X. Hu, B. Zhang, X. Zhang, O. K. Yaghi, Z. R. Alamparambil, X. Hong, Z. Cheng, H. Dai, Nat. Mater. 2016, 15, 235.
[56] M. Waldherr, M. Mišík, F. Ferk, J. Tomc, B. Žegura, M. Filipič, W. Mikulits, S. Mai, O. Haas, W. W. Huber, E. Haslinger, S. Knasmüller, Arch. Toxicol. 2018, 92, 921.
[57] P. Godoy, N. J. Hewitt, U. Albrecht, M. E. Andersen, N. Ansari, S. Bhattacharya, J. G. Bode, J. Bolleyn, C. Borner, J. Böttger, A. Braeuning, R. A. Budinsky, B. Burkhardt, N. R. Cameron, G. Camussi, C.-S. Cho, Y.-J. Choi, J. C. Rowlands, U. Dahmen, G. Damm, O. Dirsch, M. T. Donato, J. Dong, S. Dooley, D. Drasdo, R. Eakins, K. S. Ferreira, V. Fonsato, J. Fraczek, R. Gebhardt, A. Gibson, M. Glanemann, C. E. P. Goldring, M. J. Gómez-Lechón, G. M. M. Groothuis, L. Gustavsson, C. Guyot, D. Hallifax, S. Hammad, A. Hayward, D. Häussinger, C. Hellerbrand, P. Hewitt, S. Hoehme, H.-G. Holzhütter, J. B. Houston, J. Hrach, K. Ito, H. Jaeschke, V. Keitel, J. M. Kelm, B. Kevin Park, C. Kordes, G. A. Kullak-Ublick, E. L. LeCluyse, P. Lu, J. Luebke-Wheeler, A. Lutz, D. J. Maltman, M. Matz-Soja, P. McMullen, I. Merfort, S. Messner, C. Meyer, J. Mwinyi, D. J. Naisbitt, A. K. Nussler, P. Olinga, F. Pampaloni, J. Pi, L. Pluta, S. A. Przyborski, A. Ramachandran, V. Rogiers, C. Rowe, C. Schelcher, K. Schmich, M. Schwarz, B. Singh, E. H. K. Stelzer, B. Stieger, R. Stöber, Y. Sugiyama, C. Tetta, W. E. Thasler, T. Vanhaecke, M. Vinken, T. S. Weiss, A. Widera, C. G. Woods, J. J. Xu, K. M. Yarborough, J. G. Hengstler, Arch. Tox
icol. 2013, 87, 1315.
[58] E. S. Ruthazer, H. T. Cline, RealTime Imaging 2002, 8, 175. [59] M. Lan, S. Zhao, Y. Xie, J. Zhao, L. Guo, G. Niu, Y. Li, H. Sun,
H. Zhang, W. Liu, J. Zhang, P. Wang, W. Zhang, ACS Appl. Mater.
Interfaces 2017, 9, 14590.
[60] A. G. Godin, J. A. Varela, Z. Gao, N. Danné, J. P. Dupuis, B. Lounis, L. Groc, L. Cognet, Nat. Nanotechnol. 2017, 12, 238.
[61] N. Fakhri, F. C. MacKintosh, B. Lounis, L. Cognet, M. Pasquali, Sci
ence 2010, 330, 1804.
[62] J.-Y. Tinevez, N. Perry, J. Schindelin, G. M. Hoopes, G. D. Reynolds, E. Laplantine, S. Y. Bednarek, S. L. Shorte, K. W. Eliceiri, Methods 2017, 115, 80.
[63] S. Velayudham, C. H. Lee, M. Xie, D. Blair, N. Bauman, Y. K. Yap, S. A. Green, H. Liu, ACS Appl. Mater. Interfaces 2010, 2, 104. [64] G. Ciofani, G. G. Genchi, I. Liakos, A. Athanassiou, D. Dinucci,