Does M&A create value in the
pharmaceutical sector?
A case study of the Sanofi-‐Aventis merger
Silvia Cuasante López-‐Barrena
HEC Paris – Majeure Finance
June 2016
Silvia Cuasante López-‐Barrena
May 2016
2
HEC Paris -‐ Majeure Finance Research Project
Does M&A create value in the pharmaceutical sector?
Table of Content
Executive Summary ... 3
Structure of the Research Paper ... 4
Section I: Literature ... 5
1. Overview of the pharmaceutical industry ... 5
1.1. Main players ... 5
1.2. Product categories and pricing method ... 6
1.3. Supply chain description ... 7
2. M&A and value creation ... 8
2.1. In general terms ... 8
2.2. In the pharmaceutical sector ... 13
Section II: Case Study – The Sanofi-‐Aventis Merger ... 16
1. Industry trends at the beginning of the century ... 16
1.1. Size and scope of the industry ... 16
1.2. A changing pharmaceutical framework ... 17
1.3. The French pharmaceutical market ... 19
1.4. Key M&A transactions in the industry ... 19
2. Description of the Sanofi-‐Aventis merger ... 21
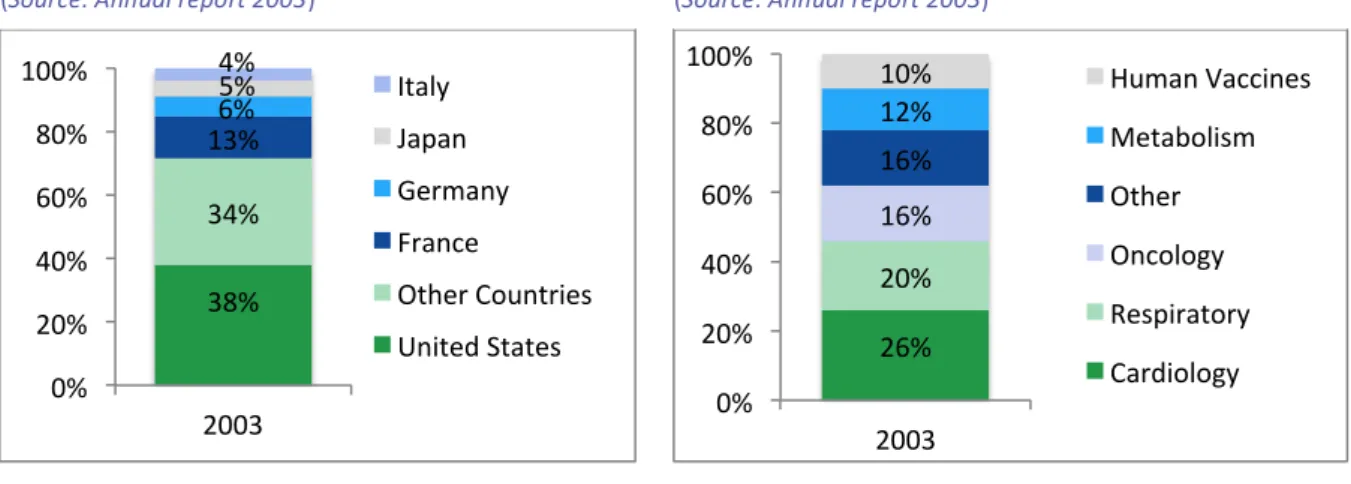
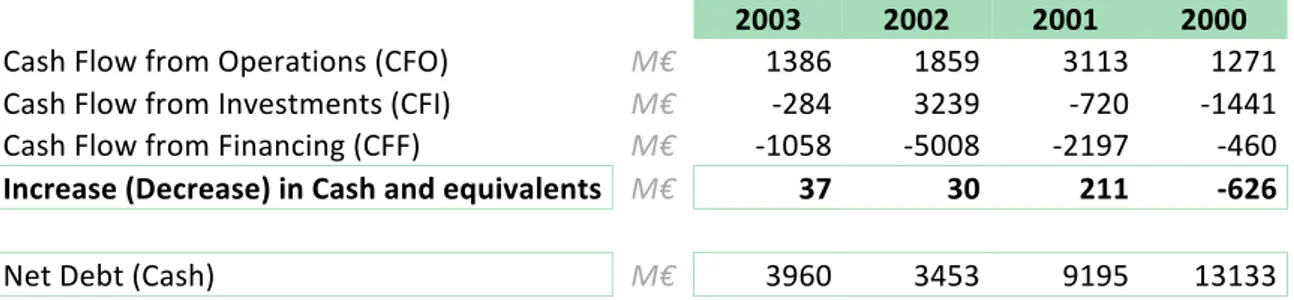
2.1. Analysis of the acquirer – Sanofi-‐Synthélabo ... 21
2.2. Analysis of the target – Aventis ... 24
2.3. Rationale for the merger ... 26
2.4. Merger negotiation process ... 28
2.5. Post-‐merger integration process ... 32
3. Merger’s value creation (destruction) ... 34
3.1. Transaction’s nature: accretion (dilution) analysis ... 34
3.2. Post-‐merger financial analysis ... 35
3.3. Post-‐merger stock market analysis ... 39
3.4. Post-‐merger peers analysis ... 41
3.4.1. Share price evolution ... 42
3.4.2. Multiple comparables ... 44
Section III: Conclusions ... 47
Backup Section ... 50
Bibliography ... 53
Executive Summary
Along decades and until nowadays, companies have been engaging themselves in M&A transactions driven by multiple objectives and needs. Precisely, M&A is seen as a means to achieve economies of scale, reach vertical or horizontal integration, widen the product portfolio, obtain geographic diversification or access new markets and technologies. However, throughout time many have asked themselves if, despite the existence of these M&A drivers, value is created at all from M&A transactions?
Therefore, does M&A create or destroy value? According to previous studies, value-‐creation through M&A depends on several factors such as the deal’s size, acquisition premium, valuation multiples, acquirer’s approach or the financing structure. But a consensus seems to have been reached on the academic side, where academics sustain that M&A delivers value to target shareholders, while it is still ambiguous whether value is created for the acquirer’s shareholders.
Concretely, this research paper focuses on M&A value creation within the pharmaceutical sector. Two unique M&A incentives have been found in the industry: (i) sharing the risk associated to the R&D stage and (ii) acquiring blockbuster drug owners in order to capture the huge revenue potential of these drugs. Taking this into account, one can say that if M&A creates value, value-‐creation is expected to be even more accentuated in the pharmaceutical sector.
Furthermore, in order to test M&A value creation in the pharmaceutical sector, a case study of the Sanofi-‐Aventis merger has been made. The merger took place on April 2004, a time when the pharmaceutical landscape was changing significantly. The main trends of the industry at the time were the increasing importance of generic drugs, consolidation among players and decreasing R&D productivity. Therefore, Sanofi-‐Synthélabo’s approach to merge with Aventis can be considered a defence move so as not to be acquired by others.
A particularity of the deal was the fact that Aventis was much bigger than Sanofi-‐Synthélabo in terms of revenues and headcount. Even so, the deal came forward and has been considered to be successful. Value creation has been measured through four different perspectives: (i) transaction’s accretive or dilutive nature, (ii) financial value creation, (iii) stock market value creation and (iv) relative performance to peers.
Finally, geopolitics has been found to be an important external factor that influenced the deal, namely, the French government’s intervention in the negotiation process managed to build a pharmaceutical national champion, which ultimately benefited French citizens.
Silvia Cuasante López-‐Barrena
May 2016
4
HEC Paris -‐ Majeure Finance Research Project
Does M&A create value in the pharmaceutical sector?
Structure of the Research Paper
The present research paper is structured in 3 sections that aim to tackle the research question:
Does M&A create value in the pharmaceutical sector?
Section I presents a literature review on the topic. Starting with an overview of the pharmaceutical sector (players, products and supply chain), it then focuses on M&A value creation both in general terms and within the pharmaceutical sector.
Section II comprises a case study that illustrates the merger of Sanofi-‐Synthélabo and Aventis, which resulted in the combined entity Sanofi-‐Aventis on 2004. The case study is divided in 3 parts: an introduction to the pharmaceutical industry at the time of the merger, a detailed description of the merger process and the assessment of value creation from the merger. Finally, Section III wraps up the conclusions extracted from the literature review (Section I) and the case study (Section II).
Section I: Literature
1. Overview of the pharmaceutical industry
1.1. Main players
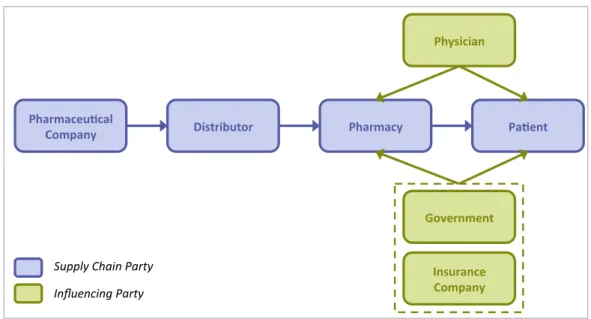
The pharmaceutical sector is characterized by some features that make it unique with respect to other sectors. Two of its distinctive traits are the different players present in the industry and the way they interact (Figure 1).
First there is the pharmaceutical company that takes care of discovering, developing and producing the drugs. For instance, Sanofi-‐Synthélabo and Aventis, the firms whose merger will be studied in the present paper, were both pharmaceutical companies. The drugs produced by pharmaceutical firms are distributed by the distributor to the pharmacy, which hands the product to the end user or so-‐called patient.
Furthermore, there are three additional players that are considered influencing parties and have a strong impact in the dynamics of the industry. In most cases, either the government or an insurance company reimburse the patient (partially or entirely). This depends on whether his or her disease is covered by public healthcare or by a healthcare insurance contracted by the patient himself. The fact that drugs are not entirely paid by the patient implies price inelasticity in the industry.
The third influencing party is the doctor or physician, who is in charge to make the prescription of certain drugs for the patient, given that many drugs cannot be accessed by citizens without a medical prescription. The importance of medical prescriptions is more important in developed countries, where there is a stricter regulatory environment.
Another particular characteristic of the pharmaceutical sector is the strong importance of intellectual property in the form of patents. Pharmaceutical companies tend to spend a significant part of their budget in Research and Development (R&D), which enables them to discover new drugs for the market. Once a new drug is discovered the company can protect its findings with a patent, a fact that creates supply limitation in the sector because one sole
Figure 1 Main players in the pharmaceutical sector (Source: ESADE MBA, BCG)
Pharmaceu)cal+
Company+ Distributor+ Pharmacy+ Pa)ent+
Government+ Insurance+ Company+ Physician+ Supply&Chain&Party& Influencing&Party&
Silvia Cuasante López-‐Barrena
May 2016
6
HEC Paris -‐ Majeure Finance Research Project
Does M&A create value in the pharmaceutical sector?
product cures a certain disease. Hence, the patent owner is in a privileged position in which it gains a very high margin for the particular drug until the patent expires.
Regarding pharmaceutical companies, they can be divided in two categories depending on their size:
-‐ Small players: normally they do not own a patent right, so they have to pay royalties to the patent holder of the particular products they want to produce and sell.
-‐ Major players: these are huge corporations that spend a significant amount in R&D, so they are the ones that hold the patent rights and the biggest market shares globally. Even if these players have a big market share, they bear a lot of risk through R&D expenses, which are considered a sunk cost. That is, this cost does not always pay out, since many discovered drugs do not comply with regulation or simply do not deliver the expected result. Therefore, there is a low rate of success regarding explored drugs and R&D. From the categorisation above, one can see that the industry is also characterized by very high barriers to entry related to the huge R&D expenses and patent holding in the industry (Sol & Kirchner, 2011).
1.2. Product categories and pricing method
Pharmaceutical products represent an important portion of healthcare expenditures, a percentage that varies depending on the country and region. According to the Office of Health and Consumer Goods, the pharmaceutical industry presents the following product categories:
-‐ Originator chemically-‐synthesized drugs: products developed by a pharmaceutical company after extensive R&D efforts and clinical trials with both animals and humans. Once the drug is approved by national or regional regulators, the originator company protects the drug with intellectual property rights (patents). 2010 US data show that only 0,1% of the drugs entering a preclinical test make it to clinical trials with humans, only 20% of the drugs in human clinical trials are approved and only 20% of marketed drugs cover for the R&D expenses related to its discovery.
-‐ Generic drugs: are duplicative copies of the aforementioned drugs, namely, they have the same active ingredient and present the same dosage form, power and administration route. They become legal once the patent of the originator chemically-‐ synthesized drugs expires.
-‐ Over-‐The-‐Counter (OTC) drugs: patients do not require a physician’s prescription in order to buy these kinds of products in the pharmacy. These medicines are considered safe for the patient, since it is the patient himself or herself the one who makes the diagnosis and medicates himself.
-‐ Pharmaceutical substances (APIs and excipients): Active Pharmaceutical Ingredients (APIs) are the ingredients of the drug that make it effective (e.g. paracetamol), while excipients are the substances that give the drug its form (e.g. liquid or tablet).
-‐ Biologicals or biopharmaceuticals: these drugs are derived from plant, animal, microorganism or human materials, which are living materials. Many vaccines are developed as biological drugs and are administered (injected) by doctors in their offices. -‐ Biosimilars or follow-‐on biologics: are developed versions of biological products that
have to be approved by regulatory institutions.
Finally, as for the pricing method, it also works very differently than in other industries. On the one hand, pharmaceutical companies need to cover elevated R&D expenses, but on the other
hand, the offered product is related to the population’s health and must be accessible. Hence, there are numerous price regulations that cap drugs prices, while the less regulated drugs present prices much higher than their production cost. In addition, government subsidies in some countries are an additional tool to make essential medicine accessible to the public.
1.3. Supply chain description
The supply chain of a pharmaceutical drug production is done in three steps (Figure 2). As a reminder, the drug is produced by the pharmaceutical company and handed to the distributor, who is in charge to distribute it to the pharmacies.
Supply chain process:
1. Research and Development (R&D): According to the Office of Health and Consumer Good, pharmaceutical companies spend around 20% of their revenues in R&D. This part of the supply chain is done both by the pharmaceutical firm itself as well as through strategic alliances with university laboratories. The fact that R&D expenses are so high implies high barriers to entry in the sector, but brings additional risk for the incumbents as well. Indeed, from the billions spent in R&D only a small percent of the tested drugs become marketable.
2. Manufacturing and Production: Once a drug is approved to be launched to the market comes the stage of manufacturing and production. Here, quality control is of outmost importance, since what is at stake is an essential matter: the patient’s health. Precisely because of this need of free-‐of-‐error drug manufacturing, the industry presents little outsourcing opportunities. Indeed, trusting the production to a third party with such strict quality control patterns comes across as very risky.
3. Marketing and Selling: the final step is the one related to being able to launch successfully the discovered and produced drug. As it has been mentioned in subsection I.1.1., the doctor or physician plays a key role in the pharmaceutical industry, due to the fact that it is him or her who prescribes most of the drugs to the patient. Pharmaceutical companies must take this into account in order to approach physicians in the right manner and gain their confidence with the drug they are trying to sell.
As for the OTC drugs, the marketing campaign works similarly as in other sectors: advertising and promotions that aim to reach and capture the end user (patient). Both for prescription and OTC drugs it is the pharmacy that acts as retailer or wholesaler. Thus, in the case of OTC drugs, sales agents in the pharmacies are essential given that they are the ones that need to transmit the pros and cons of each drug to the patient. It is important to mention that the time lapse between the drug’s discovery and its presence in
the market, known as time to market, is known to be more than 10 years.
Figure 2 Supply chain of the pharmaceutical sector
Manufacturing++ and+ Produc/on+ Research++ and++ Development+ Marke/ng+ and++ Selling+
Silvia Cuasante López-‐Barrena
May 2016
8
HEC Paris -‐ Majeure Finance Research Project
Does M&A create value in the pharmaceutical sector?
2. M&A and value creation
2.1. In general terms
Across industries, companies use mergers and acquisitions (M&A) as a common tool to expand faster than they would do organically. Indeed, M&A enhances: achieving economies of scale, reaching vertical or horizontal integration, widening the product portfolio, obtaining geographic diversification and accessing new markets and technologies (Ceddaha, 2015; Mourdoukoutas, 2011).
Even if these are reasonable drivers for a company to engage in M&A, one must ultimately question if shareholder value is being created or destroyed from a particular M&A transaction. The purpose of the present report is to analyse value creation (destruction) in M&A transactions, an analysis that will be taken into the scope of the pharmaceutical industry in the following subsections.
Long-‐term returns in M&A
A consulting report carried out by McKinsey&Company in 2012 analysed more than 15.000 deals carried out by the world’s top 1.000 non-‐banking firms. The study revealed that long-‐ term results fluctuate considerably depending on the company’s industry and the transaction’s pattern (Werner, Uhlaner, & West, 2012). For this reason, they defined 5 company profiles depending on the frequency and size of the deals undertaken (Figure 4).
After exploring the outcome for each company profile, the report presents results that vary significantly from one profile to another:
1. Large Deals: Companies within mature and slow-‐growing sectors are the ones that seem to be the most successful ones in large deals. The highlighted reasons are: performance improvement, reduction of excess capacity and the fact that a lengthy post-‐merger integration is not as disruptive. In contrast, companies that enter large deals in fast-‐growing sectors tend to underperform, since they do not have time to properly focus on the post-‐merger integration and product upgrades at the same time. 2. Programmatic deals: The study found a so-‐called volume effect indicating that the more transactions a firm completed, the greater the probability to earn long-‐term returns. Moreover, evidence showed that the success of the volume effect does not depend on the type of sector the company is in, but on its particular corporate skills. 3. Tactical Deals: This type of profile is not as influenced by the combined effect of all the
undertaken deals, but the deals are still an essential part of the company’s strategy. This strategy is followed mostly by industrial and tech companies (e.g. Microsoft), since it permits to fill channel and product gaps that ultimately enhance long-‐term returns.
4. Selective Deals: This profile applies for companies that follow an organic growth strategy with timely inorganic actions. Hence, long-‐term returns have very low correlation with M&A strategy.
5. No deals (organic): Purely organic growth strategy presents risks and takes time to deliver results, a fact that makes it very difficult for a company to survive within consolidated industries (bcg.perspectives.com, 2007). Therefore, a growth strategy
Large&deals& Transformed+company+through+at+least+1+individual+deal+priced+at+ above+30%+of+market+capitaliza=on+ Selec,ve& Small+number+of+deals+but+ possibly+significant+market+ capitaliza=on+acquired+ Organic& Almost+no+M&A+ Programma,c& Many+deals+and+high+ percentage+of+market+ capitaliza=on+acquire+ Tac,cal& Many+deals+but+low+market+ capitaliza=on+acquired+ 66+ 112+ 142+ 139+ 180+ #+ Number+of+companies+in+a+given+category+ Global&1.000&nonbanking&companies,&199952010&(639&ins:tu:ons&for&which& data&are&available&through&2010)&& Number&of&deals&per&year& Market& capitaliza,on& acquired& Low+ Low+ High+ High+ Figure 4 Company profiles by deal frequency and transaction size (Source: McKinsey&Company analysis)
Silvia Cuasante López-‐Barrena
May 2016
10
HEC Paris -‐ Majeure Finance Research Project
Does M&A create value in the pharmaceutical sector?
based on small deals can actually bring less risk to the company than trying to avoid M&A by growing only organically (Werner et al., 2012).
From the above, the McKinsey&Company report concludes that the success of large deals depends on more than one factor (firm’s leadership, corporate capabilities and sector’s structure), while the right corporate skills can make a company succeed through a pattern of small deals. In addition, the report suggests that the larger a company becomes, the more it relies on M&A to grow.
In any case, it is of outmost importance to bear in mind that statistical studies base their results on headline averages, which can be inaccurate and misleading (bcg.perspectives.com, 2007). Hence, while it is true that patterns emerge from available data, one must be aware that results vary significantly from case to case. Therefore, averages can be taken as a reference, but cannot answer the question of whether a specific company must engage in an M&A transaction in a particular sector and timeframe (Werner et al., 2012).
The M&A market: M&A waves and market breakdown
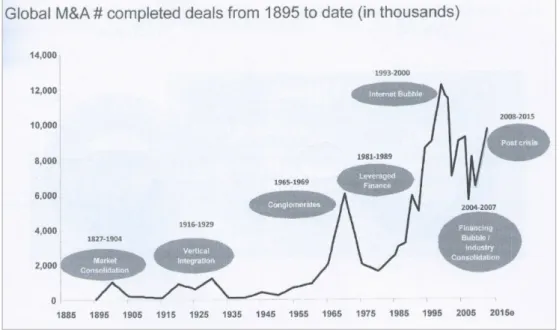
Regarding the timeframe, it shall be remarked that the M&A market is a cyclical one. That is, M&A transactions tend to occur in what is known as M&A waves: during a certain period there is a boom of M&A transactions, which is then followed by a period of stability and lack of transactions (Ceddaha, 2015).
Figure 5 shows the seven M&A waves that have taken place from 1895 until 2015, a behaviour that goes in line with the results found in a report by The Boston Consulting Group (BCG): M&A value creation or destruction varies widely depending on the time the deal takes place (bcg.perspectives.com, 2007). BCG’s report analysed M&A transactions within ten sectors and demonstrated that both the timeframe taken for the analysis and the sector influenced the results obtained:
-‐ 1992-‐2006 timeframe: they found that one three sectors created value, this being relatively small.
-‐ 2004-‐2006 timeframe: they found that four sectors created substantial value. Figure 5 shows that precisely, from 2004 until 2007, there was an M&A wave related to the
Financing Bubble/Industry Consolidation.
Finally, it is known that M&A strategy is more present in some regions than in others, thus, before entering in a transaction, a company must not only take into account the sector and timing, but also the geographical region (Ceddaha, 2015). Concretely, Europe and North America are the regions that close more M&A deals, followed by Asia (Figure 6).
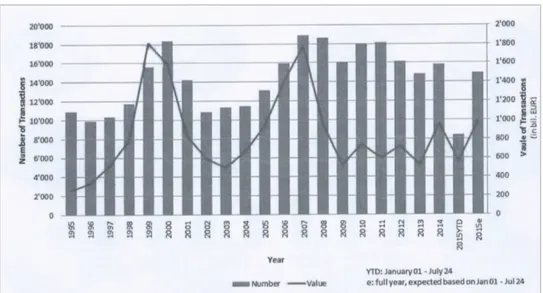
A detailed evolution of the M&A market in the Eurozone for the last two decades is provided in Figure 7, where certain cyclicality can be observed.
Influence of the deal’s characteristics
Even if each deal is unique, multiple studies have been done in order to find common patterns in those that were successful. Results seem to converge in the idea that certain deal characteristics make it more likely for an M&A transaction to succeed.
In the first place there is the acquisition premium, which often impacts the acquirer’s decision to buy a target company. The common belief is that the higher the acquisition premium, the
Figure 6 Worldwide M&A market breakdown (Sources: Statista, William
Blair and Majeure Finance Course in M&A)
Figure 7 Value and volume of M&A transactions in Eurozone (1995-‐2015e) (Sources: Thompson
Silvia Cuasante López-‐Barrena
May 2016
12
HEC Paris -‐ Majeure Finance Research Project
Does M&A create value in the pharmaceutical sector?
more difficult it is to create value from a certain M&A deal. This belief is based on the fact that the sole financial rationale to justify the premium paid is the synergies from which the acquirer expects to create value. However, a consulting report from The Boston Consulting Group (BCG) demonstrated that this is not necessarily the case, namely, a high acquisition premium does not imply value destruction (bcg.perspectives.com, 2007).
In this sense, BCG’s report sustains that during periods of intense activity, paying a higher acquisition premium seems to be significantly valuable. The explanation they find for this is that in periods of strong competition among sector players, acquirer companies are forced to concentrate on the strategic fit and fundamentals of the target firm. This exclusive focus on the target’s performance leaves on the background the negotiation of the acquisition premium, which might end up being higher than expected. Therefore, BCG supports that it is the combination of the target’s improved fundamentals and a successful post-‐merger integration what boosts value creation. In the end, paying a higher premium means sharing the upside potential with the target company.
Further on, both the mentioned report and a follow-‐on study also carried out by BCG (bcg.perspectives.com, 2007; Gell, Kengelbach, & Roos, 2008) demonstrated that another important factor to take into account is the level of valuation multiples. Both analysis demonstrated that value-‐creating transactions tend to be those that present low valuation multiples. The conclusion that can be extracted is that paying a high acquisition premium is not detrimental as long as the valuation multiples are low. Thus, there is evidence to believe that companies that are able to engage in M&A activity during a downturn will be more likely to create value (Gell et al., 2008).
Second, there is the acquirer’s approach that can be either friendly or hostile. Data from previous studies suggest that there is being a shift of mentality by investors from friendly bids towards hostile ones. The reason they find for this is the fact that the deals that have taken place in the past decade have been mostly consolidation ones, where the main goal is to achieve cost synergies. In this sense, cost synergies do not require as much harmonization as revenue synergies, in which both companies must be perfectly synchronised (bcg.perspectives.com, 2007).
Finally, there is the financing structure of the deal, which can be in cash, equity or mixed. Several studies reveal that the payment method that yields the best outcome is paying in cash (bcg.perspectives.com, 2007; Ferri & Petitt, 2013; Gell et al., 2008).
Previous academic research papers
Besides financial, banking and consulting reports it is also important to consider the conclusions of previous academic research papers. It appears to be that academics’ answer to M&A value creation converges: while value is delivered to target shareholders, shareholder value creation for the acquirer firm is ambiguous.
Four relevant citations are provided below that are supported by the vision of many other researchers that have reached similar conclusions such as Datta et al. (1992), Hassan et al. (2007) and Gell et al. (2008).
“Recent empirical research on mergers has consistently documented that bidding firms pay
large premiums for target firms. At the same time most of the broad-‐based, risk-‐adjusted studies on mergers show that the stockholders of bidding firms either gain a small statistically insignificant amount or, (…), lose a small significant amount from the announcement of a merger bid.”(Asquith, Bruner, & Mullins, 1983)
“Extensive research has shown that shareholders in target firms gain significantly and that
wealth is created at the announcement of takeovers (i.e. combined bidder and target returns are positive). However, we know much less about the effects of takeovers on the shareholders of acquiring firms. Evidence suggests that, these shareholders earn about an average zero abnormal return at the announcement of acquisitions, though there is tremendous variation in returns.” (Fuller, Netter, & Stegemoller, 2001)
“The mass of research suggests that target shareholders earn sizable positive market-‐returns,
that bidders (with interesting exceptions) earn zero adjusted returns, and that bidders and targets combined earn positive adjusted returns. On balance, one should conclude that M&A does pay. But the broad dispersion of findings around zero return to buyers suggests that executives should approach this activity with caution.”(Bruner, 2003)
“An abundance of studies show that the share price of almost all targets increases around the
announcement of a merger or an acquisition. However, the share price of acquirers rarely follows the same trend. (…) equity markets are sceptical about the ability of acquirers to create shareholder value.” (Ferri & Petitt, 2013)
2.2. In the pharmaceutical sector
As mentioned in the previous subsection, the focus of this research paper revolves around the research question: Does M&A create value in the pharmaceutical sector? The interest in the pharmaceutical sector resides in the fact that it is a global industry that relies extensively on M&A activity (Hassan, Patro, Tuckman, & Wang, 2007). For this reason, findings related to this topic have wide applicability. Thus, in the present subsection previous studies as well as academic literature about M&A and the pharmaceutical sector will be reviewed.
M&A drivers in the pharmaceutical sector
Over the past decades, the pharmaceutical sector has experienced an extensive concentration: in 1985 the top-‐10 companies accounted for 20% global revenues, while in 2002 the top-‐10 companies accounted for 48% global revenues. The major part of this consolidation trend resulted form mergers: in the 1988-‐2000 timeframe the value of M&A activity surpassed 500 bUSD (Danzon & Epstein, 2004).
The pharmaceutical sector has a distinctive trait that makes it different from any other sector: R&D expenditure. That is, the sector accounts for significant R&D expenses related to the cost of delivering a new drug to the market (Hassan et al., 2007). Related to this, there seems to be consensus among researchers, who think that the mergers that have led to consolidation have to do with economies of scale in R&D expenditures (Danzon & Epstein, 2004). Indeed, R&D expenditure is regarded as an additional risk for the sector’s players, since it is known that the rate of success of explored drugs is low. Therefore, this feature represents an additional incentive for firms in the sector to engage in M&A activity in order to share the risk associated with early stage research.
In addition, previous research has also revealed that the pharmaceutical firms have an M&A driver that is not present in other sectors: acquisition of companies that own blockbuster
drugs, which are those drugs that are expected to provide huge revenues and are initially
protected by a patent. An example would be the acquisition of Lipitor, a drug to control cholesterol, by Pfizer that produced 12 bUSD sales in 2005. Taking into account the potential for highly positive returns from these blockbuster acquisitions, it makes sense to believe that if M&A creates value, value-‐creation should be even more accentuated in the pharmaceutical sector (Hassan et al., 2007).
Silvia Cuasante López-‐Barrena
May 2016
14
HEC Paris -‐ Majeure Finance Research Project
Does M&A create value in the pharmaceutical sector?
One of the McKinsey&Company reports mentioned in the previous subsection (Werner et al., 2012) found evidence supporting the view of value-‐creation being more accentuated in the pharmaceutical industry. As a reminder, the report analysed the long-‐term returns to M&A for five company profiles. Concretely, they studied 1.000 nonbanking companies that belonged to eight different sectors: consumer discretionary, telecom, pharmaceutical, high-‐tech, consumer goods, materials, manufacturing and insurance.
While most sectors presented negative or null long-‐term returns for the different company profiles, the pharmaceutical industry presented positive long-‐term results for three out of the five company profiles and overperfomed the average of the other sectors. The study stands out that many large pharmaceutical companies engage in small M&A transactions with companies that not yet have global footprint. In this way, the large pharmaceutical companies are able to capture growth opportunities. For instance, in the late 90’s, the German BASF decided to focus on chemicals, which was its area of expertise, so they opted to grow fast through the programmatic acquisition of specialised chemical companies (Werner et al., 2012). Megamergers within the pharmaceutical sector
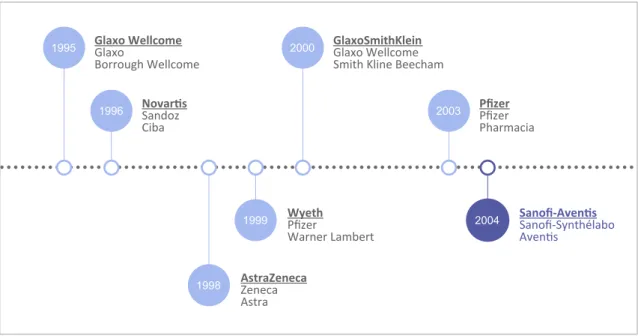
It is known that megamergers1 have shaped the global pharmaceutical sector in the past decades: the majority of the worldwide top-‐20 pharmaceutical firms took part in a megamerger from 1995 to 2005 (Myoung & Lorriman, 2014).
McKinsey&Company studied 17 large deals that took place within the 1995-‐2011 timeframe and reached the conclusion that megamergers have been essential for acquirers’ survival in a consolidating industry. In addition, they concluded that pharmaceutical large deals and megamergers have created significant shareholder return compared to that of other industries (Myoung & Lorriman, 2014; Werner et al., 2012). Findings showed that, indeed, acquired companies significantly contributed to total and new revenues, as well as improved EBITDA margins and returns in a 2-‐year time horizon (Myoung & Lorriman, 2014).
Related to the described above M&A drivers for the pharmaceutical industry, McKinsey analysts divided the M&A transactions in two types: (i) consolidation transactions, understood as megamergers; (ii) growth-‐oriented transactions, understood as blockbuster deals. They found that consolidation transactions have generated more economic profit2 than growth-‐ oriented transactions. The former being more common in the late 90’s due to the meaningful revenue and cost synergies they provided and the latter being more typical recently even if they are more expensive and allow less synergies.
However, results seem to be opposite if one takes into account valuation multiples instead of economic profit. That is, growth-‐oriented transactions had a significant positive impact on valuation multiples while consolidation transactions did not. The explanation provided for this behaviour is that growth-‐oriented transactions enhance investors’ long-‐term growth expectations for the firm, while consolidation transactions create uncertainty and do not necessarily imply growth expectations. In any case, the report gives evidence that shareholder value has been created in both types of M&A transactions (Myoung & Lorriman, 2014).
Finally, it is important to remark that event studies base their conclusions on averages that are a good proxy to understand the global pharmaceutical landscape, but cannot predict how a specific M&A transaction will turn out. In fact, this will depend on several factors, such as the timing, the deal’s characteristics, the company’s financial position or the company’s leadership, among many others (bcg.perspectives.com, 2007; Werner et al., 2012).
1 M&A transaction larger than 10b$, in which the target company accounts for at least 10% of the acquirer’s
revenues and 20% of its market capitalization.
Previous academic research papers
Regarding previous academic research papers on M&A value creation (destruction) within the pharmaceutical sector, limited studies have been made (Hassan et al., 2007). However, two event studies have been considered relevant literature for this research paper:
-‐ Mergers and acquisitions in the pharmaceutical and biotech Industries – The Wharton School: this academic paper sustain that large companies in the pharmaceutical sector merge to prevent patent expiration dates and to fill production gaps, while small players with lack of sales force tend to align with larger players as an exit strategy (Danzon, Epstein, & Nicholson, 2003).
-‐ The outsourcing of R&D through acquisitions in the pharmaceutical industry – Journal of Financial Economics: this event study examines the outcome of 160 acquisitions inside the pharmaceutical sector in the period 1994-‐2001. Their findings sustain that acquirers generate significant positive returns, which they relate to previous access of the acquirer to R&D information and an acquirer’s privileged negotiation position in the deal. They, thus, conclude that R&D can be successfully outsourced through acquisitions (Higgins & Rodriguez, 2006).
Silvia Cuasante López-‐Barrena
May 2016
16
HEC Paris -‐ Majeure Finance Research Project
Does M&A create value in the pharmaceutical sector?
Section II: Case Study – The Sanofi-‐Aventis Merger
1. Industry trends at the beginning of the century
1.1. Size and scope of the industry
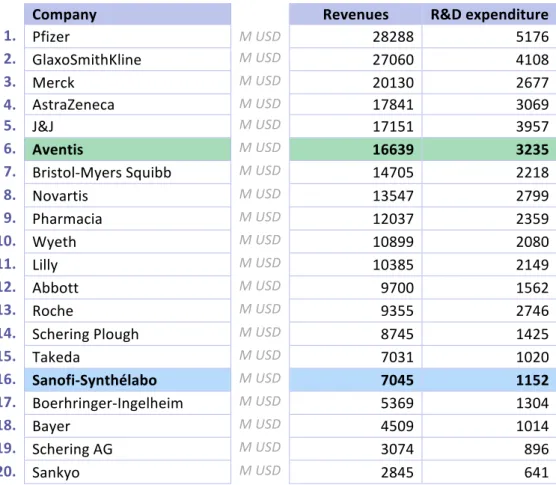
In the months prior to the merger between Sanofi-‐Synthélabo and Aventis, in year-‐end 2003, the main players within the global pharmaceutical industry were the ones seen in Table 1.
Remarkably, Aventis and Sanofi-‐Synthélabo were the 6th and 16th players of the industry, respectively. This is of paramount importance for the present case study, since it suggests that the analysed merger was indeed one of the so-‐called pharmaceutical megamergers (see section I.2.2.) that contributed to the further consolidation of the sector.
Concerning the pharmaceutical sector’s size, overall revenues accounted for roughly 500 bUSD in year-‐end 2003. In addition, the sector experienced significant revenue growth since year 2000. Concretely, between 2000 and 2005 the sector’s growth trend changed meaningfully: from being mainly concentrated in Europe and United States to a more heterogeneous growth shared with Japan and the rest of the world (Statista, 2005). These figures imply that the pharmaceutical industry’s landscape was moving towards internationalization and, in turn, experiencing important shifts.
Company Revenues R&D expenditure
1. Pfizer M USD 28288 5176 2. GlaxoSmithKline M USD 27060 4108 3. Merck M USD 20130 2677 4. AstraZeneca M USD 17841 3069 5. J&J M USD 17151 3957 6. Aventis M USD 16639 3235
7. Bristol-‐Myers Squibb M USD 14705 2218
8. Novartis M USD 13547 2799 9. Pharmacia M USD 12037 2359 10. Wyeth M USD 10899 2080 11. Lilly M USD 10385 2149 12. Abbott M USD 9700 1562 13. Roche M USD 9355 2746
14. Schering Plough M USD 8745 1425
15. Takeda M USD 7031 1020
16. Sanofi-‐Synthélabo M USD 7045 1152
17. Boerhringer-‐Ingelheim M USD 5369 1304
18. Bayer M USD 4509 1014
19. Schering AG M USD 3074 896
20. Sankyo M USD 2845 641
1.2. A changing pharmaceutical framework
As it has been mentioned in the previous subsection, the pharmaceutical sector’s landscape was experiencing important changes at the moment of the merger between Sanofi-‐Synthélabo and Aventis. As expected, these changes had a strong influence on the merger, thus, it is relevant to consider the trends of the industry at that moment:
-‐ Generic drugs leading to price war: When a patent expires, other pharmaceutical companies can offer the same drug (chemical ingredient) at a much lower price and with seldom marketing efforts given that the drug is already well-‐known in the market (Gilbert, Henske, & Singh, 2003). In the past, physicians used to prescribe a drug by the brand of the former patent holder, a habit that undermined generic drugs. However, this tendency changed in the 21st century when doctors became more cost-‐conscious about healthcare and started prescribing the active ingredient instead of the brand (Scherer, Culyer, & Newhouse, 2000). Therefore, the increasing importance of such generic drugs triggered a war price that is still on-‐going nowadays.
-‐ Increasing R&D expenses: It is known that a huge part of existing patents were developed during the 1960’s, meaning that in the early 2000’s many of these were about to expire. Patent expiration accelerated the emergence of generic drugs, which increased competition in the market. Consequently, pharmaceutical companies were more pressured to find blockbuster drugs to keep their market share and revenues. So the heightened competition and aforementioned war price gave place to increasing R&D expenditure by pharmaceutical companies.
A common tool to measure R&D productivity is the number of new drugs for each dollar
invested in R&D. As it can be observed in Figure 9, nowadays a much higher R&D
investment is needed to discover a new drug. This can be explained by the fact that the essential drugs have already been developed, so more sophisticated drugs need more extensive R&D efforts to be discovered.
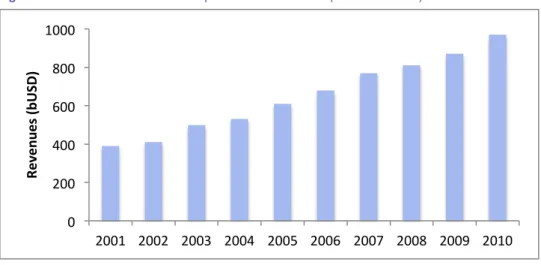
Figure 8 Worldwide revenues for the pharmaceutical sector (Source: Statista)
0 200 400 600 800 1000 2001 2002 2003 2004 2005 2006 2007 2008 2009 2010 Re ve nu es (b U SD )
Silvia Cuasante López-‐Barrena
May 2016
18
HEC Paris -‐ Majeure Finance Research Project
Does M&A create value in the pharmaceutical sector?
-‐ Stricter regulatory framework: The trend of consolidation among companies of the sector and the progressive maturing of the industry called for an improvement in the regulatory environment. Hence, stricter regulation was put in place in the 21st century, mostly in all issues that were related with patent protection and drug safety. The OCDE divided the regulatory efforts in 3 main issues: (i) ensure consumers’ safety; (ii) incentive preservation so as to enhance innovation and (iii) drug quality control.
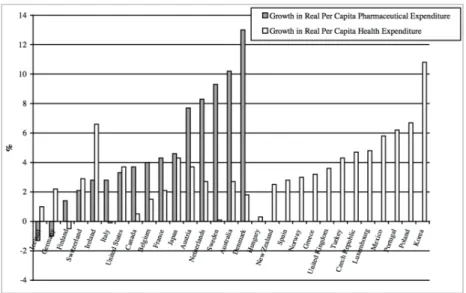
-‐ Aging population: Growth projections for the pharmaceutical sector were very optimistic taking into account an increasingly elderly population in the developed world. Indeed, this demographical situation boosted the pharmaceutical expenditure per capita in developed countries (Figure 10).
-‐ Growing demand driven by emerging markets: emerging countries had more budget to spend in the pharmaceutical industry. The most relevant examples are China, Russia, Turkey and Brazil (KPMG, 2011).
17
Additionally, another key trend was the increase in R&D costs at the same time of an important reduction of the margins of the big pharma corporates, trend that was at the same time driven by the increased number of competitors and the growing scale of those. Because of the timing, a lot of patents were expiring given that patents usually last between 20-30 years and the gross set of patents were developed after the 60´s which also affected at the R&D costs. In order to analyse patent productivity, a good metric is to compare the number of drugs per $ invested in R&D. As it can be seen in EXHIBIT 2, the productivity is following a clear downward trend. One of the main reasons behind this trend is that it can be considered that the most “accessible” drugs have already been discovered, and therefore the new drugs need an important investment in order to get further knowledge.
EXHIBIT 2: Productivity of R&D
Source: Upadhyay, 2015
Figure 9 R&D productivity measured as number of new drugs for each dollar invested in R&D
(Source: Upadhyay, 2015)
Figure 10 Growth in pharmaceutical expenditure per capital in developed countries
from 1990-‐1997 (Source: Biggar)
19
This growing demand was also due surge of emerging markets economies with increased budgets for healthcare expenditure. As it is displayed in EXHIBIT 4, it can be seen that emerging countries such as China and Russia’s pharma markets grew significantly from the 2003 to the 2008 period. Therefore, in the year 2008 we can find in the TOP 15 pharmaceutical markets China, Brazil, Russia, Mexico, India and Turkey.
EXHIBIT 3: Growth in the period 1990-1997