O R I G I N A L R E S E A R C H A R T I C L E
Dual
‐tracer PET/CT scan after injection of combined [
18
F]NaF
and [
18
F]FDG outperforms MRI in the detection of myeloma
lesions
Nadia Withofs
1|
Yves Beguin
2,3|
François Cousin
1|
Tino Tancredi
1|
Paolo Simoni
4|
Victoria Alvarez
‐Miezentseva
4|
Bernard De Prijck
2|
Kaoutar Hafraoui
2|
Christophe Bonnet
2|
Frédéric Baron
2,3|
Roland Hustinx
1|
Jo Caers
2,31
Division of Nuclear Medicine and Oncological Imaging, Medical Physics Department, CHU of Liège, Liège, Belgium
2
Department of Clinical Hematology, CHU of Liège, Liège, Belgium
3
Laboratory of Hematology, GIGA‐I3
, University of Liège, Liège, Belgium
4
Division of Diagnostic Imaging, Medical Physics Department, CHU of Liège, Liège, Belgium
Correspondence
Dr Jo Caers, MD, PhD, Department of Clinical Hematology, Centre Hospitalier Universitaire de Liège, Dom Univ Sart Tilman B 35, B‐4000 Liège, Belgium.
Email: jo.caers@chu.ulg.ac.be
Funding information
Fonds De La Recherche Scientifique; Fonds d'Investissement de Recherche Scientifique; Fonds Spéciaux de la Recherche; Foundation Against Cancer
Abstract
The detection rates of whole
‐body combined [
18F]NaF/[
18F]FDG positron emission
tomography combined with computed tomography (PET/CT), CT alone, whole
‐body
magnetic resonance imaging (WB
‐MRI), and X‐ray were prospectively studied in
patients with treatment
‐requiring plasma cell disorders The detection rates of
imag-ing techniques were compared, and focal lesions were classified accordimag-ing to their
anatomic location. Twenty
‐six out of 30 initially included patients were assessable.
The number of focal lesions detected in newly diagnosed patients (n = 13) and in
relapsed patients (n = 13) were 296 and 234, respectively. The detection rate of
PET/CT was significantly higher than those of WB
‐MRI (P < 0.05) and CT
(P < 0.0001) both in patients with newly diagnosed and in those with relapsed
mul-tiple myeloma (MM). The X
‐ray detection rate was significantly lower than those of
all other techniques, while CT detected more lesions compared with WB
‐MRI at
diagnosis (P = 0.025). With regard to the infiltration patters, relapsed patients
pre-sented more diffuse patterns, and more focal lesions located in the limbs compared
with newly diagnosed patients. In conclusion, the detection rate of [
18F]NaF/[
18F]
FDG PET/CT was significantly higher than those of CT, MRI, and X
‐ray, while the
detection rate of X
‐rays was significantly lower than those of all other imaging
tech-niques except for focal lesions located in the skull.
K E Y W O R D S
FDG‐PET, myeloma, imaging, PET/CT fluoride
1
|I N T R O D U C T I O N
The revised International Myeloma Working Group (IMWG) criteria for the diagnosis of multiple myeloma (MM) incorporated computed tomography (CT), [18F]fluorodeoxyglucose ([18F]FDG) positron
emission tomography combined with CT (PET/CT), and magnetic
resonance imaging (MRI) in the diagnostic work‐up of MM and its associated bone disease.1-3By using X‐ray (XR) or CT, the detection of MM lesions is indirect and relies on the recognition of tumor‐ induced bone destruction. Nevertheless, because of its higher detec-tion rate, whole‐body CT (WBCT) is increasingly replacing whole‐body XR (WBXR) in the diagnostic work‐up of MM.2,4,5MRI and [18F]FDG PET/CT directly detect tumor invasion and MM focal lesions (FLs) with similar performance.6-8 Furthermore, baseline MRI and [18F]
Nadia Withofs, Yves Beguin, Roland Hustinx and Jo Caers equally contributed to the study.
DOI: 10.1002/hon.2600
FDG PET/CT provide prognostic information in patients with newly diagnosed MM: The presence of a diffuse pattern with MRI, extramedullary disease, the number of FLs, and/or [18F]FDG‐avid lesions are associated with shorter survival.8-15 Based on its ability
to indicate metabolic activity, [18F]FDG is the preferred and widely used tracer for PET/CT1; however, the sensitivity of [18F]FDG
PET/CT is about 80% to detect focal myeloma lesions.16
[18F]NaF targeting bone has been also investigated for the
detec-tion of MM bone lesions. The bone uptake of [18F]NaF reflects bone
formation and also depends on regional blood flow.16 The injection
of [18F]NaF in MM patients results in a tracer uptake at the margins of osteolytic lesions.17Although the initial results in MM were
prom-ising,18studies comparing [18F]NaF PET/CT with [18F]FDG PET/CT all showed inferior results for the detection and follow‐up of MM lesions. At diagnosis, only 39% to 45% of the MM lesions were distinguished by [18F]NaF PET/CT19-21that also identified numerous degenerative
bone lesions.
The rationale behind our combined strategy was that, in solid can-cers including prostate and breast cancan-cers, the combined injection of both [18F]NaF and [18F]FDG allowed PET/CT to be more effective
than MRI and bone scintigraphy in assessing bone disease extent.22 This difference was mainly seen in patients with prostate cancer, where combinatorial PET/CT had a higher sensitivity compared with the other imaging techniques, while in breast cancer, the sensitivities of whole‐body MRI (WBMRI) and PET/CT were equivalent. [18F]
FDG and [18F]NaF target different molecular processes: [18F]NaF
tar-gets bone remodeling and has only a limited sensitivity, while [18F] FDG assesses myeloma lesions activity and identifies a majority, but not all myeloma lesions.1 Therefore, the combination of [18F]NaF and [18F]FDG, which was never tested in MM, might increase the
sen-sitivity of PET/CT to detect myeloma bone lesions. Therefore, we aimed to compare the detection rate of PET/CT performed after the injection of both [18F]NaF and [18F]FDG with those of MRI, CT, and XR in patients with MM.
2
|M A T E R I A L S A N D M E T H O D S
2.1
|Patients
This prospective monocentric study was conducted from September 2011 until 2014. Patients with a treatment‐requiring plasma cell disor-der (solitary plasmacytoma, MM) were prospectively included.2 Relapsing patients were included if the last treatment was stopped more than 3 months before the inclusion. The protocol (EudraCT 2013‐004807‐38) was approved by the Ethics Committee of the Uni-versity Hospital of Liege and enrolled patients signed a specific informed consent form.
2.2
|Data acquisition and analysis
The imaging procedures are described in the Supporting Information. PET and CT images were reviewed by two experienced nuclear med-icine physicians and one radiologist to detect FLs and/or diffuse bone marrow involvement. The greatest diameter of every osteolytic FL detected on CT images was measured, and the relationship between the detection rate of PET FLs and the size of osteolytic lesions was investigated. The MR, CT, and XR images were analyzed by four radi-ologists blinded to each other and to PET/CT results. The diameter of every FL was recorded.
2.3
|Definitions
In the current study, an FL is defined as a lesion observed on one of the imaging techniques (cf Table 1). A PET‐positive lesion was defined as an area of focally increased tracer uptake within bones (compared with normal bone marrow background uptake). A diffuse pattern on PET/CT was defined based on the diffuse bone osteolysis seen in CT images only. A mixed focal/diffuse pattern
TABLE 1 Definitions of bone involvement
Imaging Technique Bone Involvement Definitionsa
PET/CT Focal lesion: Focal area of visually detectable increased tracer uptake, with or without underlying bone destruction in CT images or as a hypoactive area on PET images with underlying bone osteolysis on CT image, whatever the size of FLs.
Diffuse pattern: Countless osteolytic lesions disseminated throughout the skeleton in CT image. The diffuse pattern was considered for all techniques except for PET due to the diffuse physiological bone uptake of [18F]NaF.
MRI Focal lesion: A circumscribed area with decreased signal intensity on T1‐weighted images (compared with para‐spinal muscles) and/or with hypersignal in grayscale maximum intensity projection of DW images.
Salt‐and‐pepper pattern: Diffuse, inhomogeneous patchy appearance of the bone marrow on T1‐weighted images. Diffuse pattern: Diffuse homogeneous hyposignal in the bone marrow on T1‐weighted images (compared with para‐
spinal muscles).
CT Focal lesion: An osteolytic bone lesion suspected to correspond to an MM bone lesion, whatever the size of FLs. Diffuse pattern: Countless osteolytic lesions disseminated throughout the skeleton.
WBXR Focal lesion: An osteolytic bone lesion suspected to correspond to an MM bone lesion, whatever the size of FLs. Diffuse pattern: Countless osteolytic lesions disseminated throughout the skeleton.
Abbreviations: CT, computed tomography; FL, focal lesion; MM, multiple myeloma; MRI, magnetic resonance imaging; PET/CT, positron emission tomog-raphy combined with CT; WBXR, whole‐body X‐ray.
was also classified as diffuse. Regarding MRI, a diffuse pattern was diagnosed when no areas of normal marrow were seen. Marrow involvement was characterized as focal when only focal areas of abnormal marrow were seen. The pattern of bone involvement was described by each technique for every patient according to definitions given in Table 1. Degenerative bone lesions that showed tracer uptake were not considered as PET‐positive MM lesions. Detection of extramedullary lesions was also considered. The FLs were classified according to their location: pelvis, skull, limbs, spine, ribs, and one location including the sternum, scapula, and clavicles.
2.4
|Comparison of detection rates
The detection rate of FLs by every imaging technique was assessed (including PET images considered alone), without considering the size of FLs, and compared with each other. Because of the possibility of detecting additional healed lesions in relapsed compared with newly diagnosed settings, the analyses were performed in each population separately. When comparing two imaging techniques, we initially considered a technique capable of identifying a FL (observed by another imaging technique) when the FL was recog-nized or when a diffuse pattern was seen on CT or MRI. This com-parison was critical for comparing MRI results where the diffuse pattern was more prevalent. In a separate analysis, the comparison of imaging techniques detection rates was conducted without taking the diffuse pattern into account. Throughout the manuscript, a MM lesion refers to a FL and/or the presence of a corresponding diffuse pattern; a FL refers to a FL without any sign of a corresponding diffuse pattern.
2.5
|Ionizing radiation exposure
Effective dose was calculated according to the 2015 International Commission on Radiological Protection recommendations23and was estimated for every patient by cumulating the effective dose related to the injected activity of [18F]NaF (mean ± SD: 132 ± 11 MBq) and
[18F]FDG (mean ± SD: 253 ± 15 MBq) and the effective dose related
to CT part.
2.6
|Statistical analyses
The McNemar test was used to compare the detection rates of imag-ing techniques, and the Kruskal‐Wallis test was used to estimate the relationship between the detection rate of PET FLs and the size of FLs measured with CT. The chi‐square test was used to compare the pattern of bone involvement between patients with newly diagnosed MM or relapsed MM.
3
|R E S U L T S
3.1
|Patients
Four of the 30 initially included patients were excluded because of delays between the imaging techniques (two patients) or incomplete imaging (two patients). Finally, 13 patients with newly diagnosed and suspected treatment‐requiring MM and 13 patients with relapsed MM were included. Patient characteristics are presented in Table 2. The median delay between scans was 7 days (range: 0‐36 d).
At diagnosis, overall, 296 FLs were detected. Per patient, one to three FLs (n = 3), four to 10 FLs (n = 4), or more than 10 FLs (n = 6) were detected (Table S1). The pattern of bone marrow involvement was focal (n = 7/13; 54%) or combined diffuse and focal (n = 6/13; 46%). At relapse, overall, 234 FLs were detected. Per patient, one to three FLs (n = 1), four to 10 FLs (n = 2), or more than 10 FLs (n = 9) were detected; one patient with relapsed MM did not present any FL (Table S2). No extramedullary disease was detected by any of the imaging techniques.
3.2
|Detection rates on a per
‐lesion basis
In patients with newly diagnosed MM, 84% of FLs were detected with [18F]NaF/[18F]FDG PET/CT (Figure 1A) while 50%, 59% and 14.5%
were detected by MRI, CT alone, and WBXR, respectively. At relapse, the detection rates of [18F]NaF/[18F]FDG PET/CT, MRI, CT alone, and WBXR were 64%, 45%, 43%, and 13%, respectively (Figure S1).
Overall, only 65% of FLs detected by PET/CT showed [18F]NaF/ [18F]FDG uptake, and osteolytic lesions showing [18F]NaF/[18F]FDG
uptake were generally larger (mean: 10 mm, range: 4‐75 mm) com-pared with those without uptake (mean: 6 mm, range: 4‐40 mm; P = 0.0003).
TABLE 2 Patients' characteristics
Newly diagnosed MM (n = 13)
Relapsed MM (n = 13)
Age (median, range) 64 y, 46‐81 y 58 y, 31‐82 y Sex Male 10 10 Female 3 3 Isotype IgG 6 10 IgA 3 2 IgM 0 1 Light chain 4 0
International Staging System
Stage I 5 7
Stage II 5 2
Stage III 3 4
Diffuse and salt‐and‐pepper patterns were described by MRI, in patients with newly diagnosed MM (n = 3 and n = 2, respectively) and in patients with relapsed MM (n = 6 and n = 3, respectively). The majority of FLs detected with MRI showed abnormal diffusion (94.5% at diagnosis and 90% at relapse).
When radiologists had access to the PET and CT acquisitions, they detect more osteolytic FLs compared with the analysis of CT results alone. This was observed at diagnosis (P < 0.0001) and at relapse (P = 0.0009), reflecting the synergy resulting from the combination of PET and CT.
3.3
|Detection rates according to the location of FLs
Both at diagnosis and at relapse, the detection rate of WBXR was significantly lower compared with those of the other techniques (Figure 2), except for FLs in the skull where the results of WBXR were similar to PET/CT and in the limbs where the detection rate of XR was similar to CT and PET, but lower than those of PET/CT and MRI. At all other locations, the detection rate of PET/CT per-formed at diagnosis was significantly (P≤ 0.046) higher than those of PET and CT alone and also outscored MRI (P ≤ 0.016) except for FLs located in the pelvis and limbs for which their detection rates were similar (Figure 3A).
At relapse, the global detection rate of PET/CT was 97% and thus similar to CT and significantly higher than that of MRI (n = 200; 85%; P < 0.0001). PET/CT identified more lesions in the spine, limbs, and shoulder region, while MRI identified more lesions in the pelvis and
in the ribs (Figure 3B). As expected, the detection rate of WBXR was significantly lower than those of all other techniques in both popula-tions (P < 0.0001) as illustrated in Figure 4 where WBXR did not detect a large pelvic lesion.
3.4
|Comparison of detection rates
At diagnosis, the detection rate of MM lesions, taking the diffuse pat-tern on CT or MRI (n = 296 FLs; 100%) into account, was significantly different (P≤ 0.0047) between techniques (Figure 3A): XR (n = 92; 31%) < PET (n = 160; 54%) < CT (n = 214; 72%) < MRI (n = 257, 87%) < PET/CT (n = 277; 94%). At relapse (Figure 3B), the detection rate of PET/CT (n = 226; 97%) was similar to CT (n = 228; 97%; P = 0.16) and significantly higher than that of MRI (n = 200; 85%; P < 0.0001). The detection rate of MRI was significantly higher than that of PET (n = 102; 44%; P < 0.0001). We also compared techniques without taking the diffuse pattern into account. In that case, the detection rate of PET/CT was significantly higher than those of MRI (P≤ 0.0006), CT (P < 0.0001), and PET (P < 0.0001), in patients with both newly diagnosed and relapsed MM (Figure 3).
3.5
|Comparison of newly diagnosed MM and
relapsed MM
The number of FLs per patient did not differ in the two populations. The proportion of osteolytic FLs detected with PET/CT and showing FIGURE 1 Flowchart diagram of included patients with newly diagnosed multiple myeloma (MM) and the number of focal lesions (FLs) detected with every imaging technique. CT, computed tomography; MRI, magnetic resonance imaging; PET/CT, positron emission tomography combined with CT; XR, X‐ray
tracer uptake was similar (P = 0.2776) in newly diagnosed (n = 122/216; 57%) and in relapsed patients (n = 64/129; 50%).
Few PET FLs were hypoactive, and the proportion of hypoactive PET FLs was significantly higher (P = 0.0005) in patients with relapsed (n = 23/234; 10%) compared with newly diagnosed patients (n = 7/296; 2%). An additional difference between the two popula-tions was the higher prevalence of a diffuse pattern of bone marrow involvement (identified by CT or MRI) in relapsed compared with newly diagnosed patients (n = 11/13; 85% versus 6/13; 46%; P = 0.0148). Finally, the proportion of lesions according to their loca-tion was significantly different (P = 0.0051) with a significantly higher proportion of spine lesions in newly diagnosed patients (n = 101/296; 34% versus n = 53/234; 22%; P = 0.0039) and a significantly higher proportion of limb lesions in relapsed patients (n = 46/234; 20% versus n = 28/296; 9%; P = 0.0008).
Since [18F]NaF uptake is frequently seen in osteoblastic reactions
at the border of bone lesions, especially in healed bone lesions after therapy, we studied the proportion of PET hypoactive osteolytic lesions and the presence of sclerotic margins in patients with relapsing disease. We found that the proportion of PET hypoactive lesions in the osteolytic lesions without peripheral sclerosis was 5.3% (5/94) while it was 48.6% (17/35) in osteolytic lesions with peripheral sclero-sis in CT images. These results indicate that the proportion of hypoactive lesions is significantly more important in case of sclerosis (P < 0.0001, chi‐square test; Table 3).
3.6
|Clinical implication
On a per‐patient basis, the detection rates of PET/CT and MRI were similar both at diagnosis (92%) and at relapse (85%). However, PET/CT did not show any abnormality in one newly diagnosed patient for whom MRI showed a single lesion in a thoracic vertebra (Figure S3). PET/CT was negative in two relapsing patients for whom MRI showed a diffuse infiltration in one and a single large sacral lesion with diffuse pattern in the other patient. The agreements and disagree-ments between MRI and PET/CT at the patient's level are presented in Tables S3 and S4.
In newly diagnosed patients, carrying out PET/CT upgraded the diagnosis from solitary plasmacytoma to MM in one patient and confirmed the indication for treatment by identifying large lytic lesions in two additional patients, presenting only doubtful skull lesions if only WBXR and MRI would have been considered (as illustrated in Figure 4). For one patient with relapsed MM, PET/CT and MRI identi-fied a large hypermetabolic lesion in the pelvis that required radiotherapy.
3.7
|Exposure to ionizing radiation
The mean ± SD cumulative effective dose of the combined [18F]FDG
and [18F]NaF PET/CT procedure was 14.3 ± 1.2 mSv.24The effective FIGURE 2 Illustration of the distribution of focal lesions in patients, according to their anatomic location. The number of focal lesions (FLs) detected was 296 and 234 at diagnosis and at relapse, respectively. The upper panels illustrate the total number of lesions seen in every region. The lower panels illustrate the number of lesions detected by the different techniques at every anatomic location. CT, computed tomography; MRI, magnetic resonance imaging; PET/CT, positron emission tomography combined with CT; XR, X‐ray
dose related to CT, [18F]NaF, and [18F]FDG was 7.1 ± 0.9, 2.2 ± 0.2, and 4.8 ± 0.3 mSv, respectively. The effective dose of [18F]FDG PET/CT
without injection of [18F]NaF would have been 11.9 ± 0.9 mSv.
4
|D I S C U S S I O N
This work showed that the combined [18F]NaF/[18F]FDG PET/CT
pro-vided the highest detection rate of FLs, compared with MRI, CT alone, PET alone, or XR. The comparison of our results to previous studies assessing [18F]FDG PET/CT for the detection of MM lesions is
difficult, in particular due to the lack of standardized criteria for the definition of PET positivity.8,14,24,25Moreover, when considering the
comparison with MRI, the variations of MR acquisition parameters need to be taken in account. Regardless of these methodological aspects, studies showed FLs detection rate of [18F]FDG PET/CT varying from 65% to 82% in patients with newly diagnosed MM on a per‐patient basis, and studies showed similar performances when comparing [18F]FDG PET/CT with MRI.8,14,24,25The results obtained
with our combined injection are not superior to the results obtained with [18F]FDG PET/CT alone and do not support the routine use of
combining both tracers.
FIGURE 3 Number of detected myeloma lesions according to the imaging technique (number in brackets in the x‐axis) in patients with (A) newly diagnosed myeloma and (B) relapsed myeloma. A, At diagnosis, the overall number of focal lesions (FLs) was 296. The white columns show the number of FLs only; the black columns show the number of FLs detected by the other techniques and corresponding to a diffuse pattern with the corresponding technique. The FLs' detection rate of whole‐body X‐rays was significantly lower than those of all other techniques (*P < 0.0001). The detection rates of MRI and PET and PET and CT were comparable (P = 0.23 and P = 0.17, respectively). B, In relapsing multiple myeloma (MM), the overall number of FLs was 234. The detection rates of MRI and PET, MRI and CT, and PET and CT were comparable (P = 0.72, P = 0.67, and P = 0.92, respectively), while the detection rate of whole‐body X‐rays was significantly lower (*P < 0.0001). CT, computed tomography; MRI, magnetic resonance imaging; PET, positron emission tomography; XR, X‐ray
A limitation of the combined injection of tracers is that the infor-mation on bone forinfor-mation given by [18F]NaF uptake and prognostic significance of [18F]FDG uptake cannot be discriminated in PET/CT
images (Figure S2).12,16Additionally and presumably, it is most likely that combined [18F]NaF/[18F]FDG PET/CT will not be suitable for
treatment assessment, in particular due to the delayed changes of [18F]NaF uptake by MM lesions after treatment initiation.21Our study
was not designed to compare the detection rates of combined tracer injection versus [18F]FDG alone. The latter would have required an
additional separate [18F]FDG PET/CT. In our study, combinatorial PET scan detected 65% of the lesions seen in newly diagnosed
patients, and its detection rate was lower compared with standard low‐dose CT. This percentage is comparable with the detection rate of [18]F
‐FDG PET, which ranges between 60% and 80%.26-28Since
the detection of lytic bone lesions is one of the main criteria for starting an anti‐MM treatment, WBCT is currently considered as the standard technique for investigating MM‐induced bone disease of myeloma bone disease.
According to the IMWG, an MRI of the spine and pelvis can be used in cases where WBMRI is not available.29However, in our
pop-ulation, the prevalence of FLs located out of the field of view of an MRI limited to the spine and pelvis was high: 39% and 50% of the lesions would have been missed at diagnosis or at relapse, respec-tively. Therefore, MRI restricted to the spine and pelvis may not be sufficient in patients with MM and particularly so in relapsed patients (as illustrated in Figure 5).29
The arms were positioned alongside the body during PET/CT image acquisition, inducing artifacts in CT images of the spine. Since the present work, in order to reduce CT artifacts in the spine in clinical setting, MM patient arms are raised above the head for acquisition, if possible. Peripheral FLs located beyond humeral bones and femurs were not detected in newly diagnosed patients, while they were detected in four patients at relapse (radius: n = 1 patient; fibula: n = 3 patients), suggesting that WB acquisition from vertex to toes could be considered in relapsing MM.
TABLE 3 PET findings in osteolytic lesions with or without periph-eral sclerosis, based on CT images, in patients with relapsed MM
PET Findings
Without Sclerosis
Sclerotic
Lesions Total
Lesions with tracer uptake 57 7 64 (50%)
Hypoactive lesions 5 17 22 (17%)
No lesion in PET images 32 11 43 (33%)
Total 94 (73%) 35 (27%) 129 (100%)
Abbreviations: CT, computed tomography; MM, multiple myeloma; PET, positron emission tomography.
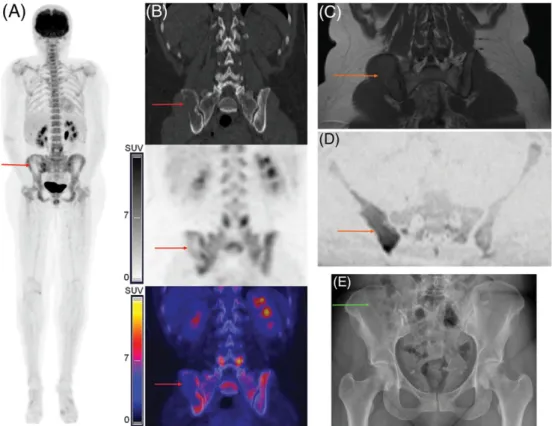
FIGURE 4 Images of a female patient (46 y old) with newly diagnosed multiple myeloma (MM). A large predominantly osteolytic focal lesion (FL) in the right iliac bone showed peripheral mild [18F]NaF/[18F]FDG uptake (A: PET: maximum intensity projection; B: CT, PET and fused PET/CT; red
arrows). The MRI also showed an FL with restricted diffusion (C: T1‐weighted spin‐echo images; D: DWI; orange arrows). However, only four skull FLs only were detected by WBXR, and the large bone lesion in the right iliac bone was overlooked (E: green arrow). CT, computed tomography; MRI, magnetic resonance imaging; PET/CT, positron emission tomography combined with CT; WBXR, whole‐body X‐ray
The highest proportion of hypoactive PET FLs in relapsed MM may be related to potentially healed lesions. Nevertheless, out of the 23 hypoactive PET osteolytic FLs, 14 (61%) showed abnormalities in MR images (n = 6/23 FLs and n = 8/23 diffuse patterns) and only 9 of 23 (39%) did not show any abnormality in MR images. Additionally, hypoactive PET osteolytic FLs were also detected in newly diagnosed patients (n = 7), and all showed abnormalities in MR images (n = 6 diffuse patterns and n = 1 FL). These observations suggest that hypoactive FLs in [18F]NaF/[18F]FDG PET images may not necessarily
correspond to healed lesions.
Around 10% of FLs detected with PET/CT were pathological fractures (ribs or vertebra), and all corresponded to abnormalities on MR images (diffuse and/or focal patterns); nevertheless, specificity of both PET/CT and MRI for the differentiation of fracture with or without underlying MM lesion is limited.19,30
5
|C O N C L U S I O N
Our study showed that the injection of dual tracer, combining [18F]
NaF and [18F]FDG, for the detection of myeloma lesions by PET/CT is feasible and the obtained results indicate a higher lesion detection rate compared with WBMRI, WBCT, and WBXR. However, the obtained detection rates with this combined approach are not superior to the reported detection rates of PET‐CT after injection of [18F]FDG,
which remains the standard tracer for diagnosis and follow‐up of MM disease.
A C K N O W L E D G M E N T S
We thank Frederic Mievis, Fabrice Giacomelli, and Christine Mella (CYCLOTRON Research Centre, University of Liege, Belgium) for the syntheses of [18F]FPRGD
2and [18F]NaF and Laurence Seidel for the
statistical analyses. Preliminary results were presented at the SNMMI 2016 Annual Meeting (San Diego, CA, USA) and at the 6th Interna-tional Workshop on PET in Lymphoma in 2016 (Menton, France). This work was supported by grants from the Belgian Foundation Against Cancer, the Fonds d'Investissement de Recherche Scientifique (FIRS, CHU of Liege), the Fonds National de la Recherche Scientifique (FNRS, Belgium), and the Fonds Spéciaux de la Recherche (University of Liege).
O R C I D
Jo Caers https://orcid.org/0000-0002-3175-1195
R E F E R E N C E S
1. Cavo M, Terpos E, Nanni C, et al. Role of18F‐FDG PET/CT in the
diagnosis and management of multiple myeloma and other plasma cell disorders: a consensus statement by the International Myeloma Working Group. Lancet Oncol. 2017;18(4):e206‐e217.
2. Rajkumar SV, Dimopoulos MA, Palumbo A, et al. International Myeloma Working Group updated criteria for the diagnosis of multiple myeloma. Lancet Oncol. 2014;15(12):e538‐e548.
3. Caers J, Garderet L, Kortum KM, et al. European Myeloma Network recommendations on tools for the diagnosis and monitoring of multiple myeloma: what to use and when. Haematologica. 2018;103(11): 1772‐1784.
FIGURE 5 Images of whole‐body (WB) combined [18F]NaF/[18F]FDG PET/CT (A: PET: maximum intensity projection; B: CT; C: fused PET/CT)
and MRI (D: T1‐weighted spin‐echo images; E: DWI) of a 55‐y‐old female patient with relapsed multiple myeloma (MM) diagnosed 7 y earlier and for whom the last treatment was stopped 3 y before imaging. Distal focal lesions (FLs) in the femurs were detected with PET/CT (A‐C: red arrows) and MRI (D,E: orange arrows). A diffuse bone marrow involvement was described with XR, and these FLs were therefore overlooked with XR (not shown). Lesions were also detected in the humeri (A: purple arrows) and radius (A: green arrows). CT, computed tomography; MRI, magnetic resonance imaging; PET, positron emission tomography; XR, X‐ray
4. Mangiacavalli S, Pezzatti S, Rossini F, et al. Implemented myeloma management with whole‐body low‐dose CT scan: a real life experience. Leuk Lymphoma. 2016:1‐7;57(7):1539‐1545.
5. Hillengass J, Moulopoulos LA, Delorme S, et al. Whole‐body computed tomography versus conventional skeletal survey in patients with multi-ple myeloma: a study of the International Myeloma Working Group. Blood Cancer J. 2017;7(8):e599.
6. Moreau P, Attal M, Karlin L, et al. Prospective evaluation of MRI and PET‐CT at diagnosis and before maintenance therapy in symptomatic patients with multiple myeloma included in the IFM/DFCI 2009 trial. Blood. 2015;126(23):395.
7. Pawlyn C, Fowkes L, Otero S, et al. Whole‐body diffusion‐weighted MRI: a new gold standard for assessing disease burden in patients with multiple myeloma? Leukemia. 2016;30(6):1446‐1448.
8. Moreau P, Attal M, Caillot D, et al. Prospective evaluation of magnetic resonance imaging and [18F]fluorodeoxyglucose positron emission
tomography‐computed tomography at diagnosis and before mainte-nance therapy in symptomatic patients with multiple myeloma included in the IFM/DFCI 2009 trial: results of the IMAJEM study. J Clin Oncol. 2017:JCO2017722975;35(25):2911‐2918.
9. Lee SY, Kim HJ, Shin YR, Park HJ, Lee YG, Oh SJ. Prognostic signifi-cance of focal lesions and diffuse infiltration on MRI for multiple myeloma: a meta‐analysis. Eur Radiol. 2016;27(6):2333‐2347. 10. Mai EK, Hielscher T, Kloth JK, et al. Association between magnetic
res-onance imaging patterns and baseline disease features in multiple myeloma: analyzing surrogates of tumour mass and biology. Eur Radiol. 2016;26(11):3939‐3948.
11. Bartel TB, Haessler J, Brown TL, et al. F18‐fluorodeoxyglucose positron emission tomography in the context of other imaging techniques and prognostic factors in multiple myeloma. Blood. 2009;114(10):2068‐2076.
12. Zamagni E, Patriarca F, Nanni C, et al. Prognostic relevance of 18‐F FDG PET/CT in newly diagnosed multiple myeloma patients treated with up‐front autologous transplantation. Blood. 2011;118(23): 5989‐5995.
13. Spinnato P, Bazzocchi A, Brioli A, et al. Contrast enhanced MRI and
18F‐FDG PET‐CT in the assessment of multiple myeloma: a
compari-son of results in different phases of the disease. Eur J Radiol. 2012;81(12):4013‐4018.
14. Zamagni E, Nanni C, Mancuso K, et al. PET/CT improves the definition of complete response and allows to detect otherwise unidentifiable skeletal progression in multiple myeloma. Clin Cancer Res. 2015;21(19):4384‐4390.
15. McDonald JE, Kessler MM, Gardner MW, et al. Assessment of total lesion glycolysis by18F FDG PET/CT significantly improves prognostic
value of GEP and ISS in myeloma. Clin Cancer Res. 2016;23(8): 1981‐1987.
16. Regelink JC, Raijmakers PG, Bravenboer N, et al.18F‐fluoride‐PET for
dynamic in vivo monitoring of bone formation in multiple myeloma. EJNMMI Res. 2016;6(1):46.
17. Xu F, Liu F, Pastakia B. Different lesions revealed by 18F‐FDG PET/CT and 18F‐NaF PET/CT in patients with multiple myeloma. Clin Nucl Med. 2014;39(9):e407‐e409.
18. Nishiyama Y, Tateishi U, Shizukuishi K, et al. Role of 18F‐fluoride PET/CT in the assessment of multiple myeloma: initial experience. Ann Nucl Med. 2013;27(1):78‐83.
19. Sachpekidis C, Goldschmidt H, Hose D, et al. PET/CT studies of multi-ple myeloma using18F‐FDG and18F‐NaF: comparison of distribution
patterns and tracers' pharmacokinetics. Eur J Nucl Med Mol Imaging. 2014;41(7):1343‐1353.
20. Ak I, Onner H, Akay OM. Is there any complimentary role of F‐18 NaF PET/CT in detecting of osseous involvement of multiple myeloma? A comparative study for F‐18 FDG PET/CT and F‐18 FDG NaF PET/CT. Ann Hematol. 2015;94(9):1567‐1575.
21. Sachpekidis C, Hillengass J, Goldschmidt H, et al. Treatment response evaluation with18F‐FDG PET/CT and 18F‐NaF PET/CT in multiple
myeloma patients undergoing high‐dose chemotherapy and autolo-gous stem cell transplantation. Eur J Nucl Med Mol Imaging. 2017;44(1):50‐62.
22. Minamimoto R, Loening A, Jamali M, et al. Prospective comparison of
99mTc‐MDP scintigraphy, combined 18F‐NaF and 18F‐FDG PET/CT,
and whole‐body MRI in patients with breast and prostate cancer. J Nucl Med. 2015;56(12):1862‐1868.
23. Mattsson S, Johansson L, Leide SS, et al. Radiation dose to patients from radiopharmaceuticals: a compendium of current information related to frequently used substances. Ann ICRP. 2015;44(2 Suppl):7‐321.
24. Waheed S, Mitchell A, Usmani S, et al. Standard and novel imaging methods for multiple myeloma: correlates with prognostic laboratory variables including gene expression profiling data. Haematologica. 2012;98(1):71‐78.
25. Zamagni E, Nanni C, Patriarca F, et al. A prospective comparison of 18F‐fluorodeoxyglucose positron emission tomography‐computed tomography, magnetic resonance imaging and whole‐body planar radiographs in the assessment of bone disease in newly diagnosed multiple myeloma. Haematologica. 2007;92(1):50‐55.
26. Lapa C, Garcia‐Velloso MJ, Luckerath K, et al.11C‐methionine‐PET in
multiple myeloma: a combined study from two different institutions. Theranostics. 2017;7(11):2956‐2964.
27. Hur J, Yoon CS, Ryu YH, Yun MJ, Suh JS. Efficacy of multidetector row computed tomography of the spine in patients with multiple myeloma: comparison with magnetic resonance imaging and fluorodeoxyglucose‐ positron emission tomography. J Comput Assist Tomogr. 2007;31(3): 342‐347.
28. Regelink JC, Minnema MC, Terpos E, Kamphuis MH, Raijmakers PG. Pieters‐van den Bos IC, et al. Comparison of modern and conventional imaging techniques in establishing multiple myeloma‐related bone disease: a systematic review. Br J Haematol. 2013;162(1):50‐61. 29. Dimopoulos MA, Hillengass J, Usmani S, et al. Role of magnetic
reso-nance imaging in the management of patients with multiple myeloma: a consensus statement. J Clin Oncol. 2015;33(6):657‐664.
30. Dutoit JC, Vanderkerken MA, Anthonissen J, Dochy F, Verstraete KL. The diagnostic value of SE MRI and DWI of the spine in patients with monoclonal gammopathy of undetermined significance, smouldering myeloma and multiple myeloma. Eur Radiol. 2014;24(11):2754‐2765.
S U P P O R T I N G I N F O R M A T I O N
Additional supporting information may be found online in the Supporting Information section at the end of the article.
How to cite this article: Withofs N, Beguin Y, Cousin F, et al. Dual‐tracer PET/CT scan after injection of combined [18F]NaF
and [18F]FDG outperforms MRI in the detection of myeloma lesions. Hematological Oncology. 2019;37:193–201. https:// doi.org/10.1002/hon.2600

![FIGURE 5 Images of whole ‐ body (WB) combined [ 18 F]NaF/[ 18 F]FDG PET/CT (A: PET: maximum intensity projection; B: CT; C: fused PET/CT) and MRI (D: T1 ‐ weighted spin ‐ echo images; E: DWI) of a 55 ‐ y ‐ old female patient with relapsed multiple myeloma](https://thumb-eu.123doks.com/thumbv2/123doknet/6798881.188892/8.892.174.724.72.419/figure-images-combined-intensity-projection-weighted-relapsed-multiple.webp)
