The earthquake sedimentary record in the Western part of the Sea of
1Marmara, Turkey
2L.Drab, A.Hubert-Ferrari, S.Schmidt, P.Martinez 3
Abstract
4
The submarine part of the North Anatolian Fault (NAF) is a very significant hazard for the 12
5
million people living in Istanbul (Turkey). An accurate seismic risk assessment necessitates
paleo-6
seismological data, which can be retrieved in the Marmara Sea by using sedimentary cores. Here a
7
record of turbidites was obtained in five cores spanning the Tekirda˘g Basin, the Western High and
8
the Central Basin linked by the Tekirda˘g Fault Segment. The turbidites are synchronous at
differ-9
ent sites across the two basins and through the structural high pointing to shaking by earthquakes
10
as a triggering mechanism. In particular the M=7.4 1912 M¨urefte earthquake left a distinctive
11
sedimentary imprint in all the studied cores. Radiocarbon dating implies a turbidite recurrence
12
interval of about 300 years. The low number of seismoturbidites documented in the Central Basin
13
compare to the Tekirda˘g Basin suggests quasi-synchronous ruptures of the Tekirda˘g Segment and
14
the adjacent Central Segment of the NAF or a partial seismic slip on the Central Segment. Both
15
scenarios have implications regarding seismic hazard. Finally though we obtained a
paleoseismo-16
logical record of the ruptures along the Tekirda˘g Segment, further chronological constraints are
17
needed to better date the events and to confirm the completeness of the obtained record.
18
Introduction
19Hazard risk assessment for populations living in tectonically active areas can be improved using pale-20
oseismology, by building an extended database of major earthquakes and earthquake recurrence time 21
(Fraser et al., 2010). Even though most studies in this field of inquiry were historically based on 22
on-land field work, e.g. in California, in Turkey, in Italy, in Himalayas, in Tibet (Dolan et al., 2003; 23
Weldon et al., 2004; Galli et al., 2008; Kondo et al., 2008; Fraser et al., 2010; Klinger et al., 2011), 24
recently interesting offshore studies appeared (Goldfinger et al.,2003a;Goldfinger,2011). These stud-25
ies use the identification of mass-wasting deposits triggered by large earthquakes to obtain records of 26
events over 1000s of years (McHugh et al., 2006; Beck et al., 2007). Mass-wasting deposits related 27
1 Settings
to earthquakes have a specific signature and can be distinguished from other deposits emplaced by 28
hyperpycnal flow, wave storm loading among others (Gorsline et al.,2000;Nakajima and Kanai,2000; 29
Shiki et al., 2000; Beck et al., 2007). Earthquake triggered turbidites may mobilise 5 to 10 times 30
the sediment volume of classical turbidites (Gorsline et al., 2000) and usually show liquefaction or 31
flaser bedding structures (Beck et al., 2007). Their granulometric signature reflects a high energy 32
transportation mechanism forming a mass flow and a very large suspension cloud (Shiki et al.,2000). 33
As a result seismoturbidites have a sharp and wavy erosional base (Shiki et al., 2000), and can be 34
divided into a basal sand sublayer and a thick silt sublayer characterized by a poor size grading and 35
coeval deposition of sand, silt and clay particles (Nakajima and Kanai,2000;Shiki et al.,2000). 36
In this paper, we study the turbiditic sedimentation in the Marmara Sea, which is crossed by the 37
North Anatolian Fault, a major active strike-slip fault rupturing in M≥7 earthquakes. The presence 38
of the urban area of Istanbul on its shoulder, where about 12 M people live, makes this region a major 39
spot for seismic hazard studies. We identified turbiditic deposits in five 3 to 4 m long cores which 40
sample its different basins and highs. We then use global sedimentological changes to correlate the 41
different cores and to characterize the general depositional pattern in the Marmara Sea. Radiogenic 42
lead data allow us to discriminate the turbidites triggered by the 1912 earthquake. The granulometric 43
characteristics of the other turbidites, their lateral extent and the synchronicity of proximal and distal 44
deposits are used to infer a seismic trigger. Finally, we discuss the paleoseismological implication of 45
the identified seismoturbidites. 46
1
Settings
47
1.1 Tectonic setting 48
The North Anatolian Fault (NAF) is a 1500 km long dextral strike slip fault accommodating the 49
westward extrusion of the Anatolian Plate (Barka and Kadinsky-Cade,1988;Seng¨or et al.,2005). In 50
the Marmara Sea area, the NAF separates into branches spreading out the deformation over a width 51
of 130 km (Barka and Kadinsky-Cade, 1988). The northern branch of the NAF accommodates most 52
of the deformation (McClusky et al.,2003) and runs across the 170 km long Marmara Sea. 53
The Marmara Sea is composed of three aligned marine pull apart basins reaching a maximum water 54
depth of 1250 m (Le Pichon et al.,2001;Armijo et al.,2002;Sarı and C¸ a˘gatay,2006). From West to 55
East the basins are called Tekirda˘g, Central and C¸ ınarcık. They are respectively associated with the 56
present active Tekirda˘g, Central and C¸ ınarcık Fault Segments (Fig. 1). The different faults segments 57
1.2 The historical earthquake record
and the related basins have been imaged by seismic reflection and refraction profiles (Seeber et al., 58
2006; Carton et al.,2007; B´ecel et al., 2009) and modelled (Hubert-Ferrari et al., 2000; Muller and
59
Aydin, 2005). The basins are separated by two topographic ridges: the Western High and Central 60
High with a respective water depth of 700 m and 900 m (Le Pichon et al.,2001;Armijo et al.,2005). 61
The basins are sensitive to mass-wasting events triggered by major earthquakes rupturing the fault 62
strand, which crosses them (McHugh et al.,2006;Sarı and C¸ a˘gatay,2006;Beck et al.,2007). 63
64
1.2 The historical earthquake record 65
The northern branch of the NAF in the Marmara Sea is a major active fault characterized by a GPS 66
based right-lateral slip rate about 20 mm/yr (McClusky et al., 2003). The resulting accumulated 67
stresses are episodically released by major and destructive earthquakes recorded in history over 2000 68
years (Ambraseys,2002). During the 20thcentury, the 1912 M = 7.4 M¨urefte earthquake ruptured the 69
Ganos Segment located West of the Marmara Sea and probably also the offshore part of the Tekirda˘g 70
Segment (Armijo et al., 2005; Aksoy et al., 2010). In 1999, the M= 7.4 Izmit earthquake took place 71
just east of the Marmara Sea (Hubert-Ferrari et al., 2000). Five other events with M>7 occurred 72
during the period from 1509 to 1900 (1719, 1754, 1766 May, 1766 August, 1894) (Fig. 1,Ambraseys
73
2002;Pondard et al. 2007). The historical record provides earthquake damage data restricted to the 74
onland borders of the Marmara Sea and cannot be used alone to determine the epicenters and surface 75
ruptures. Even recent earthquakes database do not provide routinely accurate earthquake epicenters 76
and foci locations (Org¨¨ ul¨u, 2011). Finally, submarine scarps associated with past recent ruptures in 77
1912 and possibly in 1894 complement the seismological data set (Armijo et al.,2005;Pondard,2006). 78
1.3 Previous sedimentological core studies in the Marmara Sea 79
The Marmara Sea connects the Black Sea to the Aegean Sea through the Bosphorus and Dardanelles 80
straits. Because of its particular geographic situation, it is highly sensitive to climatic and environ-81
mental changes and was the focus of multiple sedimentological investigations (C¸ a˘gatay et al., 2000; 82
Abrajano et al.,2002; Hiscott et al.,2002;Major et al.,2002;Mudie et al.,2002;Vidal et al.,2010). 83
A key issue for these studies is the understanding of the nature of the reconnection between the Black 84
Sea and the Mediterranean Sea (catastrophic Major et al. 2002; or progressive C¸ a˘gatay et al. 2000; 85
Hiscott et al. 2002) ∼ 9 kyr BP ago (C¸ a˘gatay et al.,2000;Vidal et al.,2010). 86
Recent environmental changes related to anthropogenic disturbances were also identified. In partic-87
2 Material
ular, pollen studies (Mudie et al., 2002) put forward the occurrence of a progressive deforestation 88
starting 4 kyr ago in the watershed surrounding the Marmara Sea. During the Bey¸sehir Occupation 89
Phase (ca. 1300 years BC to ca. AD 200–800 years;Eastwood et al. 1998) vegetation changes and land 90
degradation have been documented in the Lakes Manyas and Ulabat (Kazanci et al.,2004). In both 91
lakes, which are part of the Kocasu River, a major source of sediments for the Marmara Sea, higher 92
rates of sedimentation started around 2 kyr BP. In parallel a progressive increase in sedimentation 93
rate on the Marmara Southern Shelf occurred (Kazanci et al.,2004) at the same time as the formation 94
of the most recent sapropel, 4750-3500 14C years BP ago (C¸ a˘gatay et al.,2000). Eris et al.(2007) also 95
suggested that the growth of the prodelta at the entrance of the Bosphorus was related to an increase 96
in sediment supply triggered by the clearing of forests in watersheds. 97
In addition to paleoclimatic investigations, paleoseismologic studies have recently used turbidites for 98
deciphering the earthquake history (McHugh et al.,2006;Sarı and C¸ a˘gatay,2006;Beck et al.,2007). 99
Multi-proxy analyses were performed on cores coming from Central Basin (McHugh et al.,2006;Beck
100
et al., 2007) and Tekirda˘g Basin (McHugh et al., 2006). Both authors conclude that: (1) significant 101
turbiditic deposition directly related to earthquake shaking occurs in the Marmara Basin (McHugh
102
et al.,2006;Beck et al.,2007), (2) basins’ filling is mainly controlled by active faults (U¸carku¸s,2010) 103
and may document earthquake rupture along the associated fault segments (McHugh et al., 2006; 104
Beck et al., 2007), (3) seismoturbidites are associated with oscillating bottom currents (seiche) with 105
variable suspended load or bedload (Beck et al.,2007). 106
2
Material
107
The cores studied (Klg02 to Klg08) were collected in the Marmara Sea during the Marmascarps mission 108
in 2002 shortly after the 1999 M=7.4 Izmit earthquake (Armijo et al., 2005). The coring sites are 109
similar to locations of ROV short cores (U¸carku¸s,2010) and long cores studied inBeck et al. (2007), 110
Londeix et al.(2009),Vidal et al. (2010). The seven Kullenberg cores are 3.5 m to 4.5 m long (Table 111
1) and are distributed in specific areas along the fault (Fig. 1). They provide a link between very 112
short interface cores (ROV) and the very long cores of the Marion Dufresne Cruise in which upper 113
meters are often missing or strongly disturbed. 114
The Klg05 and Klg08 cores are situated 6 km apart in the southern part of the Tekirda˘g Basin, along 115
the Tekirda˘g Segment of the NAF, at the outlet of deep canyons (Fig. 1). Further east the Klg06 116
core samples the intersection between the Western High and the Tekirda˘g Basin, and the Klg07 core 117
samples the intersection between the Central Basin and the Western High. These two cores lying 15 118
3 Methods
km apart are close to the Tekirda˘g Segment. Klg02 is located in the inner part of the Central Basin 119
pull apart (Armijo et al., 1999) between the Tekirda˘g and the Central Segments of the NAF. Klg03 120
and Klg04 sample the C¸ ınarcık Basin. The paper focuses on the Klg02, Klg05, Klg06, Klg07 and 121
Klg08 cores, but the XRF-data obtained for the Klg04 core is presented here because it highlights 122
global sedimentary changes occurring across the whole Marmara Sea. 123
3
Methods
124
Core processing, imaging and physical properties The sedimentary facies observed in cores 125
were described first to provide a basic core log. The visual core description was based on colour, 126
bedding, sedimentary structures and disturbances, grain size distribution, texture, bioturbation and 127
fossil content. This description was refined by using X-ray radiograms, granulometric data, magnetic 128
susceptibility measurements and XRF-scanning data. 129
In the X-ray pictures (EPOC scopix system in Bordeaux 1 University), the grey scale is proportional 130
to the X-ray penetration into the core and to the sediment density, with sand being usually black and 131
clay light grey (Migeon et al.,1999). The X-ray imagery was particularly useful to identify all possible 132
sedimentary structures like laminated coarser episodes, low angle symmetric cross lamination, ball-133
and-pillow structures, water-escape structures, displacements previously interpreted in sedimentary 134
cores sampling the Tekirda˘g Basin as specific imprints of major earthquakes by Beck et al.(2007). 135
The magnetic susceptibility measurements were performed on the split cores using a bartington MS2E 136
sensor with 5 mm interval at room-temperature. The data provide a first-order identification of layers 137
enriched in coarse detrital material (Fe, Mg, Ti) which can characterize the base of turbidites (Butler, 138
1992;Tauxe,2010). Microgranulometric analyses were performed on bulk sediment sub-samples from 139
u-channels at 10 mm intervals using a Malvern mastersizer 2000s. Percentage of clay, silt and sand 140
particles were computed as well as mode, median, mean, skewness and kurtosis indices (Folk,1968). 141
The data help to characterize turbidites in term of depositional process (Pettijohn et al.,1987;Sperazza
142
et al.,2004). 143
XRF XRF data collected by X-ray fluorescence on an Avaatech XRF core scanner were used to 144
correlate cores between the basins and the Western High and to refine sedimentological and geochem-145
ical processes associated with turbiditic deposition. The split-core sections were measured every 5mm 146
with energies of fluorescence radiation of 10 keV and 30 keV to reach a large spectra of elements 147
comprising Al, Si, S, Cl, K, Ca, Ti, Mn, Fe, Br, Pb, Rb, Sr, Zr. The elemental distributions initially 148
4 Results
expressed in counts per second, were standardized to get a better comparison of the variations of 149
intensity through the different cores. As intensities are only a semi-quantitative measurement of the 150
real elemental composition, we used ratios that provide the most easily interpretable signal of relative 151
changes in chemical composition, and minimize the risk of drawing erroneous conclusions from XRF 152
data (Palike et al.,2001;Vlag et al.,2004;Bahr et al.,2005). The Ca/Ti ratio was exploited because 153
it represents autochthonous productivity in the Sea (Ca) with respect to terrigenous allochthonous 154
input (Ti), and because it is considered as a reliable proxy in the nearby Black Sea environment (Bahr
155
et al.,2005). 156
Age dating AMS14C dating was performed on foraminifers (planktonic and benthic), bulk sediment 157
and on shells in AEON laboratories and ARTEMIS LMC14 laboratory in the LSCE, Orsay. 158
Sediment accumulation rate for the last century was derived from profiles of excess 210P b activity 159
(210P bxs). 210P b and 226Ra activities were measured using a semi-planar γ detector at EPOC in the 160
University of Bordeaux 1 (Schmidt et al.,2009). Activities are expressed in mBq.g−1 and errors are 161
based on 1 standard deviation counting statistics. Excess 210P b was calculated by subtracting the 162
activity supported by its parent isotope,226Ra, from the total210P b activity in the sediment. Errors 163
in 210P bxs were calculated by propagation of errors in the corresponding pair (210P b and 226Ra). 164
The sedimentation rates were calculated from 210P bxs profiles using the constant flux - constant 165
sedimentation model (Robbins,1978): 166
[210P bxs]z= [210P bxs]0exp(−z λ
S) (1)
where [210P bxs]0,z, are the activities of excess 210P b at surface, or the base of the mixed layer, and 167
depth z, λ the decay constant of 210P b (λ = 0.0311 yr−1), and S the sediment accumulation rate. 168
4
Results
169
4.1 Main features of sedimentation in the Marmara Sea 170
Visual inspection shows that all cores have a very uniform silty-clay lithology with few sandy lamina-171
tions and rare gravelly layers containing numerous shells (indicated in red in the Figs. 4, 5,6). The 172
colour of the cores is predominantly olive green changing into dark grey with sandy laminations. 173
X-ray imagery shows a succession of dark sub-layers that are progressively grading to greyer colour 174
(Fig. 3event e6 in Klg05) and in places to light grey colours (Fig. 3 event 4 in Klg02) defining what 175
4.1 Main features of sedimentation in the Marmara Sea
we call here a sedimentary event. The thickest dark layers correspond to sandy laminations and to 176
gravelly layers identified during visual inspection. The dark grey, grey to light grey sequences show 177
an important thickness range from 10 cm to more than 1 m thick. These sequences form about 80% 178
of the sedimentary record of cores located in deep basins (Klg02, Klg05 and Klg08). X-ray pictures 179
show detailed textural and structural changes in the three sublayers. Dark grey sublayers have a sharp 180
basal surface (Fig. 2: 263 cm), which can be wavy indicating erosion (Figs. 2,3) and associated with 181
strong structural and cross disturbances (Figs. 2,4). The overlying intermediate grey sublayer shows 182
numerous thin parallel laminations in greater concentration near its base (Fig. 3 events e3 and e4 183
in Klg02 and e6 in Klg05) that can be link to oscillating currents (Beck et al., 2007). The sequence 184
is capped by a light-grey sublayer with possible traces of bioturbation (Figs. 2, 3-Klg05). Similar 185
events were already described in the Marmara Sea by using X-ray images, and were interpreted as the 186
sedimentary rework of major earthquakes (McHugh et al.,2006;Beck et al.,2007). 187
Grain size measurements are similar for all cores with a dominance of silt-sized particles. Sieving shows 188
that silt-sized particles are a mixture of mineral grains, different kind of shells including foraminifers, 189
marine and terrestrial organic material among others. A systematic trend is observed in the upper 190
part of cores characterized by a progressive increase in the percentage of silt-sized particles and a 191
coeval decrease in the percentage of clay-sized particles (Fig. 2). All cores show multiple fine-grained 192
sand deposits which systematically match with the dark sublayers identified in X-ray imagery and 193
with high values in magnetic susceptibility, χ (Fig. 4, 5). In the overlying grey sublayer, silt usually 194
reaches a maximum just above the sand layer and, slowly decreases upward to a minimum or stays 195
nearly constant. The top light grey sublayer shows a relative increase in clay compared to silt. We 196
thus interpret sedimentary events composed of (1) a basal sandy sublayer possibly erosive, (2) an 197
intermediate laminated silt sublayer overlain by (3) an upper clayey silt sublayer with some bioturba-198
tion as major turbidites. We also identify in the cores very thin sand lamina that could correspond 199
to minor turbidites. They typically have less than half of the volume of the smallest major turbidite 200
identified in the same core. 201
To constrain the depositional pattern of the major turbidites, their textural characteristics are ac-202
cessed by computing distribution parameters like mean, sorting, skewness, kurtosis (Folk 1968; Fig. 203
3 e6-Klg05 and e4-Klg02). Major sandy turbidites have the following characteristics. (1) the basal 204
layer of the turbidites often shows multiple pulses, (2) grain size change between the sand and the silt 205
sublayers is abrupt, (3) change in grain size, sorting and skewness can also be abrupt in the silt and 206
clayey silt sublayers, whereas the decrease in kurtosis is generally gradual. The top clay-rich part of 207
4.2 Specific features of each site
the turbidite is marked by a minima in sorting and a skewness around zero. 208
The major turbidites have also a distinct XRF signature. They typically show a local increase in 209
zirconium (Zr) content (Figs. 2-b, 4). The sand sublayers are characterized by a decrease in bromine 210
(Br) content whereas a relative increase in titanium (Ti) is observed in both the underlying sandy and 211
silt-rich sublayers. Manganese (Mn) shows a sharp increase just below the basal sandy sublayer. The 212
transition to the hemipelagic sedimentation is marked by a rising until a maximum in K, Ca or in 213
Ca/Ti ratio. These elements do occur in proportion in the hemipelagic sedimentation (Fig. 8). Minor 214
turbidites do not have a noteworthy XRF signature. 215
The stratigraphic logs of cores presented in Figs. 4, 5, 6 show the X-ray intensities, the magnetic 216
susceptibility, the granulometric measurements and XRF data. The dark Zr enriched sand base, the 217
laminated grey silt sublayer and the clayey silt top sublayers are shown with different grey scale 218
colours, and labelled downward from the top of the core. Minor turbidites are not labelled. 219
4.2 Specific features of each site 220
In the Tekirda˘g Basin, the 350 cm long sedimentary record of the core Klg05 (Fig. 4) shows ten 221
major turbidites. Sedimentary events are characterized by (1) a sharp sand sublayer with χ and/or Zr 222
peaks overlain by lamina, (2) an increase in Ti content in the basal and silt sublayers, (3) a Mn peak 223
beneath the basal sand. Standing alone thin sandy layers are interpreted as minor turbidites. The 224
largest turbidites labelled e5 and e6 at 160 cm and 233 cm depth have a gravelly base and a respective 225
thickness of 55 cm and 70 cm (zoom pictures on Fig. 4). To assess the depositional pattern of these 226
turbidites, distribution parameters (mean, sorting, skewness, kurtosis) are calculated and divided in 227
layers labelled I, II, III and IV (Fig. 3). Above the gravelly base event e5 shows successively two 228
sandy peaks, an inverse grading in the silty sublayer (mean size in phi decreases in Fig. 3) followed by 229
an abrupt change in mean-sorting indexes then by normal grading. In event e6 the two basal sandy 230
peaks (I in Fig. 3) are overlain by a first fining upward sublayer with gradually increasing sorting and 231
decreasing skewness (layer II). Layer II is capped by additional sublayers with nearly constant mean, 232
skewness and sorting separated by an abrupt change (III and IV in Fig. 3). In the sorting–skewness 233
diagram, grain size evolves gradually towards smaller skewness and better sorting values, but with dis-234
tinctive groups representing the different sublayers. The geochemical evolution of the two turbidites 235
also show coeval changes with the granulometry (Fig. 3). K intensity shows a gradual evolution 236
through the turbidite similar to the kurtosis index and might reflect a relative increase in illite in the 237
grain assemblage. The characteristics of events 5 and 6, in particular non-gradual changes in grain 238
4.2 Specific features of each site
size and the two coarser basal pulses, are representative of other major turbidites recorded Klg05. 239
In the inner part of the Central Basin, the core Klg02 shows eleven major turbidites (Fig. 5), which 240
display a greater diversity regarding their geochemistry and textural patterns than in Klg05. The 241
observed diversity may reflect a larger variability in the emplacement and in the sources of turbidites 242
in the inner Central Basin compared to the Tekirda˘g Basin. Our identification of major turbidites was 243
based on disturbances identified in the X-Ray images combined with granulometric and geochemical 244
data suggesting sudden detrital input. Like in Klg05 there are two large turbidites labelled e3 and e4 245
occurring at 150 cm and 205 cm depth with a respective thickness of 70 cm and 50 cm. The shallowest 246
e3 turbidite presents a gravelly base associated with a strong χ peak (layer I in Fig. 3and Fig. 5). The 247
overlying deposit shows a gradual decrease in χ with two distinct phases. The silty sublayer (labelled 248
II in Fig. 3) shows small variations in mean and in sorting without trend except at the boundary of 249
the overlying clayey-silt sublayer characterized by step changes in all parameters. This top layer (III 250
in Fig. 3) is characterized by increasing sorting and a constant mean grain-size. The other large event 251
e4 has a sandy base with multiple laminations (I in Fig. 3) and a strong χ peak. The overlying layers 252
II and III present an atypical very low χ with very little geochemical changes (see Fe/Ca in Fig. 3) 253
and are similar to homogenites documented by Bertrand et al. (2008). Above the basal laminated 254
layer kurtosis and mean do not change significantly whereas skewness and sorting have similar but 255
very gradual evolutions. In the sorting–skewness diagram, the data is similar to the e6 turbidite in 256
Klg05 with a gradual evolution toward better sorting values and smaller skewness except at the top. 257
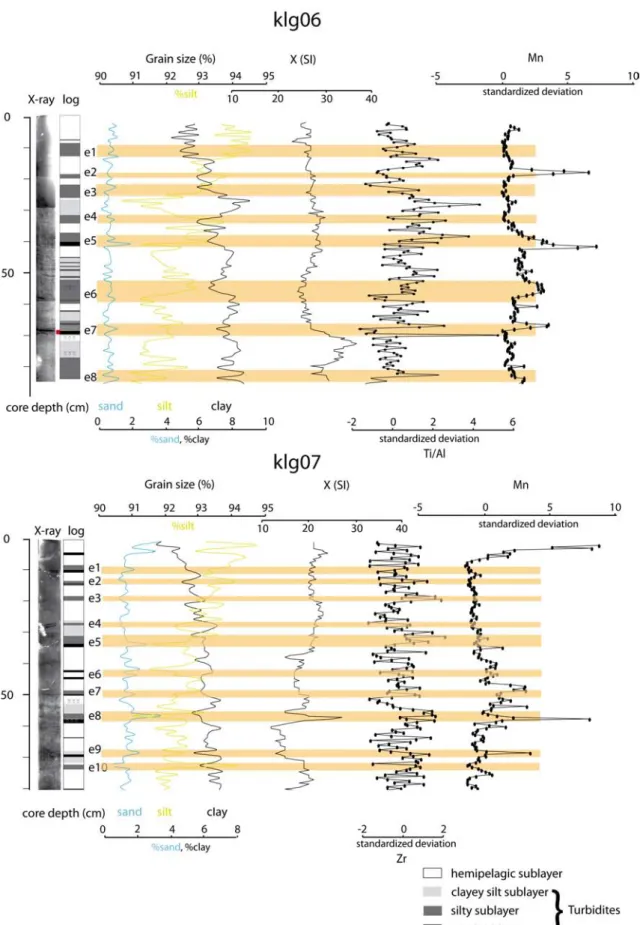
In the Western High, the granulometric trends in Klg06 and Klg07 cores differ from the cores in the 258
basins (Fig. 6). Sand size particles are less than 1% with few peaks. The major part of the signal 259
comes from the silt-sized particles profile, which is between 94% and 90%. We focus on the top 80 cm 260
of the cores in figure6 but complete data are included in the Supplemental Data. 261
In Klg06 we identified eight silt turbidites in the X-ray imagery that correspond to a punctual upward 262
increase in grain size capped by a relative increase in clay (Fig. 6). The layers are associated with 263
manganese peaks, and an increase in Ti/Al ratio. The two thickest and most distinctive silt turbidites 264
labelled e5 and e7 are recorded at depth of 58 cm and 85 cm. The e5 turbidite has the largest sand 265
peak and e7 is associated with the only distinct magnetic susceptibility peak in the core. Both tur-266
bidites have a strong XRF signature characterized by an increase in the Ti/Al ratio in the main body 267
and a marked increase in manganese content beneath. 268
In the core Klg07, ten fine grained turbidites were recognised. These turbidites are thin and are iden-269
tified based on faint disturbances in the X-ray imagery, grain-size changes, χ peaks and geochemical 270
4.3 Age constraints
spikes in Zr, Sr/Ca and Mn (Fig. 6). Four turbidites labelled e1, e5, e8 and e9 at 10 cm, 32 cm, 58 271
cm and 69 cm in depth have a sandy base. Events e5 and e8 correspond to the largest events and 272
show zirconium, manganese and magnetic susceptibility peaks. 273
4.3 Age constraints 274
4.3.1 Excess 210P bxs activities 275
The age of sediments in the first 20 to 50 cm of all cores was constrained by using unsupported 276
lead data. Excess210P b activities for each core are consistent with the activities of the nearby ROV 277
cores recovered during the same cruise (Fig. 7). In the first 10 cm of cores Klg05, Klg08 and Klg06, 278
210P b
xs activities present an exponential decay with increasing depth with no evidence of reworking, 279
as confirmed by X-ray imagery. The limited shift between ROV and Klg profiles indicates a moderate 280
loss of surface sediment up to 6 cm for Klg08 during coring. The210P b derived sedimentation rates are 281
0.23 cm.yr−1 for Tekirda˘g Basin (Klg08 and Klg05), 0.12 cm.yr−1 for Western High (Klg06). These 282
rates are interpreted to represent steady hemipelagic sedimentation rates. 283
The uppermost section of the cores Klg02 and Klg07 shows constant210P bxs activities in an inferred 284
mixed layer. In core Klg02, the 35 cm thick mixed layer is identical to the210P b trend in the nearby 285
core C4 studied in McHugh et al. (2006) (Fig. 1) and is associated with two thin sandy turbidites 286
visible in the X-ray imagery and in the granulometric data. We have no explanation for the origin of 287
this mixed layer. 288
In core Klg07, the mixed layer is only 5 cm thick. In the nearby 20 cm long core collected using a ROV, 289
there is no mixed layer that suggests that it is a coring artefact. Below the mixed layer,210Pb activity 290
shows a rapid exponential decay with depth. The inferred background hemipelagic sedimentation rate 291
is 0.15 cm.yr−1 in Klg02 (Central Basin) and is 0.10 cm.yr−1 in Klg07 (Western High) similar to the 292
Klg06 rate. 293
4.3.2 Radiocarbon age dating 294
Radiocarbon age dating shows globally a large disparity depending on the material used (shells, 295
bulk sediment and foraminifers) (Table 2). Ages calculated from shells in cores Klg05, Klg08 and 296
Klg06 generally overestimate the expected age of the host sediment, and indicate significant reworking 297
and external sedimentary supply from the shelf associated with turbiditic deposition. Ages of bulk 298
sediments (TOC and TIC) are also too old and are not further discussed. Ages obtained from both 299
planktonic and benthic foraminifers extracted on the top of turbiditic events are the most reliable and 300
5 Interpretation
thus form the basis for our chronology. 301
Planktonic foraminifers were obtained in sufficient abundance to be dated only at a few locations, so 302
benthic foraminifers were also dated. To further constrain our age model, we correlate our records 303
with nearby published sedimentary cores. In the Western High, by comparing the Klg06 core to the 304
core MD2430 studied by Vidal et al. (2010), the Younger Dryas transition would be below the core 305
bottom which is in agreement with the obtained uncalibrated age of 6880 yr BP at the core bottom. 306
The Klg07 core also in the Western High has magnetic susceptibility measurements similar to the core 307
MD2430, and uncalibrated radiocarbon ages of 2500 yr BP at 61 cm depth, 4815 yr BP at 212 cm 308
depth and 7875 yr BP at 297 cm depth compatible with the age model of the MD2430 core (Fig. 14
309
in the appendices; Vidal et al. 2010). The Klg05 and Klg02 cores in the basins can be correlated to 310
the C4 and C8 cores of McHugh et al. (2006). In Klg05, the uncalibrated ages of 1090 yr BP at 48 311
cm depth, 1735 yr BP at 167 cm depth and 2185 yr BP at 250 cm depth agree with the 14C-age of 312
1320 yr BP at 55 cm depth and 1460 yr BP at 65 cm depth in core C4 (Fig. 15 in the appendices; 313
McHugh et al. 2006). The Klg08 core has 14-C ages of 2880 yr BP at 73 cm depth, 4670 yr BP at 314
145 cm depth and 12770 yr BP at 335 cm depth (Fig. 11). 315
The longest records spanning 6000 to 12000 years are reached in the Western High, and on the uplifted 316
side of the NAF in the Tekirda˘g Basin. In the Tekirda˘g and Central Basins, we have a sedimentary 317
record lasting 3000 to 4000 years. 318
5
Interpretation
319
5.1 Variations in sedimentation pattern in the Marmara Sea 320
The correlation of the Klg02 to Klg08 cores across the whole Marmara Sea was done combining gran-321
ulometry, Ca/Ti ratio, Ti, Pb, Br and Sr intensities with the obtained chronological data. Marked 322
geochemical and granulometric variations are used as chronological markers and are tentatively inter-323
preted as global changes in the sedimentation pattern of the Marmara Sea related to anthropogenic 324
disturbances. 325
The cores Klg07 and Klg08 covering the longest time frame show similar Ca/Ti variations (Fig. 8-part 326
a). Based on radiocarbon dating and χ measurements the Klg07 core can also be related to the core 327
MD2430 studied inVidal et al.(2010) (Fig. 14in the appendices). The base of Klg07 is characterized 328
by high χ and was deposited at the end of the glacial period (Fig. 14 in the appendices). Between 2 329
and 3 m depth, deposits in Klg07 characterized by relatively high calcium over titanium ratio corre-330
5.1 Variations in sedimentation pattern in the Marmara Sea
spond to organic-rich deposits occurring from 11.5 kyr BP to 7 kyr BP (C¸ a˘gatay et al., 2000;Vidal
331
et al., 2010). We found a similar high Ca/Ti ratio in Klg08 at 1.6 m. At shallower depths, there 332
is a distinctive thin layer marked by a minimum in Ca/Ti ratio in cores Klg08, Klg07, Klg06 and 333
Klg04 (red layer in Fig. 8-part a). This layer has a particular geochemical signature characterized by 334
an anomalous Rb peak in Klg08, Klg06 and Klg04, associated with high Zr and low Ca intensities. 335
This anomalous marker present from the Tekirda˘g Basin to the C¸ ınarcık Basin is interpreted as a key 336
correlation marker of unknown origin. At shallower depth there is another correlative layer with a 337
high Ca/Ti ratio (yellow upper layer in Fig. 8-part a). In the uppermost part of the core section, the 338
Ca/Ti curves still present high variations that are used to correlate laterally the different cores. 339
Pb, Sr, Br and Ti intensities as well as grain size also show correlative downcore variations. These 340
variations are illustrated in Fig. 8-part b using the core Klg04 in C¸ ınarcık Basin and the cores Klg06 341
and Klg07 in the Western High. The upper part of all granulometric profiles show an upward decrease 342
in clay-sized particles coeval to an increase in silt-sized particles. The grain size increase is coeval with 343
a step increase in lead and titanium. These recent sedimentological changes point to an increase in the 344
allochthonous terrigenous input in the Marmara Sea. Radiocarbon dating indicates that this increase 345
started around 1200 cal yr BC. These changes thus occurred during the so-called Bey¸sehir occupation 346
phase (BOP,Eastwood et al. 1998), which was documented in Lake Manyas along the southern shore 347
of the Marmara Sea (Kazanci et al.,2004). The phase is characterized by forest clearance, crop culti-348
vation and arboriculture (Van Zeist et al.,1975;Bottema and Woldring,1994). These modifications 349
in the vegetation cover have triggered high sedimentation rates in lakes and in the southern shelf of 350
the Marmara Sea (Kazanci et al.,2004). Since that time the anthropogenic activity in the watershed 351
of the Marmara Sea has continuously increased. Istanbul (Byzantium) and other major Roman Cities 352
on the Marmara shores started developing around 600 BC and expanded when Byzantium became the 353
Capital of the Roman Empire in 300 AD. The correlative geochemical and granulometric variations 354
in Fig. 8-part b are interpreted as related to the anthropogenic modifications of Marmara watershed. 355
An additional argument supporting this inference is that the observed changes are traceable in the 356
three basins of the Marmara Sea as well as in the Western High. 357
The correlation of cores Klg02 and Klg05 in deep depocenters with other cores is more difficult due to 358
the occurrence of two thick turbidites layers which distort the signal. The step increase in lead related 359
to the BOP can still be identified in both cores as well as correlable variations in Ca/Ti ratio, Br, Ti, 360
Sr intensities (Fig. 8-part c). 361
The correlable variations of Ca/Ti ratio, Pb , Br, Ti, Sr intensities and granulometry in different cores 362
5.2 Depositional pattern and sedimentation rates in the different basins and high
are used as chronological markers and allow looking at the synchronicity of identified events. The 363
correlation of the different cores based on XRF matching for all the studied cores is presented in Fig. 364
10. This correlation is used to derive the results presented in the following sections. 365
5.2 Depositional pattern and sedimentation rates in the different basins and high 366
The correlation of the Klg cores spanning the two main sedimentary basins of the Marmara Sea and 367
its Western High allows drawing conclusions regarding the depositional pattern. 368
Radiogenic lead data provide a consistent picture of the rate of hemipelagic sedimentation in the east-369
ern and central part of the Marmara Sea. The rates are higher in the basins than on adjacent ridges. 370
The highest value obtained in the Tekirda˘g Basin is consistent with the rapid subsidence of the basin 371
near the fault strand described in Seeber et al. (2004), and with specific locations of the cores Klg05 372
and Klg08 near the basin margins providing continuous terrigenous input. 373
The mean sedimentation rate can also be inferred since the beginning of the Bey¸sehir occupation 374
phase marked by a step increase in lead at 1200 cal. yr BC, 2.85 m and 3 m of cumulated sediments 375
have been deposited in the Tekirda˘g Basin at the location of Klg05 and in the Central Basin at the 376
location of Klg02. The average sedimentation is around 0.09 cm/yr and is dominated by turbiditic 377
deposits representing about 80% of the sediments. The hemipelagic sedimentation rate cannot be 378
extrapolated to obtain meaningful results by removing turbidite thickness. Most turbidites have an 379
erosive base visible in the X-Ray images. Their emplacement in the basins is thus associated with 380
efficient sedimentary remobilization characterized by sea floor erosion and incorporation of a signif-381
icant part of the contemporary sea floor. An extreme case is Klg08 core located at the foot of the 382
Tekirda˘g slope like Klg05 but on the hanging wall of the Tekirda˘g Fault. The hemipelagic rates at the 383
Klg08 and Klg05 sites are similar, but the mean sedimentation rate in Klg08 is more than three time 384
lower than in Klg05. Turbidites are highly erosive at the Klg08 site and are deposited preferentially 385
further north on the down-thrown side of the fault, a local topographic low repeatedly created by 386
earthquake rupture along the Tekirda˘g Fault. A similar conclusion was reached by Beck et al.(2007) 387
in the Central Basin. 388
In the Western High, the mean sedimentation rates of cores Klg06 and Klg07 are three times lower 389
than in the Tekirda˘g Basin during the period characterized by high lead intensities starting respec-390
tively at the depth of 1.2 m and 0.8 m (Fig. 8-part b). This is in agreement with the lower hemipelagic 391
rate and the thin fine-grained turbidites deposits. 392
Finally, the two consecutive thick turbidites recorded both in the Tekirda˘g and the Central Basin 393
5.3 Turbidites triggered by the 1912 historical earthquake
are anomalously large compare to the other turbidites identified and are reminiscent of the homogen-394
ites deposited in the lower (pre-Holocene) lacustrine sequence during a period of high terrigenous 395
accumulation rates on the edges of the Marmara Sea (Beck et al., 2007). The occurrence of these 396
thick turbidites suggests a temporary increase in terrigenous sediment supply that would occur after 397
the Bey¸sehir occupation phase. Once a significant part of the forest cover has been removed and 398
that large scale urbanisation started, erosion and increased sedimentary transport occurred in the 399
Marmara watersheds. Sediment supply to the Marmara shelves thus increased and larger turbidites 400
were deposited. As the watershed adjusted to the changed environment, sediment supply gradually 401
decreased, and thinner turbidites were deposited. These inferences suggest that the thickness of tur-402
bidites in the Marmara Sea is controlled by the amount of cumulated unstable sediments on slopes 403
between earthquakes as well as by the strength of earthquake shaking. 404
5.3 Turbidites triggered by the 1912 historical earthquake 405
The210P bxs data provide a chronology of the most recent sedimentary events and thus, allow charac-406
terizing turbidites triggered by the 1912 M=7.4 M¨urefte earthquake. 407
The rupture associated with the 1912 earthquake was documented onland west of the Marmara Sea 408
(Rockwell et al., 2009; Aksoy et al., 2010) and offshore on the Tekirda˘g Fault (Armijo et al., 2005; 409
Aksoy et al., 2010). Figure 7 indicates that the most recent mass wasting event called e1 recorded 410
in cores Klg02, Klg05, Klg08, Klg06, Klg07 occurs at a depth where 210P b
xs levels reach minimal 411
meaningful values (10 to 20 mBq.g−1). Considering the interface 210P bxs activities of nearby ROV 412
(140 to 170 mBq.g−1), and its half-life of 22.3 years, the low values of 210P bxs just above the level of 413
the most recent mass-wasting event would occur 4-5 half-lives or 80 to 100 years. The most recent 414
turbidites in the Tekirda˘g Basin and in the Western High are thus interpreted to be related to the 415
1912 earthquake. 416
The 1912 turbidite in Klg05 and Klg08 cores has two basal sandy layers, which is a characteristic 417
of turbidites deposited at the Klg05 site in the Tekirda˘g Basin. The earthquake has also left a sedi-418
mentary imprint in the Central Basin, which suggests that the rupture of the Tekirda˘g Segment can 419
generate turbidites in the Central Basin. This implies that the two different depocenters of the Mar-420
mara Sea, which are the Tekirda˘g and the Central Basins, may have the potential to record the same 421
large magnitude earthquake. 422
5.4 Origin of turbidites
5.4 Origin of turbidites 423
The most recent turbidite in the studied cores have been generated by the 1912 earthquake, and one 424
can wonder if other identified turbidites have a seismic origin. Sediment gravity flows can be produced 425
by a wealth of other processes like storm, wave loading, tsunamis, and sediment loading (Adams,1990; 426
Goldfinger et al.,2003b). Seismoturbidites have often particular sedimentological imprints like multiple 427
coarse bases indicating multiple sources (Nakajima and Kanai,2000;Goldfinger et al.,2008), complex 428
laminations (Shiki et al., 2000;McHugh et al., 2011), flaser beds which are tractive current-induced 429
structures that can be related to seiche motion (Beck et al., 2007), erosional contacts, grain-size 430
breaks and abrupt changes in sedimentary structure (Nakajima and Kanai,2000;Shiki et al.,2000). 431
They can also have a particular geochemical imprint (Nakajima and Kanai,2000) with an increase in 432
terrigenous sediment content (McHugh et al.,2011). These criteria are met for all turbidites in Klg05 433
and most in Klg02 (see section 4.2). The two coarser basal pulses observed in majority of turbidites 434
in Klg05 are probably related to flow through separate channels that amalgamate at the site located 435
near the base of the basin slope. However, as stated by Masson et al. (2011) it is difficult based 436
on sedimentological criteria alone to recognise without ambiguity seismically-generated turbidites. 437
Another key test, commonly used in paleoseismology, is to check the synchronicity of the documented 438
events at different sites within a given structural setting (Goldfinger, 2011). In the following, the 439
synchronicity test is applied to the Kullenberg and the published cores. The test relies on the core 440
correlation obtained by using lithological descriptions, χ, XRF, granulometric data, radiocarbon and 441
210P b dating. 442
In the Tekirda˘g Basin, Klg05 was compared to 1) the C8 core (McHugh et al., 2006) located 3 km 443
north, 2) the Klg08 core located 6 km west, 3) the MAR97-02 (Hiscott et al., 2002) located 6.6 km 444
north, and 4) the MD2432 located 6.7 km west (Fig. 1). The 110 cm long C8 core is too short to 445
sample the deep thick turbidites, nevertheless there is still a tie between the cores (Fig. 15 in the 446
appendices). The comparison between Klg05 and Klg08 is not straightforward because of the highly 447
compressed sedimentary record of Klg08 (Fig. 11 and 15 in appendices), but there is still a clear 448
correspondence between event 4 (56 cm) in Klg08 and event 4 (100 cm) in Klg05 and between event 2 449
(41 cm) in Klg08 and event 2 (48 cm) in Klg05 (Fig. 15). At greater depth, the two main amalgamated 450
turbidites around 70 cm depth in the core Klg08 correspond to the two largest turbidites (events 5 451
and 6) in Klg05. They show multiple pulses and erosional cut-outs that suggest seismic triggering 452
(Nakajima and Kanai,2000;Shiki et al.,2000). Due to the lack of high resolution data the comparison 453
with MAR97-02 core (Hiscott and Aksu, 2002) is difficult. Nonetheless this core, located 6.5 km to 454
5.4 Origin of turbidites
the north (Fig. 1), presents two coarser intervals at 70-110 cm and 140-185 cm depths that could 455
correspond to the two large events e5 and e6 documented in Klg05 (Fig.15 in the appendices). In 456
addition, radiocarbon ages dating are identical for the e5 turbidite and for the coarser layer at 70-110 457
cm in the MAR97-02. Finally, the MD2432 core can be correlated to the Klg05 core based on the χ 458
measurement. Density data also indicate turbiditic events that would correspond to events 3 to 6 in 459
Klg05. 460
In the Western High, fine-grained turbidites recorded in cores Klg06 and Klg07, 15 km apart, can be 461
easily related because they have similar geochemical profiles (Fig. 8). In both cores, almost a one-to-462
one correspondence between turbidites is recorded. The two largest turbidites e5 and e8-e7 in Klg06 463
and Klg07 are correlative and are marked by a distinctive strong terrigenous signature in sand, Zr, χ 464
(Figs. 6and 15). Silty turbidites in the Western High are dissimilar to the slump-induced turbidites 465
present in the Tekirda˘g and Central Basins, but they can have a common seismic origin. Indeed, M >7 466
earthquakes on the Tekirda˘g Segment can trigger sandy turbidity currents in the basin and a muddy 467
suspension cloud, which would deposit a very fine-grained distal turbidite layer in the High (Inouchi
468
et al., 1996; Shiki et al., 2000). So our final test is to look if sandy turbidites in the Tekirda˘g Basin 469
are synchronous with silty turbidites in the Western High (Fig. 10). The XRF correlation implies 470
that the two largest turbidites e5 and e6 in Klg05 correspond to the distinctive distal turbidites e5 471
and e8-e7 in Klg06 and in Klg07 on the Western High marked by sand, Zr, χ peaks. Furthermore, a 472
similar number of turbidites are identified in cores above the time horizon underlined in red in Fig.10. 473
Both observations suggest synchronicity of the turbidites in Tekirda˘g and in the Western High. The 474
suspension cloud responsible for the fine-grained turbidites must be at least 400 m thick as the Klg06 475
site is about 400 m higher than the Klg05 site. Shiki et al.(2000) state that the plumes associated to 476
earthquake triggered turbidites are higher and thicker that the usual suspension clouds derived from 477
canyon flow turbidity currents. Furthermore McHugh et al. (2011) detected an unusual 600 m thick 478
sediments plume still present almost 2 months after the M=7.0 Ha¨ıti earthquake. The occurrence 479
of distal turbidites and their correlation with basinal proximal turbidites suggests that both types of 480
turbidites have been uniquely generated by earthquake shaking in the Tekirda˘g Basin and not by some 481
other natural phenomenon. 482
In the Central Basin, the Klg02 core is compared to core C4 (McHugh et al., 2006) and to core 483
MD2429 (Beck et al.,2007). The two largest turbidites e3 and e4 recorded in Klg02 were documented 484
at the same depth in the core C4 ofMcHugh et al. (2006) (Fig. 1). Additionally, two deeper organic 485
rich layers in C4 can be correlated with the e6 and e7 events of Klg02 (Fig. 15). In the nearby core 486
6 Paleoseismological implications
MD2429 the magnetic susceptibility record of the first 6 metres (Beck et al.,2007) is identical to the 487
magnetic susceptibility data of the Klg02 core with two peaks framing low values (Fig. 15). These 488
two peaks correspond to the two main sandy layers forming the base of events e3 and e4. The relative 489
low values match with the main body of the second homogenite (Fig. 5). The density data of MD2429 490
core allows identifying other major turbidites in the cores which corresponds to events 5, 6 and 7 in 491
Klg05. Turbidites in the Central Basin have thus significant lateral extension. We infer that they also 492
have a seismic trigger. 493
6
Paleoseismological implications
494
The sedimentary cores studied provide a paleoseismological record of the Tekirda˘g Fault ruptures. 495
The 1912 M¨urefte earthquake (event 1) is recorded in the Tekirda˘g Basin and in the Western High as 496
well as in Central Basin where it has a faint expression. Considering the 14C age of 2185 yr BP below 497
event 6 in Klg05 with the reservoir correction of 340-460 years proposed byMcHugh et al.(2006), the 498
mean recurrence time of events along the Tekirda˘g Fault would be about 300 years. Combining all 499
radiocarbon ages dating obtained in cores from the Tekirda˘g Basin and an average reservoir correction 500
of 450 years, we can propose the following possible match between sedimentary events and historical 501
earthquakes (Ambraseys,2002): events 2 to 5 could correspond, respectively, to events occurring in 502
1766, 1354 or 1343, 1063, 557 and 437. The obtained paleoseismological record might not be complete. 503
The triggering of seismoturbidites also depends on the availability and volume of unstable sediments 504
that accumulate on the basin slopes. 505
The inner Central Basin (Klg02) located between the Tekirda˘g and the Central Faults (Fig. 1) can 506
also record mass-wasting events synchronous with the Tekirda˘g Basin. The first example is the 1912 507
disturbances triggered by the rupture of the Tekirda˘g Fault. An other example is the top turbidite 508
in the Central Basin (event 3-Klg02) which seems synchronous with the shallowest turbidite in the 509
Tekirda˘g Basin (event 5-Klg05; Figs. 8 and 10). The latter implies massive slope failures both in 510
Tekirda˘g and Central Basins. It might have been triggered by the Tekirda˘g fault rupture alone, but 511
was most probably triggered by the quasi-synchronous rupture of the Tekirda˘g and Central Faults. 512
Such rupture scenario may have happened during the M= 7.1 May 1766 and M=7.4 August 1766 513
earthquake sequence as modelled in Pondard et al.(2007). 514
Another noticeable paleoseismological result is the relatively low number of turbiditic events recorded 515
in the Central Basin, which could record earthquakes rupturing the Tekirda˘g and Central Segments. 516
It might be a site effect as the Klg02 core is situated 14 km away from the basins slopes and only 517
6 Paleoseismological implications
large mass wasting events can be recorded. In addition, even if sediment supply on the shelf and slope 518
of the Central Basin is similar to the Tekirda˘g Basin, there might not be enough sediments available 519
to trigger turbiditic mass flow in the inner basin each time there is a M>7 earthquake on the Central 520
or Tekirda˘g Faults. An other possible explanation would be frequent ruptures of the Central and 521
Tekirda˘g Segments in sequence or as a single through-going rupture. In these cases, we would have 522
indistinguishable coeval turbiditic deposits in both basins. The last possibility would be a less frequent 523
earthquake rupture of the Central Segment that would be related to partial creep along that specific 524
segment. Partial creep would mean lower recurrence rate and maximum magnitude on the Central 525
Segment than on the other NAF Segments. More sedimentary records from the Central Basin are 526
needed to resolve that key question, which have fundamental consequences on earthquake recurrence 527
rate and earthquake magnitude. 528
529
Conclusions
530The combination of X-ray imagery, XRF scanning and high-resolution granulometric measurements 531
performed on five cores has documented the cyclic occurrence of instantaneous sedimentary events 532
deposited in the Marmara Sea as well as global sedimentation changes that can be used to relate the 533
different records. Radiocarbon age dating suggests that about eight major turbiditic events occurred 534
in the Tekirda˘g Basin and seven in the Central Basin in the last 2500 years. 535
Turbiditic events appear to be reliable paleoseismological indicators of ruptures of the Tekirda˘g Fault. 536
This interpretation is first based on (1) specific XRF and grain size characteristics, (2) synchronicity 537
of turbiditic events identified in different cores and (3) correlative proximal sandy turbidites in the 538
basins with distal fine-grained turbidites in the high. The most straightforward triggering mechanism 539
for coeval distal and proximal events is shaking induced by earthquakes breaking the Tekirda˘g Segment 540
of the North Anatolian Fault. The relatively low number of turbidites documented in the Central Basin 541
compared to the Tekirda˘g Basin might be linked to ruptures in close sequence on the Tekirda˘g and 542
Central Segments like in 1766 (Pondard et al.,2007) or to creeping along the Central Segment. A link 543
is also proposed between the first observed sedimentary event and the M=7.4 1912 M¨urefte earthquake. 544
This earthquake that last activated the Tekirda˘g Fault left a distinct imprint in all cores. Finally, 545
more effort must be achieved to obtain reliable age model of the sedimentary cores, which would allow 546
a better understanding of the seismic cycle of the different NAF Segments crossing the Marmara Sea. 547
6 Paleoseismological implications
Acknowledgements 548
We first would like to thank reviewers R. Hiscott, N. C¸ a˘gatay and the two other anonymous reviewers 549
for their in depth comments, which improve very significantly the paper. We also thank Rolando 550
Armijo who was the scientific director of the Marmarascarps Marine campaign in 2002 from which the 551
studied cores were collected. We acknowledge Jean-Luc Schneider for his valuable help in core logging. 552
We are grateful to Isabelle Billy, Jo¨el Saint-Paul and Olivier Ther for core sampling, realisation of X-553
ray scanner imagery, XRF data preparation and acquisition as well as Elisabeth Michel and Elisabeth 554
Tellier for their help on foraminifers extraction. Radiocarbon dating was supported by the CNRS-555
INSU Artemis program and done in the Artemis LMC14 laboratory. The program CNRS/FRS-FNRS 556
CGRI supported granulometric data acquisition in Li`ege (Belgium) and the ENS, UMR8538 provides 557
additional financial support for data acquisition. Finally, we would like to thank Christian Beck for 558
the fruitful discussions. 559
Figures
5606 Paleoseismological implications re 1: G e n e ral con text of the Marmara S e a c ros se s b y the Nor th An atolian F ault (NAF ). Main stru c tu res are lab elled in b lu e . Glob al te cton ic te x t of the An atolian P late is in c lu ded as in set w ith GP S v e lo c it ie s from Re ilin ge r et al . ( 2006 ), with a red b o x in di c atin g the lo c ati on of Fig. 1.
6 Paleoseismological implications
Figure 2: Typical examples of turbidites: granulometric and geochemical signatures as described in Sec.4. Turbidites are composed of a basal sandy layer, an upper silty unit with frequent laminations and a top light grey clayey unit. A : X-ray imagery and granulometry zooms of event 7 in Klg05. Yellow label on the X-ray indicates the position of the event as in Fig. 4. B : X-ray imagery, granulometry and geochemical profiles of event 1 in Klg05. Turbidites can have a positive signature in Zirconium (pink curve), negative in bromine (green curve) and just below turbidites Manganese (blue curve) typically shows a peak. Yellow names indicate events as referenced in Fig.4.
6 Paleoseismological implications
Figure 3: Characteristics of the thickest turbidites in Klg02 and Klg05 cores by using X-ray, log, grain size and geochemical parameters.
6 Paleoseismological implications Figu re 4: St ratigr aphi c log of the K lg05 core in the T e ki rda˘ g Bas in ob tain e d com b ini ng X-ra y imagery , grai n size, magnetic susc epti bil it y d ata, Mn and Zr stand ard iz ed in tensities . On the le ft, zo om pi c tu res of the tw o b as al la y e rs of the th ic k es t turb idi te s with gra v e l are p res en ted. Main tur bid ites dep os it e d are id e n tified and lab e ll e d ; ev en t lab el is changi ng accordi ng to their str atigrap hic p os ition, b egin nin g with 1 at the top of the c or e . In bl ac k is re pr e se n te d the sand y d ark la y e r, in grey the in terme d iate silt y la y e r, in ligh t gr e y th e up p er c la y -r ic h la y er and in wh ite th e bac k groun d se d im en tati on.
6 Paleoseismological implications re 5: St ratigr aphi c log of the Klg02 c ore in th e Cen tral B asin obtai ned com b ini ng X-ra y im agery , grai n siz e, magnetic su sceptib ilit y data, M n an d stand ardi z ed in te n si tie s. On the left, z o om in the X-ra y of th e b as al la y ers of th e th ic k es t turb idi te e3 with com p lex laminat ions. Mai n tur bid ites os it e d are id e n tified and lab e ll e d ; ev en t lab el is changi ng accordi ng to their str atigrap hic p os ition, b egin nin g with 1 at the top of the c or e . In ac k is re pr e se n te d the sand y d ark la y e r, in grey the in terme d iate silt y la y e r, in ligh t gr e y th e up p er c la y -r ic h la y er and in wh ite th e bac k groun d d im en tati on.
6 Paleoseismological implications
Figure 6: Stratigraphic log for the first 80 cm of the klg06 and Klg07 cores situated in the Western High Ridge obtained combining X-ray imagery, grain size, magnetic susceptibility data, Mn and Ti/Al or Zr standardized intensities. Main events deposited are identified and labelled; event label is changing according to their stratigraphic position, beginning with 1 at the top of the core. The complete
6 Paleoseismological implications re 7: Exce ss 21 0 P b activiti e s (b lac k dots) an d comput e d sedi m en tation rate s of the cores K lg02, Klg05, Kl g06, Klg07 an d Klg08. W hite d ots are om the nearb y R O V core s and sh o w that n o sign ifican t los t of sedimen ts o c cur red in Klg cores . Th e extend of the mixed la y er is ind icate d in b lu e . y image ry ass o c iated to the m ean grain size (b lac k li nes ) sh o w th e lo cation of th e e1 se d ime n tary e v en t ind uce d b y the M =7.4 1912 earth qu ak e . age m o del d e riv ed from 21 0P bxs at the top of the 1912 tu rb idi te s is in dicate d in gree n . T h e ev e n t e1 h a v e the follo win g characteristics . Klg05, e 1 is mark ed b y tw o basal san dy la y e rs at 13 an d 21 cm d e p th su gge stin g tw o d istinct m ass flo ws. The thic k e st upp er one is visible b y e y es as so ciated with a sign ifican t in c re ase in z irconiu m an d tit aniu m con ten t (Fi g. 4 ). In Kl g08 c or e sim ilar sand y la y e rs an d geo ch e mical sign atur e s observ e d at 18 cm and 23 c m d e p th. In Klg07, the e v en t is mark ed at 10-11 cm b y a small sand y p e ak, a step increas e in sil t and an incre ase in XRF. In Kl g06, there is a similar ste p increas e in sil t asso c iate d to a dip pi ng w h ite line in the X-ra y .
6 Paleoseismological implications Figu re 8: Corr e lat ion of di ff eren t c or e s b as ed on XRF and gran u lom etri c data. All basal san dy la y e rs ha v e b ee n re mo v e d . a : Ca/T i ratio profi les for core s Klg08 (re d c u rv e), Klg07 (b ro wn curv e), Kl g06 (blu e cur v e ) an d Kl g04 (gree n c u rv e). Un c al ibr ate d 14C y r BP are in dicated on th e le ft of th e pr ofiles (T able 2 ). Dashed b lac k lines repr e se n t c or re lativ e h ighs or lo ws . b Pr ofiles from le ft to righ t of c la y-siz ed p articles an d of th e stand ardi z ed XRF d ata for Pb , Br, T i and Sr for c ores Klg04 (gr e en cur v e ), Klg06 (b lu e cur v e ) an d K lg07 (p ink c u rv e ). B ol d oran ge lines repres en t corr e lat iv e hi ghs or lo ws . c Pr ofiles of the stand ardi z ed XRF d ata with from the left to th e righ t Pb , B r and C a/Ti ratio for the c or e s Klg02 (y ello w c u rv es ), Klg05 (pu rpl e c u rv e s) an d Klg06 (b lue cur v e s). Bold red lin e s repr e se n t k e y p oin ts of c or relation . P ink rec tan gles indi c ate th e lo cation of th e top fin e grai ned of the larges t tu rbi dites in Klg05 and Kl g02.
6 Paleoseismological implications re 9: C or e c or re lation b et w ee n Kl g06 and Kl g07 usin g X-ra y , m agn e tic su sce p tibi lit y, b romine an d K /Sr ratio. In c rease S r at the b as e of tur bid ites ts allo ch thon ous inp ut. In opp osition , increas e in K migh t re fl e ct high e r illite c on te n t in the up p er cla y e y silt subl a y er. Lo calisation of the cores ind ic ated on th e in set m ap .
6 Paleoseismological implications
Figure 10: Correlation obtained from XRF data (Fig. 8) for the cores Klg08, Klg05, Klg06, Klg07 and Klg02. Lines between cores represent the correlative sedimentary events identified in Figs. 4, 5, 9. Uncalibrated radiocarbon ages (not calibrated) for shells (in red), planktonic foraminifers (in purple), benthic foraminifers (in light rose) are presented in Table 2. The radiocarbon ages in green are from
6 Paleoseismological implications T ab le 1: Lo cation of Ku llen b e rg cores c ol le cted du rin g th e Mar m ascarps m ission in 2002 Basin Cor e Latit u de ( ◦ N) Longitude ( ◦ E) W ater depth (m) Cor e length ( cm) T ekird a˘ g klg05 40 ◦ 48,50 27 ◦ 37,3 1123 341 T ekird a˘ g klg08 40 ◦ 47,31 27 ◦ 33,22 1111 385 W e ste rn High Rid ge klg06 40 ◦ 48,90 27 ◦ 44,28 726 371 W e ste rn High Rid ge klg07 40 ◦ 49,115 27 ◦ 54,44 1065 432 Ce n tral klg02 40 ◦ 50,28 28 ◦ 00,54 1266 403
6 Paleoseismological implications
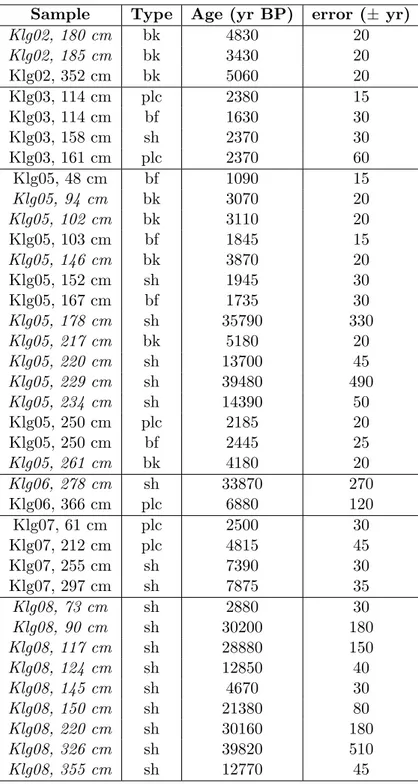
Table 2: AMS Radiocarbon dating results performed on bivalve shell fragments (sh), bulk sediment (TOC+TIC) (bk), benthic (bf) and planktonic (plc) foraminifers. Sample name written in italic are samples considered to be reworked and were not used for the interpretations. Analyses were performed at Artemis LMC14 laboratory and AEON laboratories; 14C dating have not been calibrated and corrected for reservoir effect.
Sample Type Age (yr BP) error (± yr)
Klg02, 180 cm bk 4830 20 Klg02, 185 cm bk 3430 20 Klg02, 352 cm bk 5060 20 Klg03, 114 cm plc 2380 15 Klg03, 114 cm bf 1630 30 Klg03, 158 cm sh 2370 30 Klg03, 161 cm plc 2370 60 Klg05, 48 cm bf 1090 15 Klg05, 94 cm bk 3070 20 Klg05, 102 cm bk 3110 20 Klg05, 103 cm bf 1845 15 Klg05, 146 cm bk 3870 20 Klg05, 152 cm sh 1945 30 Klg05, 167 cm bf 1735 30 Klg05, 178 cm sh 35790 330 Klg05, 217 cm bk 5180 20 Klg05, 220 cm sh 13700 45 Klg05, 229 cm sh 39480 490 Klg05, 234 cm sh 14390 50 Klg05, 250 cm plc 2185 20 Klg05, 250 cm bf 2445 25 Klg05, 261 cm bk 4180 20 Klg06, 278 cm sh 33870 270 Klg06, 366 cm plc 6880 120 Klg07, 61 cm plc 2500 30 Klg07, 212 cm plc 4815 45 Klg07, 255 cm sh 7390 30 Klg07, 297 cm sh 7875 35 Klg08, 73 cm sh 2880 30 Klg08, 90 cm sh 30200 180 Klg08, 117 cm sh 28880 150 Klg08, 124 cm sh 12850 40 Klg08, 145 cm sh 4670 30 Klg08, 150 cm sh 21380 80 Klg08, 220 cm sh 30160 180 Klg08, 326 cm sh 39820 510 Klg08, 355 cm sh 12770 45
6 Paleoseismological implications
appendix
5616 Paleoseismological implications Figu re 11: St ratigr aphi c log for the fir st 1.5 m of the klg08 core situ ate d in th e T ekir da˘ g Bas in obtain e d c om bin in g X-ra y imagery , grain size, m agn e tic susc eptib ili ty d ata, Mn an d Zr stan dar dize d in tensities . Mai n e v en ts d e p osite d are id e n tified and lab elled.
6 Paleoseismological implications re 12: Str atigrap hic log of th e k lg06 c or e si tuated in the W es te rn High ob tain e d com b ini ng X-ra y image ry , gr ain size , magnetic su sce p tib ilit y a, M n and Zr stand ard iz ed in te n sit ie s. Main ev e n ts dep os it e d ar e iden ti fied and lab elled.
6 Paleoseismological implications Figu re 13: Str atigrap hic log of th e k lg07 c or e si tuated in the W es te rn High ob tain e d com b ini ng X-ra y image ry , gr ain size , magnetic su sce p tib ilit y dat a, M n and Zr stan dard ize d in te n sit ie s. Main ev e n ts dep osited are id e n tified and lab e lle d ; e v en t lab e l is ch angi ng accordi ng to their stratigr aph ic p os it ion, b e gi nni ng with 1 at the top of the core.
6 Paleoseismological implications re 14: C or e correlati on b e tw e en K lg07 and MD2430 ( Vid al et al. , 2010 ) in th e W e stern Hi gh b y using magn e tic susc epti bili ty data an d Ca/Ti o. Red dashed li ne in di c ate k ey p oin t of c or relation . Un c al ibr ate d ages ar e ind icate d in red and calib rated ones in b lac k .
6 Paleoseismological implications Figu re 15: Cor e correlation b et w ee n Klg02 and Klg05 and already p ubl is h e cores in the C en tr al and T ekir da˘ g Bas in s. A : Correlati on in th e T ekir da˘ g Bas in b e tw e en th e c ores Klg05, MD2432, C8 ( McHugh e t al. , 2006 ) an d M AR 97-02 ( Hisc ott e t al . , 2002 ) b y using log and ph ys ic al parame te rs. Uncalib rated age s are in dicated for all th e c or e s an d k e y p oin ts of corr e lat ion are re p re sen te d wit h blu e dashed lin e s. A : Correlation in the CE n tral Bas in b e tw e en the c or e s Kl g02, M D2429 ( Be ck et al. , 2007 ) an d C4 ( McHugh et al. , 2006 ) b y usin g log an d ph ysical p arame ters. Un c ali brat e d age s are ind ic at e d for all the c ores an d k e y p oin ts of c or relation ar e represe n ted with b lue dashed lin e s.
REFERENCES
References
562Abrajano, T., Aksu, A., Hiscott, R., and Mudie, P.: Aspects of carbon isotope biogeochemistry of late 563
Quaternary sediments from the Marmara Sea and Black Sea, Marine Geology, 190, 2002. 564
Adams, J.: Paleoseismicity of the Cascadia Subduction Zone - Evidence from Turbidites off the 565
Oregon-Washington Margin, Tectonics, 9, 1990. 566
Aksoy, M., Meghraoui, M., Vall´ee, M., and C¸ akır, Z.: Rupture characteristics of the AD 1912 M¨urefte 567
(Ganos) earthquake segment of the North Anatolian fault (western Turkey), Geology, 38, 991, 2010. 568
Ambraseys, N.: The seismic activity of the Marmara Sea region over the last 2000 years, Bulletin of 569
the Seismological Society of America, 92, 2002. 570
Armijo, R., Meyer, B., Hubert, A., and Barka, A.: Westward propagation of the North Anatolian 571
fault into the northern Aegean: Timing and kinematics, Geology, 27, 267, 1999. 572
Armijo, R., Meyer, B., Navarro, S., King, G., and Barka, A.: Asymmetric slip partitioning in the Sea 573
of Marmara pull-apart: a clue to propagation processes of the North Anatolian Fault?, Terra Nova, 574
14, 80–86, 2002. 575
Armijo, R., Pondard, N., Meyer, B., U¸carku¸s, G., de Lepinay, B., Malavieille, J., Dominguez, S., 576
Gutscher, M., Schmidt, S., Beck, C., C¸ a˘gatay, N., Cakir, Z., Imren, C., Eri¸s, K., Natalin, B., 577
Ozalaybey, S., Tolun, L., Lefevre, I., Seeber, L., Gasperini, L., Rangin, C., Emre, O., and Sarikavak, 578
K.: Submarine fault scarps in the Sea of Marmara pull-apart (North Anatolian Fault): Implications 579
for seismic hazard in Istanbul, Geochemistry Geophysics Geosystems, 6, 2005. 580
Bahr, A., Lamy, F., Arz, H., Kuhlmann, H., and Wefer, G.: Late glacial to Holocene climate and 581
sedimentation history in the NW Black Sea, Marine Geology, 214, 309–322, 2005. 582
Barka, A. A. and Kadinsky-Cade, K.: Strike-slip fault geometry in Turkey and its influence on earth-583
quake activity, Tectonics, 7, 663–684, 1988. 584
B´ecel, A., Laigle, M., de Voogd, B., Hirn, A., Taymaz, T., Galv´e, A., Shimamura, H., Murai, Y., 585
L´epine, J., Sapin, M., et al.: Moho, crustal architecture and deep deformation under the North 586
Marmara Trough, from the SEISMARMARA Leg 1 offshore-onshore reflection-refraction survey, 587
Tectonophysics, 467, 1–21, 2009. 588
REFERENCES
Beck, C., de L´epinay, B. M., Schneider, J., Cremer, M., C¸ a˘gatay, N., Wendenbaum, E., Boutareaud, 589
S., M´enot, G., Schmidt, S., Weber, O., Eris, K., Armijo, R., Meyer, B., Pondard, N., Gutscher, M., 590
the Marmacore cruise party, Turon, J., Labeyrie, L., Cortijo, E., Gallet, Y., Bouquerel, H., Gorur, 591
N., Gervais, A., Castera, M., Londeix, L., de Ress´eguier, A., and Jaouen, A.: Late Quaternary 592
co-seismic sedimentation in the Sea of Marmara’s deep basins, Sedimentary Geology, 199, 2007. 593
Bertrand, S., Charlet, F., Chapron, E., Fagel, N., and De Batist, M.: Reconstruction of the Holocene 594
seismotectonic activity of the Southern Andes from seismites recorded in Lago Icalma, Chile, 39 S, 595
Palaeogeography, Palaeoclimatology, Palaeoecology, 259, 301–322, 2008. 596
Bottema, S. and Woldring, H.: Bronze Age and Byzantine pollen of the Kestel tin-mine (Turkey) and 597
its possible origin: practical and experimental pollen analysis in archaeological context, Aspects 598
of archaeological palynology: methodology and applications. AASP Contributions Series, 29, 7–15, 599
1994. 600
Butler, R.: Paleomagnetism: magnetic domains to geologic terranes, Blackwell Scientific Publications 601
Boston, MA, 1992. 602
Carton, H., Singh, S. C., Hirn, A., Bazin, S., de Voogd, B., Vigner, A., Ricolleau, A., Cetin, S., 603
Ocakoglu, N., Karakoc, F., and Sevilgen, V.: Seismic imaging of the three-dimensional architecture 604
of the Cinarcik Basin along the North Anatolian Fault, Journal of Geophysical Research-Solid Earth, 605
112, 2007. 606
C¸ a˘gatay, M., G¨or¨ur, N., Algan, O., Eastoe, C., Tchapalyga, A., Ongan, D., Kuhn, T., and Ku¸scu, I.: 607
Late Glacial-Holocene palaeoceanography of the Sea of Marmara: timing of connections with the 608
Mediterranean and the Black Seas, Marine Geology, 167, 2000. 609
Dolan, J., Christofferson, S., and Shaw, J.: Recognition of paleoearthquakes on the Puente Hills blind 610
thrust fault, California, Science, 300, 115, 2003. 611
Eastwood, W., Roberts, N., and Lamb, H.: Palaeoecological and archaeological evidence for human 612
occupance in southwest Turkey: the Bey¸sehir occupation phase, Anatolian studies, 48, 69–86, 1998. 613
Eris, K. K., Ryan, W. B. F., Cagatay, M. N., Sancar, U., Lericolais, G., Menot, G., and Bard, E.: 614
The timing and evolution of the post-glacial transgression across the Sea of Marmara shelf south of 615
Istanbul, Marine Geology, 243, 2007. 616
Folk, R.: Petrology of sedimentary rocks, Hemphill’s Austin, Texas, 1968. 617