District heating and energy indicators: a method to assess the link between
urban planning characteristics and energy efficiency of district heating
networks
P.E. Pacot1, S.Reiter1 1
Local Environment: Management & Analysis (LEMA), University of Liège, Liège, Belgium
ABSTRACT
District heating networks are very common energy systems all over the world but only few studies have been carried out to assess their performances through quality indicators. Moreover, the only energy indicator generally used is the primary energy factor (PEF), which quantifies the primary energy use of a device. However it does not give a complete insight of the whole energy use of district heating networks. In this paper, three other energy indicators are defined to enhance their energy analysis. The use of these energy indicators is highlighted by an application on a specific heating district network and by a sensitivity analysis. Finally, a methodology to assess the link between urban characteristics and energy district heating performance is proposed, based on the developed energy indicators.
KEYWORDS
District heating, energy indicators, building stock, building modelling, key performance indicators
INTRODUCTION
Although the district heating networks have been used as dwellings heating systems for millions of people in the world for many years, European engineers and stakeholders are once again focusing on this kind of energy medium. This upsurge in Europe is partly due to the objective of the 3x20: by 2020, Europe bid to achieve a 20% reduction in its greenhouse gas emissions, a 20% increase of the energy plant effectiveness and a 20% share of renewable energy sources in its energy bouquet (European commission 2010). District heating networks represent a great opportunity to carry out these objectives for large building stocks because they allow a wide range of energy sources for buildings heating including renewable energy sources. These sources can be geothermal energy (Yildirim et al. 2010), Combined Heat and Power Plants (Casisi et al. 2009), industrial waste heat (Ajah et al. 2007), biomass (Valios et al. 2009), etc... However despite the good knowledge we have over these networks, there is no method to optimize their design although they induce consequent investments and are not common at all in some European countries, like Belgium.
Only few studies have been carried out to assess heating district networks performances through quality indicators. First, a project lead by Euroheat&Power and finished in 2006 proposed guidelines to assess the performance of a district heating network (Werner 2006). They proposed an assessment based on only one parameter that was the primary energy factor which translates the use in primary energy made by a network in order to provide heat to the consumers. One year after this project, the European norm CEN(2007) proposed to use this parameter to manage a district heating or its design. But this indicator does not give a complete insight of the whole energy use of district heating networks.
Other quality parameters have been proposed to assess the performances of a district heating network by the French associations IGD and AMF (2009). They proposed 23 parameters divided in six different fields:
1. Ensure the customers’ heating and cooling demands
2. Maintain a sustainable living and natural environment and ensure safety 3. Ensure the sustainability of the heat supply
4. Meet the customers service expectations 5. Manage billing service
6. Manage the relationships between the different actors
These fields are important issues in order to develop a good district heating network. However, all the proposed parameters cannot be stated at the design stage. Moreover, the only energy indicator used in this method is the primary energy factor (PEF), previously defined. van Lier (2010) has developed a methodology related to a specific district heating. In 2007, the public administration of Purmerend decided to stop the management of its district heating. A new company was created in order to manage this district heating. They found a lot of problems and defined six indicators in order to improve the management of this network: Heat loss, Water replenishment, Avoided CO2 emissions, unplanned repairs, networks degradation and Off-time replacement. Some of these indicators are close to those defined by IGD and AMF or express the same issues but neglect the energy point of view. Moreover, these indicators have been developed to improve the management of old district heating networks and not to help investment decisions in new or old district heating networks.
This paper will define four key energy indicators for the energy design optimization of heating district networks. The use of these energy indicators will be highlighted by an application on a specific heating district network and by a sensitivity analysis. Finally, a methodology to assess the link between urban characteristics and energy district heating performance will be proposed, based on the developed energy indicators.
DEFINITION OF QUALIY INDICATORS RELATED TO ENERGY USE
The purpose of the energy indicators developed in this paper is to give a very complete energetic overview of a district heating network for decision makers, project engineers, etc...
The primary energy factor, PEF
The first indicator, which is already widely used, is the primary energy factor (CEN 2007; Werner 2006). It quantifies the primary energy use of a district heating network. Its definition is given by equation (1). del el p CHP el p aux j j p j DH p E f E f E f E f , , , , ⋅ − ⋅ + ⋅ =
∑
(1)where Ej is the amount of the jth primary energy consumed by the network, Eaux is the amount of electricity needed to deliver power and heat to the consumers (e.g. pump consumption, lighting of the heat plant, ...), ECHP is the amount of electricity provided by the combined heat and power plant (CHP) if any is installed, fp,j is the primary energy factor related to an energy source, fp,el is the primary energy factor for the power plants and Edel is the amount of energy delivered to the consumers.
This is a major factor allowing people to compare in an efficient manner two heating technologies e.g. district heating network and conventional boiler. But this indicator is not enough to assess the whole energy use of district heating networks. The value of this parameter can be negative if a large CHP plant has been installed and can also hide the effects of the use of fossil fuels or great amounts of heat loss. These two statements led us to define three new energy parameters in order to add complementary information on their energy performances.
The relative importance of losses, RiL
A first important piece of information is the amount of heat loss consumed by the network. These energies are compared to heat delivered to the consumers as shown in equation (2).
Electricity from CHP plants is not considered because the district heating main issue is to provide heat to consumer and not to generate electricity.
del aux loss E E E RiL= + (2)
Where Eloss is the amount of energy lost in the district heating e.g. thermal loss through pipes, water replenishment, etc ... It can be stated by measuring energy leaving the heat plant and subtracting the sum of the energy at the consumer’s substations.
The primary energy efficiency
As Ril does not take into account electricity delivered to the power grid by CHP plants, a third parameter is set. It compares all the net delivered energy (e.g. thermal to the district heating network and electric to the power grid) to the primary energy use and is given to equation (3) here after. Delivered Energies are thus no more weighted and electric production does not reduce primary energy consumption (as it does in PEF).
∑
⋅ − + = j j p j aux CHP del DH f E E E E ,ε
(3)In the cases where no CHP plant is installed, this indicator is equal to the inverse primary energy factor. This parameter will be influenced mainly by the kind of used energy sources, their amount of energy and the networks losses. Finally, it shows how primary energy is transformed through a district heating network.
The district heating global efficiency
Finally, a fourth parameter is defined as a general efficiency: the ratio between all provided energies and all the necessary energies. This parameter is very close to the general definition of efficiency as shown by its definition given in equation (4).
∑
+ + = j aux j CHP del DH E E E Eη
(4)This global efficiency is defined to compare networks from a technical point of view because it will be affected by efficiencies of the network and the power plants. It also allows the comparisons of different heating systems for buildings e.g. the networks and a heat pump.
APPLICATION OF THESE ENERGY INDICATORS AND DISCUSSION
The defined four energy indicators will be highlighted by an application on a specific heating district network and by a sensitivity analysis. First general data are used from literature. These data cover district heating energy use and come from the paper written by Olsen et al (2008). The most relevant data are summed up in Table 1. In this case study, energy is delivered to a 92 houses district heating network.
Table 1. Energy consumption of the district heating presented in Olsen et al.(2008) Heat consumption per house, [kWh] 6750
Heat consumption of the total network, [kWh] 621000 Heat delivered to the total network, [kWh] 721105 Electricity consumption for pumping total network 4768
As these data do not include information over heat generation, two heat plants are then defined: a CHP plant and a conventional boiler. The CHP plant is designed on basis of the houses yearly thermal energy consumptions. Each consumer is considered to use energy at the
same time. The indicators value stated in the designed case (considered as the reference) are shown in Table 2.
As some assumptions about energy systems characteristics are made, a sensitivity analysis is conducted. Four cases are defined to compare several scenarios of increasing or even decreasing energy efficiency:
- A 60% of thermal energy share from CHP
- A decrease of the heat generator efficiency from 80% to 60% - A 20% decrease of delivered heat to the network
- Modifications of the share of renewable energy and their characteristics
The relative impacts of the three first scenarios on the four energy indicators developed are summed up in Table 2. Solutions to enhance district heating are deduced from the cases. Table 2.Modifications of the indicators in three cases
Case fp,DH [-] εDH [-] ηDH [%] RiL [%]
Reference 1.38 0.66 0.73 0.12
60% of thermal energy from CHP 1.1 0.7 0.78 0.12 60% of heat generator efficiency 1.65 0.56 0.62 0.12 20% decrease in delivered heat 1.63 0.57 0.63 0.40 First, the table 2 shows that the use of CHP plant has a high positive effect on all the indicators except for the RiL as far as network effectiveness is not modified. This is thus a first possible enhancement of a network.
Second, RiL is the most suitable parameter to identify the district heating effectiveness. In old networks, it is a key management parameter allowing to quantify network losses.
Third, heat generator efficiency and network energy losses show similar effects on the parameters (PEF, Primary energy efficiency and global efficiency). In this case, the two solutions lead to same effects from an energetic point of view. Investment decision has to be made regarding investment cost.
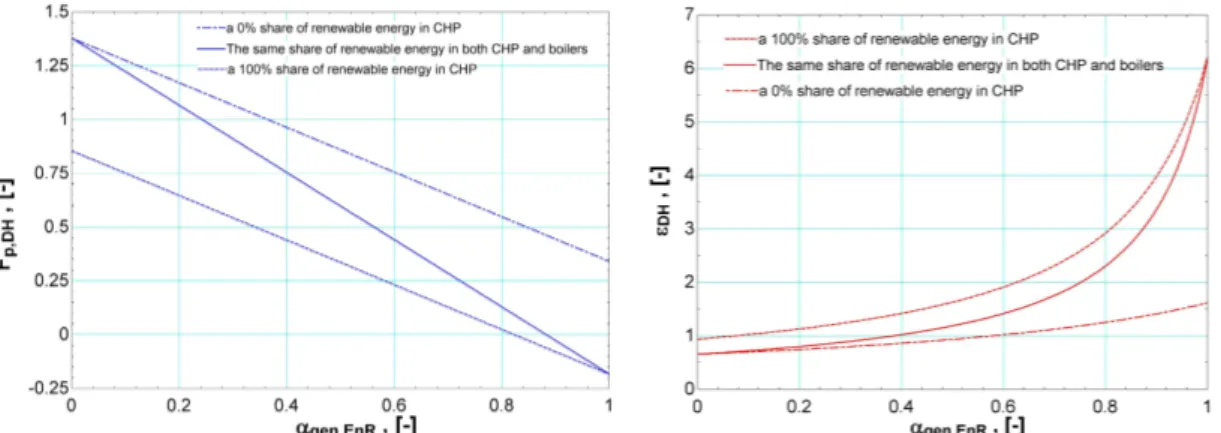
The last considered modifications are related to the relative share of renewable energy sources (αgen,EnR in Figure 1.) This relative share has been modified from 0% to 100% for the boiler. For the CHP, three cases are being thought: a full renewable CHP (e.g. biomass or biogas), a full conventional CHP (e.g. a gas-fired CHP) and a relative share equal to αgen,EnR. This modification influence only PEF and the primary energy efficiency.
Figure 1. The influence of the share of renewable energy on the primary energy factor and the primary energy efficiency
First, negative value of PEF can be reached when the share of renewable energy is higher than 80% as Figure 1 shows. Such values are not meaningful. Second PEF shows a higher sensitivity to the energy share than Primary energy efficiency. Third, the relative share of renewable energy can have a higher effect on the parameters than the three first cases
discussed above. For decision makers it is important to know which is the most suitable share of renewable energy. The larger share, the better the parameters. Although Figure 1 shows that a 40% share can lead to a 0.75 PEF and primary energy efficiency equal to 1.
METHODOLOGY TO ASSESS THE INFLUENCE OF URBAN PLANNING VARIABLES ON THE ENERGY PERFORMANCE OF DISTRICT HEATING NETWORKS
Finally, a methodology to assess the link between urban characteristics and energy district heating performance is proposed, based on the developed energy indicators. The methodology established is divided into four main steps.
1. Selection of the area
The first step is to select the areas of interest. If the goal of the study is to assess the possibility of a given area to be heated by district heating, this step has no sense. When the area is not well defined, this step is necessary. This preliminary works consists of two main parts: finding the more suitable area and collecting all the necessary data.
The more relevant pieces of information to collect are linked to the age of the building stock, the main orientations of the buildings or by default an estimation of the solar gains, the joint ownership and the building function. All these parameters give the building energy uses.
2. Hourly heat demand
The second step is to analyse the hourly demands. Two approaches can be thought: a general approach based on heat losses through buildings walls in steady state or a more precise method based on a dynamic simulation program (e.g. Trnsys). The first approach is very easy to use and can be quickly conducted. The second approach is more precise but demands to define realistic dynamic consumptions patterns for the given area. Usually such patterns are well known for the dwellings but not for other kind of buildings such as hospitals, services buildings and shops.
3. Hourly primary energy use
Energy losses influence the hourly primary energy use. Three main heat losses can be found by following the energy flows from the primary to the end-use energy. These losses are: the stack losses, the network heat losses and the network pumping losses. First, hydraulic network can be quickly modelled. In link with previous parts, a dynamic node model is recommended to show good results for the temperature calculations. Then hourly network heat losses can be assessed and lead to the hourly energy use of the whole district heating network.
It is really important to emphasis on the fact that the total hourly network heat demand is a key result.
4. Quality indicators evaluation
Based on hourly heat energy consumption, the four energy indicators which are defined in previous sections can be calculated. A comparison is thus possible to quantify the impact of urban variables such as the building function, the built density or the building stock age on these energy indicators.
This methodology can thus been used to assess the link between spatial and temporal distribution of the heat demands through an urban context and the energy performance of a potential district heating network.
CONCLUSIONS
District heating networks are quite common systems in Europe and they are intended to have a great play in future energetic world. However, only one energy indicator is often used to assess their energy performances. In order to help engineers and decisions makers to assess the quality of district heating networks projects, key energy indicators have been defined. They can be used either for new district heating networks either for investments in old district
heating networks. They also allow a good energy management of existing district heating networks. Literature generally considers only the primary energy factor but it has been shown that this parameter alone is not sufficient to help decision making even if it gives a good overview of the energy performances of a district heating network. Based on the same variables three parameters have been added to enhance this insight: relative importance of energy losses, primary energy efficiency and district heating global efficiency. Coupled with the primary energy factor, they give a more detailed picture about heating district network quality related to energy use. Finally, a methodology has been proposed to assess the link between urban characteristics and the energy performance of district heating networks.
A further analysis will define other quality indicators for heating district networks related to environmental, technical and cost issues. The whole indicators will provide interesting details over district heating performances and will help decision making and energetic management for both new and old networks. Further developments are needed in order to quantify the considered impacts.
ACKNOWLEDGEMENTS
We gratefully acknowledge the economic support of the University of Liège. This paper had be written for the UNO projects (Urban Network Optimisation).
REFERENCES
Ajah A.N., Patil A.C., Herder P., Grievink J. Integrated conceptual design of a robust and reliable waste-heat district heating system. Applied thermal engineering, 2007, vol.27, n°7, pp. 1158-1164.
Casisi M., Pinamonti P. and Reini M. Optimal lay-out and operation of combined heat and power systems. Energy, 2009, vol. 34, n°12, pp. 2175-2183
CEN 2007. EN standards/EN-15316-4-5 Heating systems in buildings - Method for calculation of system energy requirements and system efficiencies - Part 4-5: Space heating generation systems, the performance and quality of district heating and large volume systems.
European commission 2010. Energy 2020-A strategy for competitive, sustainable and secure energy
http://eur-lex.europa.eu/LexUriServ/LexUriServ.do?uri=COM:2010:0639:FIN:EN:PDF, last accessed on 28 April 2011.
IGD & AMF 2009. Indicateurs de performances pour les réseaux de chaleur et de froid, PP 1-85, http://www.fondation-igd.org/Publications-rub1-8.html, last accessed on 10 March 2011.
Olsen P.K., Lambertsen H., Hummelshøj R., Bøhm B., Christainsen C.H., Svendsen S., Larsen C.T., Worm J. (2008) A new low temperature district heating system for low energy buildings. The 11th International Symposium on district heating and cooling, Reykjavik, Iceland.
Vallios I., Tsoutos T. and Papadakis G. Design of biomass district heating systems. Biomass & bioenergy, 2009, vol. 33, n° 4, pp. 659-678.
van Lier M.W.P. 2010. Slimnet : an innovative integral approach for improving efficiencies in district heating networks. Proceedings of the 12th symposium on district heating and cooling, Talinn, pp. 53-59.
Werner S. 2006. Guidelines for assessing the efficiency of district heating and district cooling systems. Work package 3, Euroheat&Power, Brussels, Belgium, pp. 1-8.
Yildirim N., Toksoy M., Gokcen G. Piping network design of geothermal district heating systems: Case study for a university campus. Energy 2010, vol. 35, n°8, pp. 3256-3262