Innovation Growth Clusters:
Lessons from the Industrial Revolution
Leonard Dudley (Université de Montréal)
and Christopher Rauh (Université de Montréal, CIREQ)
August 9, 2018
Over three centuries ago, a new technology suddenly increased the amount and frequency of available information. Might such “Big Data” have disrupted the causal relationships linking economic growth and innovation? Previous research has affirmed that a society’s economic success during the Industrial Revolution depended on its institutions. Here we examine the hypothesis that by allowing people to cooperate more easily with one another, language standardization raised a society’s rate of innovation. As a result, the region could attract the resources needed to grow more rapidly. Empirical tests with 117 innovations and 251 Western cities suggest that the presence of a standardized tongue helps to explain the burst of innovation and growth observed between 1700 and 1850. Moreover, once one has accounted for language standardization, institutional quality has little further power to explain economic progress.
1. The Question and Its Importance
Does economic growth stimulate innovation or does causality run rather from innovation to economic growth? Over most of the past 2,000 years, the evidence tends to support the position that economic growth has led to innovation. In China, the re-establishment of internal peace under a centralized administration around 600 AD led to a doubling of population over the following five centuries.1 During the latter part of this period, under the Song dynasty, the Chinese invented gunpowder, paper money and the mariner’s compass.2 However, following the fall of Northern Song capital to outside invaders in 1127 and the subsequent devastation of much of northern China, such innovation virtually ceased in China until the present day. As for Europe, the invention of the caravel, typography and
1 Ebrey (1996, 159).
2
effective firearms came in the fifteenth century, during the region’s demographic recovery from the Black Death. Subsequently, lower temperatures during the Little Ice Age after the mid-sixteenth century brought demographic stagnation and a simultaneous dearth of important innovations (Mokyr, 1990, 79).
In the eighteenth century, however, there seems to have been a disruption to this long-standing pattern of causality running from growth to innovation. Between 1700 and 1850, as mean temperatures rose, the population of Western Europe doubled.3 Simultaneously however, there was a virtual explosion of innovation in the West. Historians of technology have designated over one hundred new techniques during this period as important technological contributions (Dudley, 2017). Did demographic growth caused in part by a milder climate gradually create markets for the output of would-be inventors? Or did new technologies suddenly allow given resources to support a much larger population? If so, what was it that generated the prolonged outburst of innovation?
The direction of causality is important for policy. If growth tends to lead automatically to productivity-enhancing innovations, then economic policies should presumably be directed primarily toward replicating institutions that encourage investment and the creation of employment opportunities, with the assurance that productivity improvements will follow. If, however, three centuries ago, innovation suddenly became the principal source of an economy’s prosperity, it is essential to identify the factors that favor the emergence of new technologies.
The century and a half of the First Industrial Revolution, from 1700 to 1850, is an ideal period for testing causal relations in this case, since both innovation and economic growth varied sufficiently across regions in the West to permit identification of cause and effect. At the same time, innovations were sufficiently numerous and biographical information detailed enough to situate new developments both chronologically and geographically. Moreover, this period is pertinent if we wish to abstract from the effects of policy since, as MacLeod and Nuvolari (2016) have argued, before the middle decades of the nineteenth century, inventors were poorly protected by their countries’ legal systems.
3
The next section of this paper outlines the main features of economic growth and innovation over the period from 1700 to 1850. We show that per-capita economic growth across countries in the West was highly correlated with rates of urbanization. Moreover, innovation was geographically highly concentrated, with over 90 percent of important new technologies originating in three clusters of cities in in Great Britain, northern France and the north-eastern United States.
To unravel the linkages between urbanization and innovation, Section 3 proposes a two-step estimation procedure. In the first two-step, the paper examines the factors that favored innovation. Previous research has indicated that a society’s success in developing new technologies depended on its institutions and on the factor prices it faced (North, 1990; Allen, 2009). However, recent studies suggest that the degree of language standardization may also have played an important role in generating innovation. Sasaki (2017) shows that the timing of the acquisition of the printing press explains the great dispersion in the dates of language standardization across the regions of Western Europe. Dudley (2017) provides evidence that the date of language standardization in turn explains the timing of innovation in European cities.
The great majority of European cities and towns produced no innovations whatsoever during the Industrial Revolution. In the first step of the present paper, therefore, we use an estimation procedure that takes account of the large number of localities with zero innovations. In the second step, we inquire whether the number of innovations so explained can account for observed differences in rates of growth of urban population during the Industrial Revolution. Here, the question is whether innovations played a role distinct from those of other influences on a city’s demographic growth. A simple variant of the gravity model suggests that urban regions which have been able to innovate will be able to attract qualified workers in order to produce additional innovations and create downstream industries that employ the new technologies, attracting capital and labor from other centers. To test this model, in Section 4 we divide the sample of innovations identified by leading economic historians into two groups. A first group comprises those with two or more inventors – “cooperative innovations” (CIs); for example, the atmospheric steam engine of Thomas Newcomen and John Calley, a breakthrough in mechanization. A second group is
4
made up of those with a single inventor – “non-cooperative innovations” (NCIs); for example, John Kay’s flying shuttle, a relatively minor improvement in the hand loom. The data set consists of observations for 251 European and North American cities, at intervals of 50 years from 1700 to 1850.
The results of the first step confirm that language standardization was important as an explanation for both types of innovation, but particularly critical for cooperative innovation. Moreover, there is evidence of path dependency or hysteresis, whereby a combination of past experience and the passage of time raised the capacity of a city to generate cooperative innovation.
In the second step, the explanation of population growth in a given city, care is necessary to take account of feedback from past growth to subsequent innovation. Once this adjustment is made, there is strong evidence of innovation clustering, whereby language standardization promoted CI in one city that led in turn to further innovation with growth-simulating effects in the same city, along with positive externalities for other cities in the same country. We found no such effects for NCIs.
The results provide strong empirical support for Alex Pentland’s (2014) argument that growth-enhancing innovation depends on “idea flow” and “social learning”. However, these forces were already present and challenging policy makers some three centuries ago, when the rapid standardization of the national languages of Britain and France confronted these countries with an earlier incarnation of Big Data.
5
2. Cities and the Industrial Revolution
Today we are used to thinking of industrialization as primarily an urban phenomenon. Nevertheless, several economic historians of a previous generation concluded that the city did not play an important role in the mechanization of Western industry. For example, Paul Bairoch (1988, 256) stated that “the dominant urban centers in English society at the start of the eighteenth century made no significant contribution to the initial phases of the Industrial Revolution.”4 However, a detailed examination of the historical evidence suggests that we should avoid making any hasty conclusions about the relationship between the city and technological change.
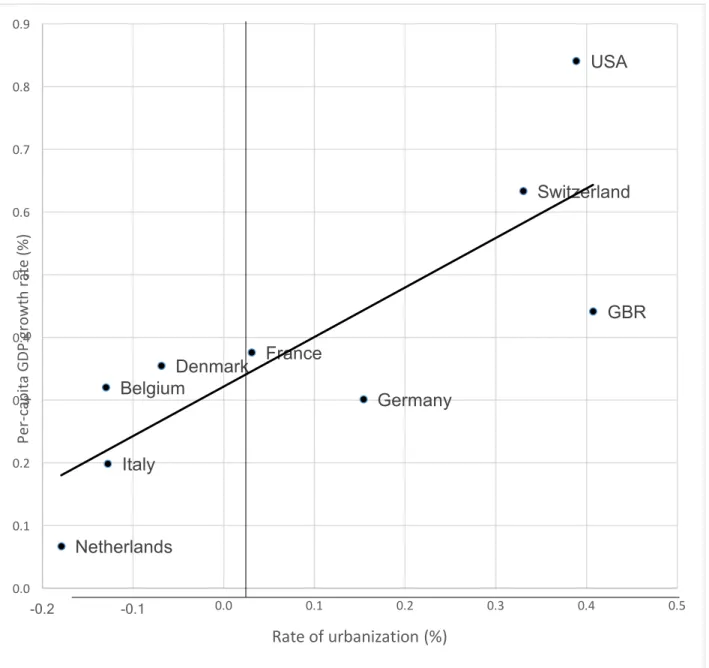
Figure 1 presents some of the essential facts concerning urbanization and economic growth between 1700 and 1850 for nine present-day European states. Across the West during this period, there were considerable differences in rates of increase in per-capita GDP. As the vertical axis shows, there was rapid growth of income levels in the USA, Great Britain, France and Switzerland. However, output per person increased considerably less rapidly in the Netherlands, Italy and Belgium.5 The trend line indicates that these output growth rates were highly correlated with a simple measure of urbanization; namely, the difference between the rate of population growth in cities of more than 5,000 inhabitants and the population growth rate of the country as a whole. In the four countries with the fastest GDP growth, this difference was positive, indicating growing urbanization. However, in the more slowly growing Netherlands, Italy, Belgium and Denmark, the population of the cities increased less rapidly than that of the countryside and the smallest towns. In other words, in these four economies, urbanization rates were negative, indicating disurbanization! As mentioned above, most previous explanations of the acceleration in economic growth during the Industrial Revolution fall into one or the other of two groups. One set of studies emphasizes the forces on the supply side that protected entrepreneurs from arbitrary
4 Landes (1965) and Flinn (1966) were of similar opinions.
5 Note that in Europe, the cities of Ireland, western Austria and northern Italy are included in the innovating zone.
6
appropriation of their assets and the streams of income generated therefrom. North (1990, 3) stressed the importance ofinstitutions that reinforce the rights of property owners and assure the enforcement of contracts. Similarly, for Mokyr (2002, 34), in order to innovate, a society must have an ideology that favors new ways of practical thinking.6 Landes (1998, 219) widened the definition of contributing institutions to include Britain's individualistic culture. Acemoglu and Robinson (2012, 82) pointed to the emergence of ‘inclusive’ political institutions as the keys to Britain’s economic success.7
A second group of authors pointed to the unique constellation of factor prices in Britain and America that created a demand for the mechanization of manufacturing. With Britain’s rising labor costs and abundant energy in the form of coal and falling water, Allen (2009, 105, 173-175) suggested, it became profitable to replace skilled labor with powered machinery. In Asia, Pomeranz (2000, 62-63) argued, abundant labor and scarce alternative power sources, precluded the application of such energy-using technologies.
The data on urbanization and economic growth pose challenges for both of these approaches. Consider first the importance of institutions, with the help of Figure 1. Great Britain and the Netherlands each had individualistic institutions that favored property owners, providing them with a strong voice in government policy. Yet between 1700 and 1850, while Britain experienced rapid growth and urbanization, the Netherlands suffered through stagnation and disurbanization. Or compare Italy, with its multiple autocratic regimes, to the Dutch federal republic. Here were two regions with quite different institutions, but both societies experienced slow growth and disurbanization. An analogous challenge arises when we consider factor endowments. Both France and Italy had relatively abundant labor and scarce energy resources. Yet in France over the century and a half after
6 Ogilvy and Carus (2014) offer a critical review of the institutional approach to economic growth. 7 Recent attempts to test this institutions hypothesis empirically have yielded some intriguing results. Gragnolati and Nuvolari (2018) find evidence of knowledge spillovers at the regional level in Britain in innovating cities during the Industrial Revolution. Moreover, Donges, Meier and Silva (2018) show that for a sample of German regions, the length of French occupation between 1790 and 1815 explains innovation rates almost a century later. In both cases, an exogenous change appears to have disrupted previous communication channels.
7
1700, there was significant growth in income levels and increasing urbanization, while in Italy there was stagnation by both measures.
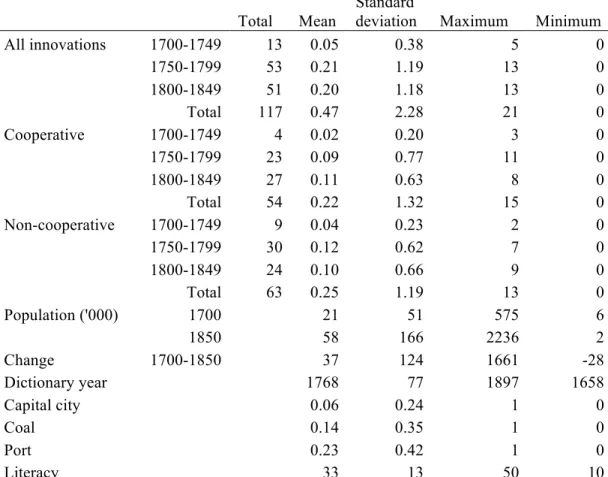
Some consideration would appear to be missing in the institutional and factor-endowment approaches to explaining the Industrial Revolution. As is well known, there was a third important dimension to economic change between 1700 and 1850; namely, a series of technological improvements that raised worker productivity. Historians of technology have identified over 100 important innovations during this period. Indeed, one may identify 117 of these innovations as particularly significant, each breakthrough being cited by at least two prominent economic historians.8 The area in which these innovations were developed constitutes an “innovation space” that accounted for virtually all of the world’s important innovations over a century and a half.9
It is helpful to separate these innovations into two categories, as summarized in Table 1. One group comprises 54 technologies that may be termed cooperative innovations (CI). In each case, the available biographical information permits the identification of both a principal and at least one unrelated collaborator who made a significant contribution (see Dudley, 2012, chs. 2-4). From the biographies, one may suggest that had the other individual(s) not participated in the development of these innovations, the technology would not have been successful. These CIs tended to be relatively complex, requiring the integration of distinct areas of specialization. Prominent examples are the atmospheric steam engine of Thomas Newcomen and John Calley, the production of sodium carbonate from salt, discovered by Nicolas Leblanc and Jean d’Arcet, and interchangeable parts, developed by Simeon North and John Hall.
The second category consists of non-cooperative innovations (NCIs), those for which only a single inventor may be identified. These inventions tended to be simple conceptually; for example, John Kay’s flying shuttle, James Hargreaves’s spinning jenny and Edmund
8 The authors in question were Donald Cardwell (1991) of Britain, Maurice Daumas (1979) and his associates of France, Joel Mokyr (1990) born in the Netherlands and living in the United States, and Akos Paulinyi (1989), born in Hungary and residing in Germany. Of the total number of innovations, 87 were mentioned by at least two of these authors. The 30 others were noted by only one of them but were also cited by the Encyclopedia Britannica.
9 In addition to Great Britain, France, Belgium, the Netherlands, German, Switzerland and Denmark, the European portion of this space is defined to include northern Italy and western Austria.
8
Cartwright’s wooden power loom. Like the cooperative innovators, these independent inventors depended on trust from networks of suppliers, employees and customers. That this trust was not always forthcoming is shown by the difficulties of the three inventors in persuading users of their ideas to compensate them for their efforts.
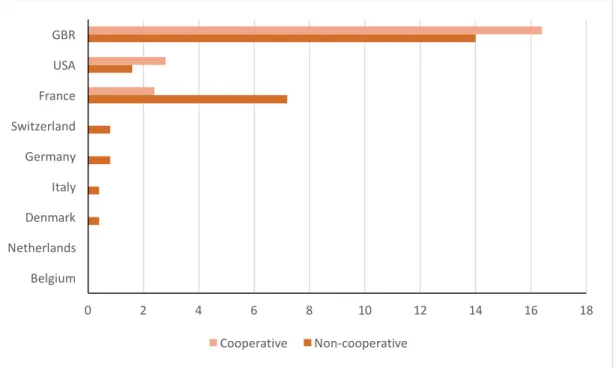
A convenient measure of innovative success is the number of innovations per person within the present-day boundaries of the nine countries of Figure 2. It will be observed that the four countries with the highest growth rates of per-capita output also had the most innovations per capita. In addition, three of these states – the United Kingdom, the USA and France – were the only countries with CIs. It might also be noted that these same three states also had the most NCIs. What did these countries have in common that distinguished them from their less innovative and more slowly growing neighbors?
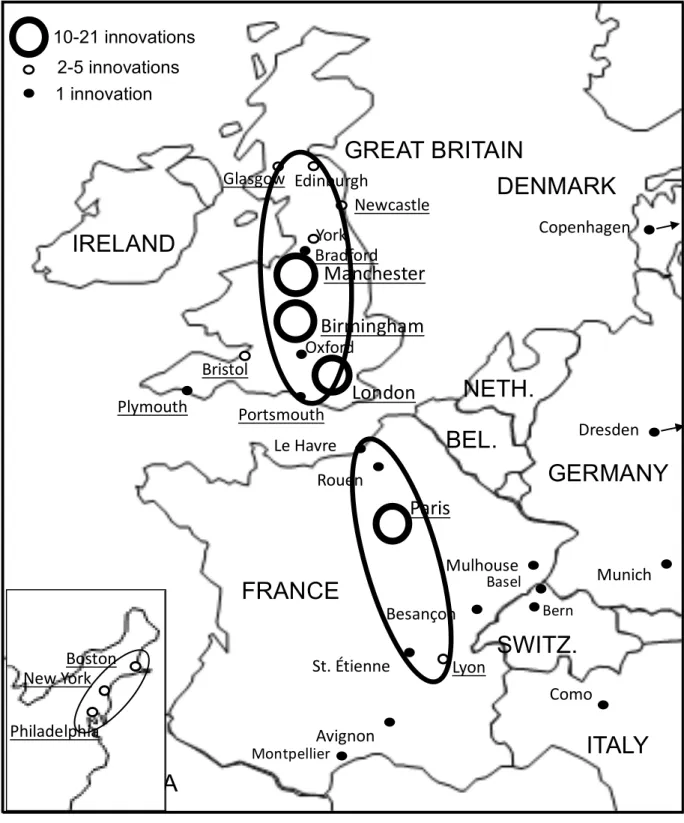
To answer this question, it is important to examine the area in which each of the 117 innovations originated. Our set of potential innovating regions had 251 urban centers with populations over 5,000. Yet all of the selected innovations were concentrated in the areas surrounding only 29 of these cities, as Figure 3 indicates. It is perhaps not surprising that the two largest cities by far, the national capitals of England and France, both with populations of one-half million or more in 1700, each had ten or more innovations over the following century and a half. However, in 1700 Birmingham and Manchester each had a population of well under 10,000. Yet together these two cities had more innovations than the two capitals combined between 1700 and 1850.
A closer look at the map in Figure 3 suggests why these particular cities were so innovative. Over 90 percent of the European innovations were generated within two clusters, each roughly 100 miles (160 km) wide and 400 miles (640 km) long in Great Britain and France. One of these regions stretched from the London area to southern Scotland; the other extended from Lyon through Paris to Rouen. A similar oval along the northeast coast of the United States, from Boston to Philadelphia, accounts for all of the innovations outside Europe. During the century and a half after 1700, something was occurring within these clusters of innovation that had not yet touched the rest of the world.
9
Together, these figures suggest three requirements of a theory to explain the relationship between economic growth, urbanization and innovation during the Industrial Revolution. First, the model should explain the sudden appearance of a great dispersion in rates of urbanization and economic growth across Western Europe and its North-American offshoot in the eighteenth century. Second, the hypothesis should explain an even greater dispersion in rates of innovation in these same regions during the century and a half after 1700. Finally, the theory should explain why the 54 cooperative innovations developed during this long period – breakthroughs such as the atmospheric steam engine, industrial chemicals and interchangeable parts – all originated in Great Britain, in northern France or in the northeastern United States.
10
3. Modeling Innovation and Growth
We have seen that almost all of the world’s innovations between 1700 and 1850 were concentrated in three narrow bands of territory in northwestern Europe and North America (see Figure 3). What did people in these three clusters have that was missing, at least temporarily, in the rest of the world?
(a) Language and Innovation
In Britain in the late Middle Ages, there were four major families of spoken English, corresponding roughly to four Anglo-Saxon kingdoms that had existed some six centuries earlier. In the north-east was the Northern dialect group, in the center the Midlands group, in the south-west the Western group and in the south-east the East-Anglian group (Crystal, 324-325). The spoken language in the area surrounding the capital, London, had been strongly influenced by migration from the Midlands. After 1430, this dialect of the Home Counties formed the basis for the written usage in government documents that became known as the “Chancery Standard” (Crystal, 2003, 54). Nevertheless, in the early seventeenth century, people from different regions in England had difficulty understanding one another’s speech (Freeborn, 1992, 137). In France, a region speaking francien, the dialect of Paris, had been created by the conquests of the French monarchy during the fourteenth and fifteenth centuries. The Parisian dialect would be given official status in written French by the decree of Villers-Cotterêts of 1539 (Robert, 1980; 1920). However, in seventeenth-century France, only 30 miles (48 km) north of Paris, Louis XIV was unable to understand a crowd complaining of food shortages (Bell, 2001, 82). In Brittany and south of the Loire, people still spoke dialects of languages quite distinct from French. In the last half of the fifteenth century, as Benedict Anderson (2006) observed, Britain, France and the neighboring states of Western Europe were disturbed by a technological shock; namely, the printing press of Johann Gutenberg and Johann Fust. Sasaki (2018) has shown that the invention of metal movable typography triggered a process by which, through the actions of printers and their governments, spoken vernaculars across Europe gradually acquired standardized written forms. However, because of delays in the diffusion of the new technology, the timing of this standardization process varied from one language
11
to another. By the early eighteenth century, Great Britain, France and their offshoots were the first societies to have monolingual vernacular dictionaries.10 Might these countries’ early lead by this measure of language standardization help explain their precocity in experiencing rapid economic and urban growth, as displayed in Figure 1?
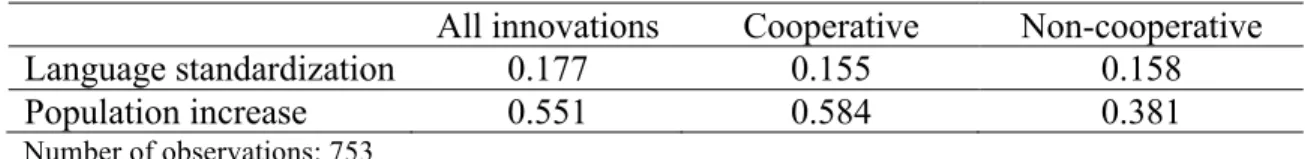
Support for this hypothesis is suggested by the correlation coefficients displayed in Table 2. During a given half century between 1700 and 1850, the number of years since the publication of a region’s first monolingual dictionary was positively correlated with the number of innovations that its residents developed. These innovations were in turn highly correlated with the increase in the city’s population in the same period. Leaving aside the directions of causality for the moment, let us separate the process by which a city’s economy grows conceptually into two steps. In the first step, residents of the city cooperate with residents of other cities to create innovations, of which a certain fraction are applied to production in that city. In the second step, the population of the city grows, in part through the natural increase in its original population, and in part through net immigration of workers attracted by new employment opportunities created by these innovations.
(b) The Innovation Equation
Consider first the innovation process in city i. Assume that innovation occurs when an individual from that city combines his or her knowledge with the expertise of someone from another city who speaks the same language. In a given period, let the number of innovations in the city then be expressed as a function of the exponents of its population,
ni, and the number of years, si, since it adopted the same standardized language as other
cities in its language area.
𝑦" = exp 𝐶 + 𝛽*𝑛" + 𝛽,𝑠" .
10 Plausible dates for the first monolingual dictionary in our sample of ten present-day countries are: England, 1658; France north of the Loire and Belgium and Switzerland (French), 1680; France south of the Loire, 1815; Scotland, 1707; United States, 1728; Germany and Switzerland (German), 1786; Denmark (1833); Netherlands and Belgium (Flemish), 1864; Austria (1868). See Dudley (2017, Table 2).
12
This equation expresses the expected number of innovations produced in a given period after the introduction of a standardized language in a form that may be inserted into a Poisson distribution.
The next step is to integrate this networking approach into a specification that incorporates the supply and demand approaches used in previous studies. Define the dependent variable as the number of innovations of a given type that occurred in the region of a given city during each half-century between 1700 and 1849. Since such innovations may be considered rare events, we should use an estimation method appropriate for count data. The variance of this variable in our sample (0.182) is considerably greater than the mean (0.065). To allow for this over-dispersion (a greater frequency of zero observations than the Poisson distribution assumes), a negative-binomial specification is appropriate, since it has an extra parameter to adjust the variance separately from the mean.
There is another characteristic of the data to take into account. Of the 753 observations, there are only 22 with positive values for the number of cooperative innovations. For non-cooperative innovations, the corresponding figure is 34. The zero-inflated negative binomial model provides a way of modeling such excess zeros, in addition to allowing for over-dispersion. For each observation, there are two possible data generation processes. For observation i, the first process is chosen with probability φi and the second with probability 1- φi . The first process generates only zeros using a logit model. A possible determinant of this selection is the number of innovations in the preceding period, an indication of dynamic learning effects. The second process generates counts from a negative binomial model, where xi is a vector of covariates.
In general:
Iijt = 0 with probability φi
(1) = exp (Xijtβ + 𝜀"/0 + uijt) with probability 1-φi ,
where Iijt is the expected number of innovations in city i of type j (cooperative or
non-cooperative) in period t, Xijt is a vector of explanatory variables, β is a vector of parameters,
13
(c) The Growth Equation
Turn now to the growth process. Let us assume that the change in population in city i during period t is a function of its initial population, the number of innovations in that city during the period, and the number of innovations in other cities of the same country, the latter weighted by the distance from the city in question.
∆𝑃"0 = 𝛼*𝑃"6+ 𝛼,𝐼"0 + 𝛾 /:"𝑑"/𝐼/0+ 𝒁"0𝜹 + 𝑣"0 (2) where Pi0 = population of city i in period 0,
Iit = number of innovations in city i in period t
dij = distance between cities i and j.
𝒁"0 = vector of other explanatory variables.
Of particular interest are the parameters α2, a measure of the impact of innovation on economic growth and γ, which captures the externalities whereby all cities in a network benefit from the innovations in other cities in the same country.
In his study of the implications of “Big Data”, Alex Pentland (2014) has speculated on the social implications of recent technologies that have made information available in unprecedented quantities and frequencies of observation. Thanks to the multiplication of personal information devices and the ubiquity of WiFi service, individuals now have instantaneous access to the discoveries of others – “idea flow” on a planetary scale. As a result, we now have the possibility of collectively rapidly acquiring the experience of one another – “social learning”. However, is this technological shock unique, or did something similar happen some three centuries ago in Britain and France with the spread of standardized languages, as Anderson (2006, 40-46) has argued? Estimation of the parameters of equations (1) and (2) will help answer this question.
14
4. An Empirical Test
The previous section distinguished two steps in the development of innovation growth clusters during the Industrial Revolution. First, new technologies were discovered in a number of urban zones within certain regions of Western Europe and the northeastern part of North America; second, subsequent application of these technologies generated employment opportunities that attracted additional workers and their families to the innovating cities.
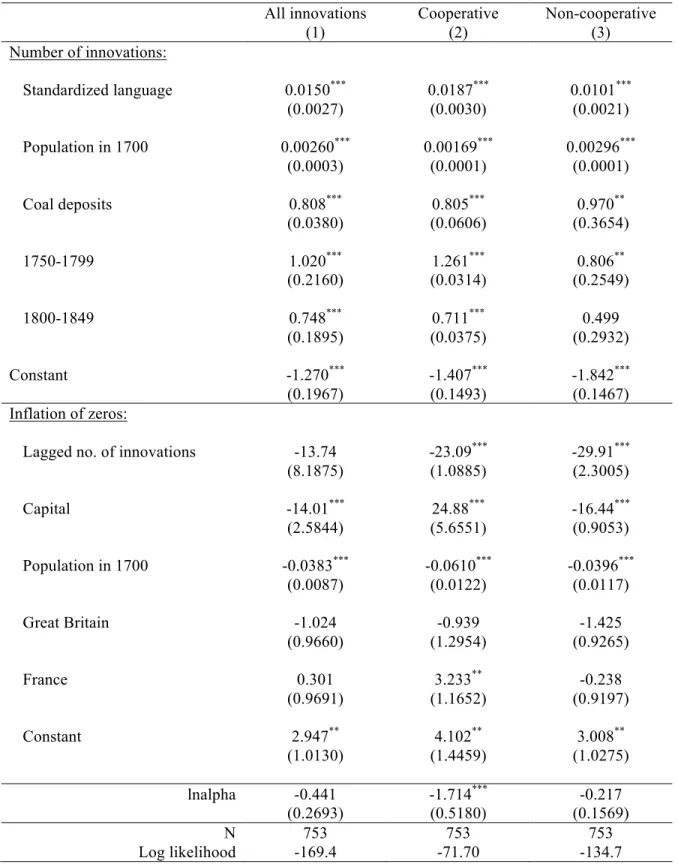
Table 3 presents an analysis of the first step, applying the zero-inflated negative binomial specification of equation (1) to explain the number of innovations in a given city in a given half-century. The first column shows estimates to explain all 117 innovations, while the second and third columns are assigned to estimates for the 54 cooperative innovations (CIs) and the 63 non-cooperative innovations (NCIs) respectively. Consider first the lower part of the table, which presents the determinants of whether or not a given city lacks the potential for innovation. The lagged number of innovations, a measure of innovation experience in the city during the preceding half-century decreased the probability that it could not innovate; i.e., increased the probability that it could innovate. This result could be interpreted as evidence of path-dependent “social learning” at the level of the individual urban region. Note, however, that although capital cities are more likely to have NCIs, they were less likely to have CIs. In other words, the probability of collective innovation was lower and that of individual innovation higher in national political centers. A possible explanation is that before the development of urban transport and the telephone, there were diseconomies of scale to collaboration in megacities such as Paris and London, due to the higher cost of interaction between potential partners (see Bairoch, 1988, 279). Individual inventors, however, may have been more likely to find the market inputs they needed in the capitals. The country dummy variables may perhaps be interpreted as a rough measure of the importance of their national institutions. If so, British and French institutions would seem to have had no significant impact on whether a city was able to innovate, once one takes account of language. Another way of saying the same thing is that language would
15
appear to be by far the most important component of institutional differences between countries.
The upper section of Table 3 explains the number of innovations in each potential innovating city. The presence of a standardized language had a very significant positive impact for both categories of innovations, but especially so for CIs. Having a common tongue would appear to have facilitated the communication and trust that were essential for successful collaboration between individuals from different cities. However, the distance between the two cities turned out to be not important, provided that they were both in the same language area. Having nearby coal deposits (within 50 km or 31 miles) was also an important factor favouring innovation in both cases, but particularly valuable for NCIs. As in the case of John Smeaton’s efficient atmospheric steam engine, or Jonathan Hornblower’s reciprocating compound steam engine, many of these NCIs were relatively minor adaptations of earlier cooperative breakthroughs in power-using technology. Note finally that the coefficients of the period variables for the two half-centuries after 1750 are significantly greater for CIs than for NCIs. Learning to innovate increased not only the potential to innovate but also the number of innovations among cities capable of developing new technologies.
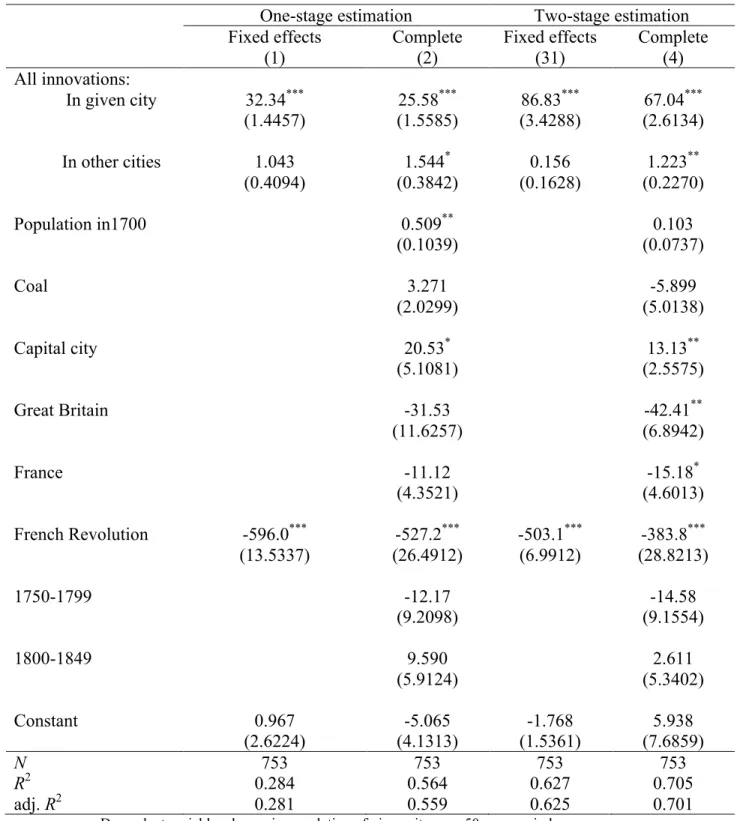
Consider now the second step, in which the dependent variable is the population increase in a given city within a given 50-year period, as specified in equation (2) above. Table 4 presents least-squares robust-cluster estimates for the complete set of 117 innovations. In the first column, a simple fixed-effects specification reveals that the number of innovations in a given city was a key factor explaining the growth of its population. The more complete specification in the second column confirms this result. Innovations in other cities of the same country also had a significant positive impact on a city’s growth.
As for other determinants of urban population increase, the second column shows that coal deposits and institutions specific to Great Britain or France had no significant independent impact. In addition, in both of these first two columns, a dummy variable for Paris during the half-century from 1750 to 1799 is negative and highly significant. The city had grown rapidly until 1789, but emigration of the nobility and the economic hardships due to the
16
Revolution led to an absolute fall in the city’s population over the following decade (Fierro, 1996, 218-283).
The single-stage results to this point are quite compatible with the simple correlation coefficients of the first column of Table 2, implying a positive relationship between innovation and urban growth. However, correlation need not imply causality. Accordingly, it is instructive to consider the top lines of the third and fourth columns of Table 4, in which the observed values of innovations have been replaced by their instrumented values from the first column of Table 3. Since these two-stage coefficients are significantly greater than those of the first columns of Table 4, it would appear that there was indeed feedback from population growth to innovation. However, as the earlier results suggested, for a given initial population, increasing a city’s size appears to have had a negative effect on innovation!
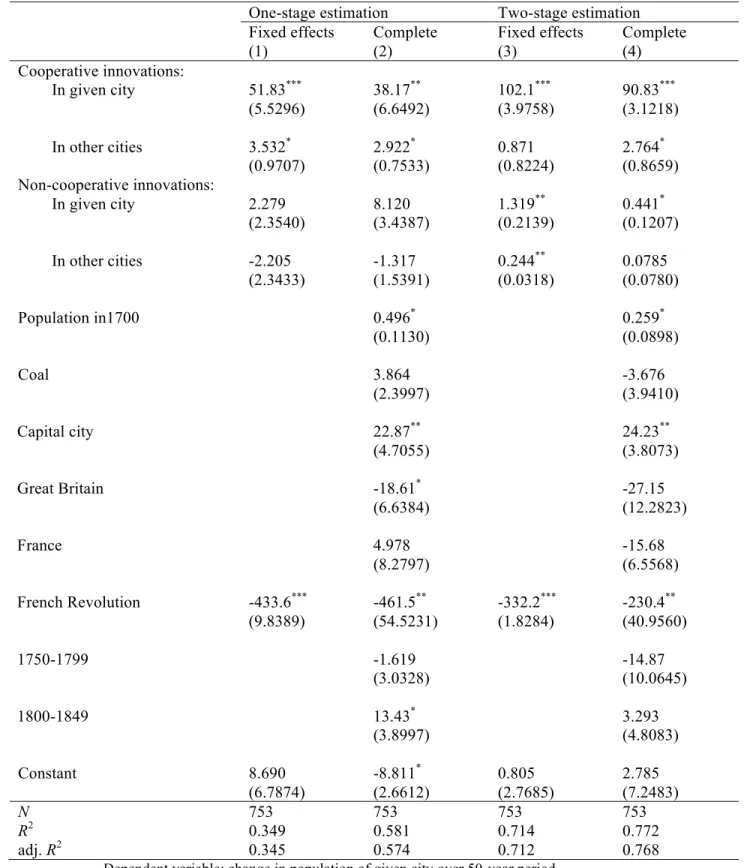
Do all innovations have similar effects on economic growth? To answer this question, it is again helpful to divide the total set of innovations into two subsets, one made up of CIs and the other of NCIs. In the first two columns of Table 5, we see the single-stage estimates for the fixed-effects specification and the complete model when this distinction has been made. The second column shows that on average, a cooperative innovation in a city was accompanied by a population increase of some 38,000 during the same half century. In addition, such an innovation raised the population of all other cities in the same country by almost 3,000. A non-cooperative innovation was accompanied by a much smaller effect – an increase of about 8,000, with no spill-overs to other cities. Once again, coal deposits and variables representing the institutions of Great Britain and France had no independent positive effect. Indeed, non-innovating British cities actually grew significantly less than their continental counterparts, other things being equal.
The third and fourth columns of Table 5 display the two-stage results for the same specifications, with CIs and NCIs instrumented from the second and third columns respectively of Table 3. The complete specification in the fourth column confirms the significant positive effects of CIs on population growth in both the innovating city and in other cities of the same country. As before, NCIs had considerably weaker effects, and then only in the city where they originated. Comparing the one- and two-stage results, we see
17
as in Table 4 a significantly greater value for the same-city effect in the latter, suggesting negative feedback from population growth to innovation. However, this finding applies only to CIs.
Summarizing these results, we find first that once we take account of language standardization, we find little support for a rough measure of the importance of national institutions. Second, resource endowments in the form of coal deposits did have a significant effect on urban growth. However, this effect was indirect through encouraging the invention of energy-using technologies within feasible transport distance of coal. Third, and most importantly, language standardization had a strong positive effect on innovation, especially on the cooperative innovation that made possible the most important breakthrough technologies. The significant lagged effect of the previous generation’s inventions suggests some form of social learning, possibly through an increased willingness to trust strangers. The positive effect of innovation, particularly cooperative innovation, on urban population increase helps explain why the innovating countries had the highest rates of urbanization and per-capita income growth.
In short, it is perhaps no exaggeration to suggest that the one change in institutions which helped make the Industrial Revolution possible was surely the standardization of the English and French languages.
18
5. Endogeneity and Robustness
Before we accept the results of the previous section suggesting a two-part flow of causality, one from language standardization to innovation and a second from innovation on to population growth, there are two important verifications to make. First is the problem of endogeneity: it is quite plausible that causality flows in the opposite direction in each relationship. In other words, it could be innovations that are leading to greater language standardization, or economic growth that is fostering innovation. Second is the question of robustness: the measures of statistical significance may be sensitive to minor changes in specification.
(a) Endogeneity
Consider first the impact of language standardization on innovation. The question of whether causality runs in the other direction is quite easily answered. Great Britain, France and the United States, the countries accounting for 95 percent of the innovations, all had standardized languages well before their first important innovations. In the Netherlands, Belgium and Italy, where there was virtually no significant innovation, standardization came after the end of the sample period.
As for the population-growth equation, we saw in Tables 4 and 5 that the two-stage estimation yielded larger positive estimates for the effects of innovation on population increase than the single-stage procedure did. The results were similar whether we considered all innovations in the same city or only cooperative innovations. If there was feedback from urban population growth to innovation, therefore, such simultaneity would appear to have hampered the innovation process rather than promoting it. Quite possibly, with the transportation and communication technologies of the period, there were diseconomies of scale for urban regions above a certain size.
(b) Robustness
Consider now the robustness of the estimates to slight changes in specification, beginning with the innovation equation. The significant results for language standardization in Table 3 proved insensitive to the omission of each of the other variables from the specification.
19
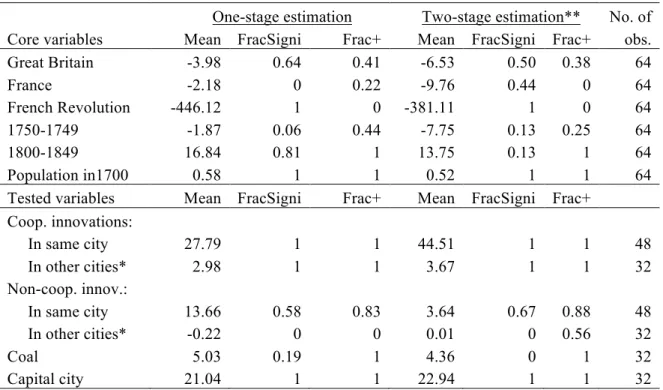
As for the population growth equation, the tests reported in Tables 6 and 7 the core variables appear in all of the specifications of each table. Each of the remaining tested variables appears in one specification for every possible combination of all but one of the other tested variables. The results indicate that the coefficients of both total innovations and cooperative innovations remain consistently positive and significant, whether for the same city or for other cities of the same country. The coefficients of the French Revolution and Capital city variables are similarly robust. However, estimates for non-cooperative innovations, like those for the country and time-period variables, are sensitive to the specification.
In summary, an examination of the questions of endogeneity and robustness confirms the conclusions of the preceding analysis. For the century and a half after 1700, there is strong empirical evidence of a positive impact of language standardization on innovation. There was also a significant positive effect of that innovation, particularly cooperative innovation, on urban growth.
20
6. Conclusion
In this paper, we have offered empirical support for the hypothesis that in the West between 1700 and 1850, there was a chain of causality running from language standardization to innovation and onward to urban growth. In essence, underlying modern economic growth was a new information technology that allowed individuals to interact easily and confidently with one another.
We suggested three requirements of a theory to explain the relationship between innovation, urbanization and economic growth during the Industrial Revolution. First, the model should explain the sudden appearance in the eighteenth century of a great dispersion in rates of urban growth and increases in per-capita income across Western Europe and North America. Differences in factor endowments and economic and political institutions alone cannot help us understand this phenomenon. Rather, the evidence presented here suggests that an additional essential key to explaining this dispersion was the occurrence of unprecedented differences in rates of innovation between regions.
Second, the hypothesis should explain the causes of this dispersion in rates of innovation during the century and a half after 1700. Coal deposits were an important determinant of regional economic growth during the Industrial Revolution, but only indirectly, through their impact on innovation activity. As Benedict Anderson (2006) and Yu Sasaki (2018) have argued, what was important for both Britain and France was the rapid spread of standardized vernaculars, a century or more in advance of other nations. The English Channel, the North Sea, and the geographic barriers around the French Hexagon established bounded spaces within which “social learning” on an unprecedented scale could occur. Once these new communications technologies have been taken into account, national differences in social rules and organizational forms have little further explanatory power to explain economic growth.
Third, the theory should explain why the many cooperative innovations – new technologies with more than one principal – during this period were all developed in three urban clusters in central Britain, northern France and the northeastern United States. These
21
breakthroughs, which required inputs from two or more individuals – for example, the atmospheric steam engine, industrial chemicals and interchangeable parts – each had a much greater growth impact than comparable single-inventor technologies. The simplest explanation is that these clusters were the networks within which the first two national standardized languages spread rapidly, due to repeated interaction between actors from the component urban nodes. Individuals from different backgrounds and places of origin could therefore communicate with unprecedented ease and confidence. In effect, the early monolingual dictionaries of the English and French languages were vehicles for an “idea
flow” that permitted the synthesis of disparate bits of existing technology.
There is one final question of interest. Is there a present-day equivalent to the distinction made in the paper between the relatively minor non-cooperative innovations that made up the majority of our sample and the cooperative innovations that constituted the most important breakthroughs? The distinctive feature of the latter was that they required the integration of two or more distinct areas of specialization. For example, in the development of the atmospheric steam engine, Thomas Newcomen was a Devon hardware merchant familiar with the needs of the mining industry for pumping water, whereas John Calley, his partner, was a plumber from the same region with experience in metal-working. Without the cooperation of coreligionists from the Midlands, however, their efforts would have been unsuccessful. Or in the case of the production of sodium carbonate from salt, Jean d’Arcet was a professor of chemistry from south-western France and Nicolas Leblanc a surgeon from central France with an interest in practical applications. If these examples are pertinent, any barriers to the flow of ideas may prove harmful to innovation and growth. Moreover, urban regions with two or more important industries, or with both basic and applied research centers, may have a significant comparative advantage in promoting innovation and economic growth over regions with a single dominant activity.
22
7. References
Acemoglu, Daron, and James A. Robinson, Why Nations Fail: The Origins of Power,
Prosperity and Poverty. London: Profile Books, 2012.
Allen, Robert C., The British Industrial Revolution in Global Perspective. Cambridge: Cambridge University Press, 2009.
Anderson, Benedict, Imagined Communities: Reflections on the Origin and Spread of
Nationalism, London: Verso, 2006.
Bairoch, Paul, Cities and Economic Development: From the Dawn of History to the
Present. Chicago: University of Chicago Press, 1988.
Bairoch, Paul, J. Batou, and P. Chèvre, The Population of European Cities, 800-1850. Geneva: Librairie Droz, 1988.
Barraclough, Geoffrey, ed., The Times Atlas of World History. Hammond: Maplewood, NJ., 1984.
Bell, David A., “Culture and Religion,” chap. 3 in William Doyle, ed., Old Regime
France 1648-1788. Oxford: Oxford University Press, 2001, 78-104.
Cardwell, D. S. L., Turning Points in Western Technology. Canton, MA: Science History Publications/USA, 1991.
Crystal, David, The Cambridge Encyclopedia of the English Language, Second Edition, Cambridge, Cambridge University Press, 2003.
Daumas, Maurice, A History of Technology and Invention, Volume III, The Expansion of
Mechanization, 1725--1860. New York: Crown Publishers, 1979.
Donges, Alexander, Jean-Marie A. Meier and Rui C. Silva, “The Impact of Institutions on Innovation,” Presentation at the World Economic History Conference, MIT, Cambridge, Mass., July, 2018.
Dudley, Leonard, Mothers of Innovation: How Expanding Social Networks Gave Birth to
the Industrial Revolution. Newcastle upon Tyne: Cambridge Scholars, 2012.
Dudley, Leonard, “Language Standardization and the Industrial Revolution”, Oxford Economic Papers, 69:4 (October 2017), 1138–1161.
Ebrey, Patricia Buckley, The Cambridge Illustrated History of China. Cambridge: Cambridge University Press, 1996.
Fierro, Alfred, Histoire et dictionnaire de Paris. Paris: Bouquins, 1996. Flinn, M. W., Origins of the Industrial Revolution. London: Longmans, 1966.
Freeborn, Dennis, From Old English to Standard English. Basingstoke, UK: Macmillan, 1992.
Gragnolati, Ugo M. and Alessandro Nuvolari, “Innovation, Localized Knowledge Spillovers, and the British Industrial Revolution, 1700-1850,” Presentation at the World Economic History Conference, MIT, Cambridge, Mass., July, 2018. Landes, David S., “Technological Change and Development in Western Europe,
1750-1914,” in H. J. Habakkuk and M. Postan, editors, History of Europe, vol. 6, part 1, Cambridge: Cambridge University Press, 1965, 274-601.
23
Landes, David S., The Wealth and Poverty of Nations. New York: Norton, 1998. Maddison, Angus, Contours of the World Economy, 1-2030 AD: Essays in
Macro-Economic History. Oxford: Oxford University Press, 2007.
MacLeod, Christine, and Alessandro Nuvolari, “Inventive Activities, Patents and Early Industrialisation: A Synthesis of Research Issues,” Rivista di storia economica, 32:1, April 2016, 77-108.
Mokyr, Joel, The Lever of Riches: Technological Creativity and Economic Progress. Oxford: Oxford University Press, 1990.
Mokyr, Joel, The Gifts of Athena : Historical Origins of the Knowledge Economy. Princeton, NJ: Princeton University Press, 2002.
North, Douglass C., Institutions, Institutional Change, and Economic Performance. Cambridge: Cambridge University Press, 1990.
Ogilvie, Sheilagh and A. W. Carus, “Institutions and Economic Growth in Historical Perspective,” in Philippe Aghion and Steven N. Durlauf, eds., Handbook of economic
growth, Volume 2, Amsterdam: Elsevier, 2014, 403-513.
Paulinyi, Akos, Industrielle Revolution: Vom Ursprung der modernen Technik. Reinbek bei Hamburg, Germany: Rowohlt, 1989.
Pentland, Alex, Social Physics: How Good Ideas Spread: The Lessons from a New
Science. New York: Penguin, 2014.
Pomeranz, Kenneth, (2000). The Great Divergence: China, Europe, and the Making of
the Modern World Economy. Princeton: Princeton University Press, 2000.
Robert, Paul, Le Petit Robert 2, Paris: SNL – LeRobert, 1980.
Sasaki, Yu, “Publishing Nations: Technology Acquisition and Language Standardization for European Ethnic Groups,” Journal of Economic History, 77 (2017), 1007-1047. Temple, Robert, The Genius of China: 3,000 Years of Science, Discovery & Invention.
Rochester, Vermont: Inner Traditions, 2007.
Voigtländer, Nico and Hans-Joachim Voth, “The Three Horsemen of Riches: Plague, War and Urbanization in Early Modern Europe.” Review of Economic Studies 80 (2013), 774-811.
24
Sources: See footnote to Table 1.
Figure 1. Annual urbanization and economic growth rates, 1700-1850
Belgium Denmark France Germany Italy Netherlands Switzerland GBR USA 0.0 0.1 0.2 0.3 0.4 0.5 0.6 0.7 0.8 0.9 -0.2 -0.1 0.0 0.1 0.2 0.3 0.4 0.5 Pe r-ca pi ta G DP g ro w th ra te (% ) Rate of urbanization (%)
25 Source: See footnote to Table 1.
Figure 2. Innovations per million inhabitants, 1700-1850
0 2 4 6 8 10 12 14 16 18 Belgium Netherlands Denmark Italy Germany Switzerland France USA GBR Cooperative Non-cooperative
26
Figure 3. Innovating cities during the Industrial Revolution, 1700-1850 (underlined cities had at least one cooperative innovation)
USA
SWITZ.
ITALY
IRELAND
GREAT BRITAIN
BEL.
NETH.
GERMANY
DENMARK
FRANCE
LyonParis
London
Birmingham
Manchester
Edinburgh Glasgow Bristol New York Boston Philadelphia Newcastle York Bern Basel Montpellier Munich Plymouth Le Havre Rouen Como Dresden St. Étienne Bradford Oxford Mulhouse Besançon Avignon 10-21 innovations 2-5 innovations 1 innovation Portsmouth Copenhagen27
Table 1. Summary statistics
Total Mean
Standard
deviation Maximum Minimum All innovations 1700-1749 13 0.05 0.38 5 0 1750-1799 53 0.21 1.19 13 0 1800-1849 51 0.20 1.18 13 0 Total 117 0.47 2.28 21 0 Cooperative 1700-1749 4 0.02 0.20 3 0 1750-1799 23 0.09 0.77 11 0 1800-1849 27 0.11 0.63 8 0 Total 54 0.22 1.32 15 0 Non-cooperative 1700-1749 9 0.04 0.23 2 0 1750-1799 30 0.12 0.62 7 0 1800-1849 24 0.10 0.66 9 0 Total 63 0.25 1.19 13 0 Population ('000) 1700 21 51 575 6 1850 58 166 2236 2 Change 1700-1850 37 124 1661 -28 Dictionary year 1768 77 1897 1658 Capital city 0.06 0.24 1 0 Coal 0.14 0.35 1 0 Port 0.23 0.42 1 0 Literacy 33 13 50 10
Sources: City population: Bairoch et al. (1988), as revised by Voigtländer and Voth (2013). Coal: Barraclough (1984; 201, 210-211).
Country population: Maddison (2007). Innovations: see footnote 7.
28
Table 2. Correlation coefficients between language standardization, innovation and urban population growth, 1700-1849, by 50-year periods
All innovations Cooperative Non-cooperative
Language standardization 0.177 0.155 0.158
Population increase 0.551 0.584 0.381
29
Table 3. Factors influencing innovation rates, 1700-1849
All innovations Cooperative Non-cooperative
(1) (2) (3) Number of innovations: Standardized language 0.0150*** 0.0187*** 0.0101*** (0.0027) (0.0030) (0.0021) Population in 1700 0.00260*** 0.00169*** 0.00296*** (0.0003) (0.0001) (0.0001) Coal deposits 0.808*** 0.805*** 0.970** (0.0380) (0.0606) (0.3654) 1750-1799 1.020*** 1.261*** 0.806** (0.2160) (0.0314) (0.2549) 1800-1849 0.748*** 0.711*** 0.499 (0.1895) (0.0375) (0.2932) Constant -1.270*** -1.407*** -1.842*** (0.1967) (0.1493) (0.1467) Inflation of zeros:
Lagged no. of innovations -13.74 -23.09*** -29.91*** (8.1875) (1.0885) (2.3005) Capital -14.01*** 24.88*** -16.44*** (2.5844) (5.6551) (0.9053) Population in 1700 -0.0383*** -0.0610*** -0.0396*** (0.0087) (0.0122) (0.0117) Great Britain -1.024 -0.939 -1.425 (0.9660) (1.2954) (0.9265) France 0.301 3.233** -0.238 (0.9691) (1.1652) (0.9197) Constant 2.947** 4.102** 3.008** (1.0130) (1.4459) (1.0275) lnalpha -0.441 -1.714*** -0.217 (0.2693) (0.5180) (0.1569) N 753 753 753 Log likelihood -169.4 -71.70 -134.7 Zero inflated binomial regressions
Dependent variable: number of innovations in city during 50-year period.
30
Table 4. Factors influencing urban population growth, 1700-1849 – all innovations
One-stage estimation Two-stage estimation
Fixed effects Complete Fixed effects Complete
(1) (2) (31) (4) All innovations: In given city 32.34*** 25.58*** 86.83*** 67.04*** (1.4457) (1.5585) (3.4288) (2.6134) In other cities 1.043 1.544* 0.156 1.223** (0.4094) (0.3842) (0.1628) (0.2270) Population in1700 0.509** 0.103 (0.1039) (0.0737) Coal 3.271 -5.899 (2.0299) (5.0138) Capital city 20.53* 13.13** (5.1081) (2.5575) Great Britain -31.53 -42.41** (11.6257) (6.8942) France -11.12 -15.18* (4.3521) (4.6013) French Revolution -596.0*** -527.2*** -503.1*** -383.8*** (13.5337) (26.4912) (6.9912) (28.8213) 1750-1799 -12.17 -14.58 (9.2098) (9.1554) 1800-1849 9.590 2.611 (5.9124) (5.3402) Constant 0.967 -5.065 -1.768 5.938 (2.6224) (4.1313) (1.5361) (7.6859) N 753 753 753 753 R2 0.284 0.564 0.627 0.705 adj. R2 0.281 0.559 0.625 0.701
Dependent variable: change in population of given city over 50-year period Standard errors in parentheses
31
Table 5. Factors influencing urban population growth, 1700-1849 - cooperative and non-cooperative innovations
One-stage estimation Two-stage estimation Fixed effects Complete Fixed effects Complete
(1) (2) (3) (4) Cooperative innovations: In given city 51.83*** 38.17** 102.1*** 90.83*** (5.5296) (6.6492) (3.9758) (3.1218) In other cities 3.532* 2.922* 0.871 2.764* (0.9707) (0.7533) (0.8224) (0.8659) Non-cooperative innovations: In given city 2.279 8.120 1.319** 0.441* (2.3540) (3.4387) (0.2139) (0.1207) In other cities -2.205 -1.317 0.244** 0.0785 (2.3433) (1.5391) (0.0318) (0.0780) Population in1700 0.496* 0.259* (0.1130) (0.0898) Coal 3.864 -3.676 (2.3997) (3.9410) Capital city 22.87** 24.23** (4.7055) (3.8073) Great Britain -18.61* -27.15 (6.6384) (12.2823) France 4.978 -15.68 (8.2797) (6.5568) French Revolution -433.6*** -461.5** -332.2*** -230.4** (9.8389) (54.5231) (1.8284) (40.9560) 1750-1799 -1.619 -14.87 (3.0328) (10.0645) 1800-1849 13.43* 3.293 (3.8997) (4.8083) Constant 8.690 -8.811* 0.805 2.785 (6.7874) (2.6612) (2.7685) (7.2483) N 753 753 753 753 R2 0.349 0.581 0.714 0.772 adj. R2 0.345 0.574 0.712 0.768
Dependent variable: change in population of given city over 50-year period
32
Table 6. Robustness: Impact of all innovations on urban population growth
One-stage estimation Two-stage estimation** No. of Core variables Mean FracSigni Frac+ Mean FracSigni Frac+ obs. Great Britain -3.46 0.75 0.5 -9.66 0.75 0.25 16 France -7.38 0.5 0 -12.31 0.5625 0 16 French Revolution -445.67 1 0 -352.60 1 0 16 1750-1749 -4.77 0 0.5 -7.23 0 0.25 16 1800-1849 16.25 0.25 1 10.80 0.25 1 16 Population in1700 0.61 1 1 0.41 0.75 1 16 Tested variables Mean FracSigni Frac+ Mean FracSigni Frac+
Innovations: In same city 26.03 1 1 62.92 1 1 8 In other cities* 1.67 1 1 1.86 1 1 8 Coal 5.63 0 1 1.56 0 0.5 8 Capital city 20.38 1 1 17.57 1 1 8 * of same country.
** using the specifications in Table 3, column (1).
Table 7. Robustness: Impact of cooperative and non-cooperative innovations on urban population growth
One-stage estimation Two-stage estimation** No. of Core variables Mean FracSigni Frac+ Mean FracSigni Frac+ obs. Great Britain -3.98 0.64 0.41 -6.53 0.50 0.38 64 France -2.18 0 0.22 -9.76 0.44 0 64 French Revolution -446.12 1 0 -381.11 1 0 64 1750-1749 -1.87 0.06 0.44 -7.75 0.13 0.25 64 1800-1849 16.84 0.81 1 13.75 0.13 1 64 Population in1700 0.58 1 1 0.52 1 1 64
Tested variables Mean FracSigni Frac+ Mean FracSigni Frac+ Coop. innovations: In same city 27.79 1 1 44.51 1 1 48 In other cities* 2.98 1 1 3.67 1 1 32 Non-coop. innov.: In same city 13.66 0.58 0.83 3.64 0.67 0.88 48 In other cities* -0.22 0 0 0.01 0 0.56 32 Coal 5.03 0.19 1 4.36 0 1 32 Capital city 21.04 1 1 22.94 1 1 32 * of same country.