HAL Id: hal-02922930
https://hal.inria.fr/hal-02922930
Submitted on 26 Aug 2020
HAL is a multi-disciplinary open access
archive for the deposit and dissemination of
sci-entific research documents, whether they are
pub-lished or not. The documents may come from
teaching and research institutions in France or
abroad, or from public or private research centers.
L’archive ouverte pluridisciplinaire HAL, est
destinée au dépôt et à la diffusion de documents
scientifiques de niveau recherche, publiés ou non,
émanant des établissements d’enseignement et de
recherche français ou étrangers, des laboratoires
publics ou privés.
Distributed Contextualization of Biomedical Data: a
case study in precision medicine
Sirine Sayadi, Estelle Geffard, Mario Südholt, Nicolas Vince, Pierre-Antoine
Gourraud
To cite this version:
Sirine Sayadi, Estelle Geffard, Mario Südholt, Nicolas Vince, Pierre-Antoine Gourraud. Distributed
Contextualization of Biomedical Data: a case study in precision medicine. AICCSA 2020 - 17th
IEEE/ACS International Conference on Computer Systems and Applications, Nov 2020, Antalya,
Turkey. pp.1-6. �hal-02922930�
Distributed Contextualization of Biomedical Data:
a case study in precision medicine
Sirine Sayadi1,2, Estelle Geffard2, Mario S¨udholt1, Nicolas Vince2, Pierre-Antoine Gourraud2
1STACK team; IMT Atlantique, Inria, LS2N; Nantes, France; [email protected] 2Centre de Recherche en Transplantation et Immunologie (CRTI);
CHU Nantes, INSERM, University of Nantes; Nantes, France; [email protected]
Abstract—An important aspect of precision medicine consists in patient-centered contextualization analyses that are used as part of biomedical interactive tools. Such analyses often harness data of large populations of patients from different research centers and can often benefit from a distributed implementation. However, performance and the security and privacy concerns of sharing sensitive biomedical data can become a major issue.
We have investigated these issues in the context of a kid-ney transplanted patient contextualization project: the Kidkid-ney Transplantation Application (KITAPP). In this paper, we present a motivation for distributed implementations in this context, notably for computing percentiles for contextualization. We present a corresponding system architecture, motivate privacy and performance issues, and present a novel distributed imple-mentation that is evaluated in a realistic multi-site setting.
Index Terms—contextualization, precision medicine, kidney transplantation, distributed analysis, privacy, percentile
I. INTRODUCTION
Precision medicine strives for new biomedical methods and tools tailored towards the treatment of specific patients. Contextualization is then useful in order to evaluate medical data of individual patients with respect to larger groups of patients with similar characteristics. In particular, it can be used in order to compare patient markers relative to scales representing different severity levels. Clinicians can thus assess the condition of a patient and provide a perspective on her past, present and future state in order to help decide on a monitoring and a treatment [1].
As a recent example, consider the COVID-19 pandemic that has resulted in hundreds of thousands of lives lost and immense social and economic consequences. The dynamics of the spread of infectious diseases is often due to social behavior and puts enormous stress on existing social organizations and health infrastructures. Contextualization, modeling and understanding of statistical data and social behavior (panic, social distancing. . . ) help decision-making on the best treat-ment in order to have a better response to the epidemic at (inter)national levels [2].
We have considered contextualization in the research project KITAPP (the Kidney Transplantation Application) [3], a pre-cision medicine project for health-tracking of patients after kidney transplantations. This new tool aims at addressing the challenges of dynamic management of a complex chronic dis-ease, notably the interaction of clinicians and patients in order
to extend translational digital medicine and help personalized therapeutic decision. This project focuses on etiologically heterogeneous entities which can lead to different symptoms and treatments. It is therefore currently complicated, even for an experienced clinician, to predict a patient’s clinical course and precisely anticipate the safety and efficacy of treatments. KITAPP relies on the contextualization of renal function outcomes (creatinemia, proteinuria. . . ) of a patient of interest (POI) relative to a population of patients of reference (PORs). PORs are based on the identification of subgroups of patients with similar characteristics, such as age, gender and Body Mass Index (BMI).
Our contextualization algorithm consists of two steps. The first corresponds to the selection of a POR sub-population. As part of the second step we apply our modelization al-gorithm and visualize the contextualization of the POI w.r.t. the POR. This aspect of contextualization is performed using percentiles [4] as a major statistical tool that enables a patient to be positioned relative to other patients. A growth curve visu-alization system is proposed by modeling the individual trajec-tory of biological data (renal parameters routinely assessed in clinics) as a function of post-transplant follow-up, compared to the POR sub-population. Similarly, Corson et al. [5] provides a state-of-the-art example which uses percentiles to construct growth curves of pigs for use in biomedical studies.
The KITAPP project is a prototype laying the ground to different collaboration of clinical research currently recruiting patients, notably in two inter/national projects KTD-Innov [6] and EU-TRAIN [7]. So far, percentiles are calculated in a centralized way, only one site gathers all data.
Beyond technical issues, distributed architectures enable more flexible data governance strategies and processes by free-ing them from centralization contraints [8]. Data management of health entities thus promises to be facilitated.
In order to deploy this kind of medical services in larger context, such as nation-wide or large international collab-orations, distributed systems and algorithms for precision medicine have to be provided. Contextualization then has to be performed with respect to large-scale distributed medi-cal databases that are maintained at different sites. Simple centralization schemes are not useful in this context because the necessary data may not be shared due to legal reasons, security/privacy concerns and performance issues. Moreover,
approximate distributed calculations do not fit the requirements of precision medicine either.
In order to contextualize the state of a patient compared to a distributed database, fully-distributed analyses are thus very in-teresting, if they meet requirements of scalability, security and confidentiality [9]. Scheel et al. [10] discusses the importance of the availability, right to privacy and the accessibility of data in distributed biomedical research. These criteria are difficult to satisfy because the statistical significance and accuracy of analyses often directly depend on the number of cases or individuals included in the database.
In the context of distributed software systems and algo-rithms, data sharing and analysis is generally difficult due to governance, regulatory, scientific and technical reasons. Data protection policies, such as the EU General Data Pro-tection Regulation (GDPR) impose well-founded, but strong restrictions on data sharing [11]. Hence, analyses are often only possible “on premise”. Furthermore, researchers and institutions may be averse to lose control over both data and data usages. In addition, huge volumes of data are intrinsically difficult to share or transfer (e.g., cost associated to resource usage, such as computational, storage and network resources). A solution to these problems can be found if a distributed analysis may be performed separately on the premises of the partners as far as sensitive data is concerned and if the global result of the analysis can then be calculated using aggregated, summarized or anonymized data. This principle is similar to but may require more complex algorithms than traditional divide-and-conquer algorithms that can often be distributed in terms of master-worker systems.
In this paper, we present two main contributions:
• We motivate and define requirements for distributed algo-rithms for contextualization in the context of the KITAPP
project.
• We present a novel distributed percentile algorithm for contextualization in the presence of sensitive data in precision medicine.
The rest of this article is organized as follows: Section II presents the Kidney transplantation application (KITAPP), con-textualization algorithms and the need for distributed analyses of these algorithms for precision medicine. Section III presents our distributed algorithm, a corresponding implementation and results of a detailed experimentation. Finally, Section IV summarizes our findings and proposes some future work.
II. THEKIDNEY TRANSPLANTATION APPLICATION
(KITAPP)
Chronic kidney failure affects approximately 10% of the world population and can progressively lead to end-stage kidney disease requiring replacement therapy (dialysis or transplantation). Kidney transplantation is the best treatment for end-stage kidney disease [12]. The one-year survival rate of kidney transplant is now 90% and the graft half-life is about 10 years. Patient follow-up is critical to monitor graft and patient’s health; clinicians have several ways of monitoring kidney function, in particular creatinemia: creatinine level is
measured to assess kidney filtration rate. Modern tools such as KITAPP is a new addition to clinicians way of performing optimal care.
A. KITAPP Overview
Data from approximately 1500 renal transplantation, includ-ing clinical and immunological items, were collected since 2008 as part of the DIVAT cohort.
KITAPPenables personalized contextualization algorithm to be harnessed to compare data trajectories of a given patient (POI) to a sub-population with similar characteristics (POR) selected by filters or distance measures. The information rela-tive to a graft is selected from similar cases at the time of the graft. With the help of clinicians and knowledge of the existing body of research, we defined a set of variables to select the sub-population of reference. The reference sub-population has been defined either by filtering w.r.t. one or several of these variables or by applying a statistical strategy. A statistical strategy performs selection based on a statistical size reduction technique that reduces data from a large dimensional space to data in a smaller dimensional space. In our case, a reference population has been determined based on different statistical methods: nearest neighbor approach (select individuals more similar to a POI) and a clustering approach (select individuals in the same cluster as a POI).
The visualization of contextualized information is done by comparing a POI biological data (creatinemia) and its evolu-tion over time (clinical visits) to a POR that is represented by their median and percentile values.
B. Motivation for Distributed Analyses for KITAPP
Data exchange requirements for medical multi-center/multi-partner collaborations have led to a paradigm shift in medical data sharing system. Traditionally, centralized infrastructures have been used for storing, processing or archiving informa-tion. Since the enactment of the GDPR, these structures are often no longer suitable for collaborative health projects due to restrictions on access to sensitive data. To meet the challenge of harnessing medical data while keeping sensitive data on premise or ensure strong data protection if data is moved, com-putations are often performed today over distributed databases that are linked to a computation integrator that enables a center to interact with and access some data from remote sites. Each clinical center collects, stores and controls their own patients’ data. The founding principle of the architecture is that no data of individuals circulates outside the centers. However, this sharing paradigm is very restrictive and inhibits a large range of potential analyses to be performed - either because sensitive data cannot be appropriately protected or the analysis cannot be performed sufficiently efficient. We are working on more general distributed analysis architectures and implementations that ease collaboration as part of multi-centric research projects, where each center can control and account for their own patients’ data usage even if located remotely.
III. CONTEXTUALIZATION OFDISTRIBUTEDBIOMEDICAL
DATA
In the context of the KITAPPproject, we have worked on the distributed contextualization of parameters of renal activity. In the following we present a distributed algorithm for computing percentile information over data distributed among different sites that shares only small amounts of data and no sensitive data between the sites.
A. Algorithmic principle
The rank of a percentile is defined as follows:
k = P/100 ∗ N (1) where N is the number of values in the data set, P the percentile and k the rank of a given value. The calculation of the value defining a percentile thus requires to first compute k and then identify the corresponding value. Identifying the kth value is difficult and costly in an unsorted array but simple and efficient in an ordered one. Furthermore, gathering all relevant elements necessary to determine a given percentile or first ordering the available values over all sites may result in a large proportion of all values to be moved among sites. Both types of such simple approaches may thus suffer serious issues from the efficiency and data protection points of view. We therefore have investigated algorithms that require few exchanges and sharing of data. We build on the well-known (non-distributed) QuickSelect algorithm (developed by Hoare in 1961 [13]) that permits to select the kth largest element in an unsorted array by partially ordering that array. Similar to QuickSort, QuickSelect partitions an array according to a pivot element that may be arbitrarily chosen; in contrast to the sorting algorithm, QuickSelect recursively partially orders and searches only one of the partitions: the partition which contains the target value. QuickSelect achieves an average complexity of O(n) (and O(n2) in the worst case of an unlucky choice of the pivot element).
B. Distributed implementation
Fig. 1. Collaboration Requirements.
As part of our medical cooperation we are interested in a collaboration structure as illustrated in Fig. 1. The overall analysis is performed on multiple sites, each of which is
operating under coordination of a master site. However, in contrast to many fully data-parallel master-worker schemes our analysis has to observe dependencies among the worker nodes. Saukas and Song [14] have proposed a parallel algorithm for the selection of the smallest element in a set of elements. This algorithm requires few communication and also shares few data. We have used the same algorithmic principle and adapted it to large-scale distributed environments, notably by implementing data exchanges and sharing.
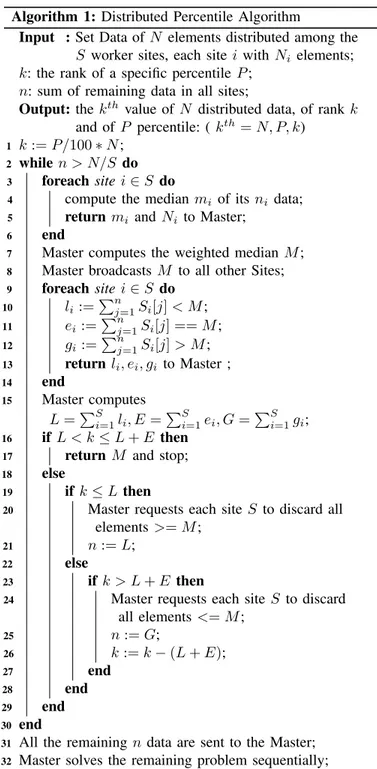
Algorithm 1: Distributed Percentile Algorithm
Input : Set Data of N elements distributed among the S worker sites, each site i with Ni elements;
k: the rank of a specific percentile P ; n: sum of remaining data in all sites;
Output: the kth value of N distributed data, of rank k
and of P percentile: ( kth= N, P, k)
1 k := P/100 ∗ N ; 2 while n > N/S do 3 foreach site i ∈ S do
4 compute the median mi of its ni data; 5 return mi and Ni to Master;
6 end
7 Master computes the weighted median M ; 8 Master broadcasts M to all other Sites; 9 foreach site i ∈ S do 10 li :=P n j=1Si[j] < M ; 11 ei:=P n j=1Si[j] == M ; 12 gi:=P n j=1Si[j] > M ; 13 return li, ei, gi to Master ; 14 end 15 Master computes L =PS i=1li, E =P S i=1ei, G =P S i=1gi; 16 if L < k ≤ L + E then
17 return M and stop; 18 else
19 if k ≤ L then
20 Master requests each site S to discard all
elements >= M ;
21 n := L; 22 else
23 if k > L + E then
24 Master requests each site S to discard
all elements <= M ; 25 n := G; 26 k := k − (L + E); 27 end 28 end 29 end 30 end
31 All the remaining n data are sent to the Master; 32 Master solves the remaining problem sequentially; 33 return;
Algorithm 1. The master first calculates the rank k of the percentile relative to N , the total size of the data over all hospitals. Each worker starts by sending the size of their data Ni as well as the local median mi. Then the master calculates
the weighted median M and broadcasts M to all workers. Each worker then calculates li, ei, giwhich correspond, respectively,
to the number of values smaller, equal and greater to M and returns them to the server, after which the server calculates the respective sums L, E and G. If (L < k <= L + E) then the result corresponds to E. If (k <= L) then the master asks each worker to discard all the values smaller than E, n is set to L. If (k > L + E) then the master asks each worker to discard all the values greater than M and n is set to G, k to k − (L + E). This process is repeated until (n <= N/S). Finally, if we do not arrive at the solution after this parallel analysis, the server begins the same analysis sequentially on the rest of the data n.
C. Experimentation
We have implemented our algorithm and a driver program to deploy and executed it in a grid-based environment whose nodes may consist of individual machines but also full-fledged clusters. Note that this environment closely mimics the architecture of real medical cooperations whose different partner sites form a grid and individual partners may dispose of computational clusters themselves. The distributed algorithm has been implemented using Python consisting of 840 LoC; its deployment and execution using an, in principle, arbitrary number of worker nodes just requires eight commands on the Grid’5000 infrastructure. We have tested our algorithm extensively and successfully by comparing its result to its sequential counterpart.
We have applied the percentile contextualization analysis to real validated transplantation data available from the French DIVAT database [15]. In order to support the KITAPPproject, we have explored the (distributed) contextualization of cre-atinine levels in patients. So we took creatD as a tracking variable for contextualization of the creatinine level in patients. After extracting relevant data for this analysis, we obtained a file of 11,028 values. We divided this file into several files of different sizes for distribution over different numbers of worker sites.
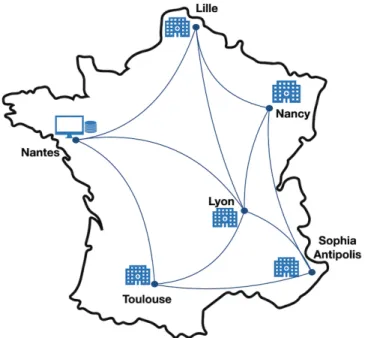
D. Geo-distributed infrastructure deployment
To carry out our experimentation, we used the Grid’5000 platform [16] as a real-world grid and cluster-based experi-mentation environment. Grid’5000 is an infrastructure dedi-cated to CS research in the fields of large-scale distributed systems, high performance computing and networking. For each experiment, we have reserved machines which are used as workers as shown in Fig. 2 located in five different French cities. These machines contain the data stored as CSV files as well as the worker code. We have also reserved a machine as master (server in computational terms) which will perform the analysis by communicating with the workers using socket communication without having access to the data of the CSV
Fig. 2. Experimentation with Grid’5000 testbed.
Fig. 3. Contextualization of creatinine level (mol/l).
files and generating the percentile result at the end of analysis, thus enabling the visualization of the creatinine levels of a given patient compared to the others.
Fig. 3 shows our results for creatinine level contextualiza-tion of patients computed on five worker sites. This figure shows the state of creatinine level in patients compared to others based on five percentile results (3rd, 10th, 25th, 50th
and 97th percentile). For example, the 25th and the 50th percentile correspond to people who have a creatinine level of respectively 61(mol/l) and 77(mol/l) compared to the population distributed over the five sites.
E. Evaluation
We have evaluated our system with respect to two types of parameters: performance-related parameters (different number of sites, different data sizes, execution time) and parameters
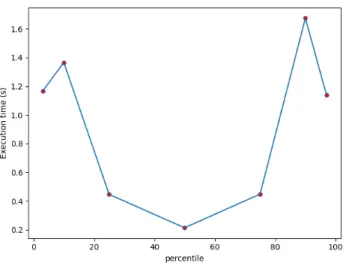
Fig. 4. Execution time for 5 sites.
related to data sharing (proportion of shared data by percentile, data size and number of sites).
Execution time by percentile. We have measured the ex-ecution time for each percentile performed. Fig. 4 presents the time to complete each percentile for the case of 5 sites. the x-axis shows the calculated percentiles and the y-x-axis shows the time needed to calculate each percentile. The 50th percentile takes slightly less time compared to the other percentiles (0.2s less) because we can sometimes dispense with the sequential phase of the algorithm in this case. This shows the interest of distributed analyses not only for reasons of confidentiality and privacy but also for reasons of performance.
Scalability by number of sites. We have also evaluated the execution time of our proposed approach with respect to different numbers of worker sites by partitioning a fixed data set on 3, 5, 7, 10 and 15 sites. Fig. 5 presents the execution time of 3rd, 10th, 25th, 50th, 75th and 90th percentiles for
data partitioned on 3, 5, 7, 10 and 15 sites. The figure shows that the percentile calculation time increases with the increase in the number of sites but it always remains very small and does not exceed 3.2s for the calculation of 90thpercentile on 15 sites for a data set of size 11028.
Scalability by data size. We have also evaluated the efficiency of our proposed algorithm on a large number of data and a large size of data compared to the previously mentioned set. Table I shows the number of data and the data sizes used in these experiments.
TABLE I
NUMBER OF DATA FOR EACH SIZE
Size of global data (MB) Number of global data points
0.131 11028
0.363 110280
3.6 1102800
36.3 11028000
363 110280000
Fig. 6 shows the execution time of our approach to calculate
Fig. 5. Execution time by clients number.
Fig. 6. Execution time per 50thpercentile by data size.
the 50th percentile for the case of 3 sites with different sizes
of global data. We can notice that the execution time of our algorithm increases linearly in the data size while yielding exact results compared to a centralized calculation.
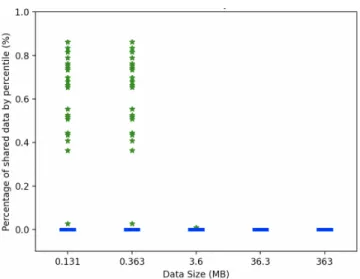
Privacy by percentage of shared data. Another important parameter in the medical context is the amount of data shared, in particular as part of the sequential phase of our algorithm. We carried out two experiments in order to assess the percentage of data shared by increasing the overall size of the data or the number of sites participating in the analysis.
The results are presented in Figures 7 and 8 in form of box-and-whisker diagrams that provide a detailed vision on the distribution of shared data, making explicit medians, lower and upper quartiles (as boxes) and outliers (as green stars). The figures show that the percentage of shared data never exceeds 0.89% compared to all the data for all the sites, which is negligible especially because shared data only consists of aggregate values (medians) that do not match any sensitive data that can identify a patient. The median of the proportion
Fig. 7. Percentage of shared data by data size.
Fig. 8. Percentage of shared data by number of sites.
of shared data is close to 0, which explains that in most cases the algorithm only performs parallel computations without requiring recourse to sequential solving steps and thus without any sharing of the data. The two figures show some outliers between 0.3% and 0.89% especially in all cases when the number of sites participating in the analysis is increased. Furthermore, Fig. 7 shows that, if we increase the size of the data, our algorithm will be even more efficient in terms of percentage of shared data which is decreasing until it is almost 0.
The accuracy of our algorithm is preserved even if we increase the number of distributed sites and the size of data while keeping the confidentiality of the data with the distributed model by keeping a percentage of the shared data which does not exceed 0.89% compared to global data.
IV. CONCLUSION ANDFUTURE WORK
Contextualization is an important tool that allows clinicians and medical experts to assess the state of data and help
decision-making with an interpretation of statistical analyses of the data. In order to respect the confidentiality of data and perform this type of analysis on a large scale, we have proposed in this paper a novel distributed contextualization algorithm for percentiles that requires only few sharing of data between sites. We have motivated our approach in the context of real-world contextualization in the domain of medical transplantations. We have carried out realistic experiments over real data in a realistic grid-cluster based distributed environment. Our experiments have shown accurate results compared to a centralized contextualization analysis with very good performance results and scalability in terms of system size and execution time. Finally, we have shown that our algorithm requires only very little data sharing that does not involve sharing of individual sensitive data.
As future work in distributed contextualization, we will focus on distributed factor analysis of incomplete data with mixed quantitative and qualitative variables from different sources.
ACKNOWLEDGMENT
This work is supported by KTD-innov Project. The ex-periments presented in this paper were carried out using the Grid5000 experimental testbed, see www.grid5000.fr. It has also been supported by the EU’s Marie Skłodowska-Curie grant agreement no. 846520.
REFERENCES
[1] P. Gourraud, R. Henry et al.: “Precision medicine in chronic disease management: the MS BioScreen,” Ann Neurol, 76(5): 633–642, 2014. [2] A. Jarynowski, M. Kempa et al.: “Attempt to Understand Public Health
Relevant Social Dimensions of COVID-19 Outbreak in Poland,” Society Register, 4(3): 7-44, April 2020.
[3] C. Herve, N. Vince et al.: “P218 The kidney transplantation application (KITAPP): A visualization and contextualization tool in a kidney graft patients’ cohort,” Human Immunology, Volume 78, Page 216, 2017. [4] R. Hyndman and Y. Fan, “Sample quantiles in statistical packages,” The
American Statistician. 50 (4): 361–365, 1996.
[5] AM. Corson AM, J. Laws et al.,“ Percentile growth charts for biomedical studies using a porcine model,”. Animal : an International Journal of Animal Bioscience, 2(12):1795-1801, 2008.
[6] KTD-Innov. www.ktdinnov.fr (visited on 15/06/2020). [7] EU-TRAIN. eu-train-project.eu .
[8] P. Brous, M. Janssen et al.: “Coordinating Decision-Making in Data Management Activities: A Systematic Review of Data Governance Principles,” Int. Conf. on Electronic Government, 2016, Springer. [9] F. Boujdad, A. Gaignard et al.: “On Distributed Collaboration for
Biomedical Analyses”; WS CCGrid-Life, 2019.
[10] H. Scheel , H. Dathe, T. Franke, T. Scharfe, T. Rottmann, “A Privacy Pre-serving Approach to Feasibility Analyses on Distributed Data Sources in Biomedical Research,” Studies in Health Technology and Informatics, 267:254-261, 2019.
[11] GDPR. https://eur-lex.europa.eu/legal-content/FR/ TXT/HTML/?uri=CELEX:32016R0679(visited on 13/06/2020). [12] N. Hill, S. Fatoba et al: “Global Prevalence of Chronic Kidney Disease
- A Systematic Review and Meta-Analysis,” PLoS One. 2016. [13] Hoare, “C. A. R. : Algorithm 65: Find,” Comm. ACM. 4 (7): 321–322,
1961.
[14] E.L.G. Saukas, S. W. Song: “A Note on Parallel Selection on Coarse-Grained Multicomputers”; Algorithmica 24: 371-380, 1999.
[15] Divatfrance. www.divat.fr (visited on 15/06/2020).
[16] D. Balouek, A. Carpen Amarie, G. Charrier et al.: “Adding virtualization capabilities to the Grid’5000 testbed,” in Cloud Computing and Services Science. Springer, 2013.