HAL Id: hal-01135609
https://hal-mines-paristech.archives-ouvertes.fr/hal-01135609
Submitted on 25 Mar 2015HAL is a multi-disciplinary open access archive for the deposit and dissemination of sci-entific research documents, whether they are pub-lished or not. The documents may come from teaching and research institutions in France or abroad, or from public or private research centers.
L’archive ouverte pluridisciplinaire HAL, est destinée au dépôt et à la diffusion de documents scientifiques de niveau recherche, publiés ou non, émanant des établissements d’enseignement et de recherche français ou étrangers, des laboratoires publics ou privés.
long-term policy analysis using TIAM-FR
Sandrine Selosse, Olivia Ricci, Nadia Maïzi
To cite this version:
Sandrine Selosse, Olivia Ricci, Nadia Maïzi. Fukushima’s impact on the European power sector: A long-term policy analysis using TIAM-FR. [Research Report] Working Paper 2012-04-07, Chaire Modélisation prospective au service du développement durable. 2013, pp.24 - Les Cahiers de la Chaire. �hal-01135609�
Les Cahiers de la Chaire
Chair
e Modé
lisa
tion pr
ospectiv
e au se
rvice du dé
veloppe
me
nt dur
able
Fukushima’s impact on the European power sector:
A long-term policy analysis using TIAM-FR
Sandrine SELOSSE, Olivia RICCI and Nadia MAÏZI
October 2012
Fukushima’s impact on the European power sector:
A long-term policy analysis using TIAM-FR
Sandrine Selosse, Olivia Ricci and Nadia Maïzi
MINES ParisTech, Centre for Applied Mathematics Rue Claude Daunesse, CS 10207, 06904 Sophia Antipolis, France
Contact: sandrine.selosse@mines-paristech.fr
Abstract
The accident in Fukushima, Japan, in March 2011 has reactivated the discussion on how to meet ambitious climate mitigation objectives as some European countries reconsider the contribution of nuclear power in their energy mix. This study evaluates the impact of nuclear power reduction in Europe on the electricity mix under carbon emission reduction scenarios while considering the availability of carbon capture and storage technological options. The potential cost of carbon reduction is also addressed using the bottom-up optimization model TIAM-FR. The results suggest that CCS technologies constitute an interesting option in a case of stringent climate targets and limited nuclear electricity. However, the unavailability of CCS technologies induces a significant increase in carbon cost to achieve the climate policy.
Keywords
Energy modeling ; European Union policies ; Climate change ; TIAM-FR; Nuclear phase out; Carbon Capture and Storage, Bioenergies
Acknowledgment
This research was supported by the Chair Modeling for sustainable development, driven by MINES ParisTech, Ecole des Ponts ParisTech, AgroParisTech, and ParisTech, supported by ADEME, EDF, RENAULT, SCHNEIDER ELECTRIC and TOTAL.
Introduction
In March 2011, the Fukushima Daiichi nuclear accident in Japan sparked international debate on the future of nuclear energy and offered an opportunity to organize energy supply in a more sustainable manner (Netzer and Steinhilber, 2011). In European countries, it has led to contrasting energy policy responses. Several countries have made the decision to abandon the production of nuclear energy, while others have re-affirmed their intention to maintain or increase their nuclear capacity. Of the 15 European
countries that presently possess nuclear power1, Germany, Switzerland, and Belgium
have been faced with strong public reaction leading them to reconsider the role of nuclear power in their energy mix. Germany has shut down eight nuclear power plants and the remaining nine operating plants will be phased out by 2022. The Swiss government has announced its intention to close its five nuclear plants from 2019 to 2034. In July 2012, the Belgian government confirmed the scheduled phase-out of two of the country’s seven reactors. In contrast, other countries continue to support nuclear power production. France has decided to perform European Union stress tests on its plants. The United Kingdom, Finland, Bulgaria, Hungary and Romania affirmed their commitment to nuclear power by announcing plans to build new reactors (World Energy Council, 2011). The long-term implications of the Fukushima incident on the use of nuclear power remain uncertain. It may have the effect of slowing down growth, but it does not seem to reverse it. According to the International Atomic Energy Agency, nuclear energy will still represent a significant share in the world’s energy mix at around 2030, with an annual growth potential in the range of 2.2%. This evolution has been slightly reduced, but remains significant (IAEA, 2011). At European Union (EU) level, the Fukushima accident has led to a slight modification in nuclear policy assumptions in the European Commission’s energy roadmap. While the pre-Fukushima reference scenario assumed a nuclear share of 26.4% in power generation by 2050, the post-Fukushima scenario now expects a constant share of 20.5% in 2030 and 2050 (Vasakova, 2011; Blohm-Hieber, 2012). These assumptions will have an impact on the structure of the electricity mix as the incident leads countries to make structural technological choices in the very long term. Moreover, climate change mitigation policies will also deeply influence the evolution of the future European electricity mix.
1
France , Germany, United Kingdom, Sweden, Spain, Belgium, Czech Republic, Switzerland, Finland, Bulgaria, Hungary, Slovakia, Romania, Slovenia, Netherlands.
The European Union has set ambitious targets in terms of greenhouse gas emissions (GHG) reduction. The objective is to reduce GHG emissions by 20% by 2020 and 80%-95% by 2050 compared to 1990 levels. In order to meet those objectives and to satisfy increasing energy demand at a reasonable cost, low carbon electricity generation technologies, such as high efficient natural gas combined cycle power plants, nuclear power, renewable energies and carbon capture and storage technologies (CCS) on coal and natural gas plants will compete in the electricity mix (EC, 2012). Research on CCS is active, involving about 80 CCS projects worldwide with 19 in Europe, of which 15 are applied to the power sector (global CCS institute). The process involves separating CO2 from power plants and transporting it to permanent storage in secure locations, such as deep saline aquifers and depleted oil and gas fields (for a CCS technical review see IPCC, 2005). CCS can also be applied to biomass plants (BECCS) to provide a source of carbon negative electricity. Interest in BECCS has grown rapidly as it has the potential to offer the permanent net removal of carbon dioxide (CO2) emissions from the atmosphere thanks to sustainable biomass harvesting practices and the permanent
geological storage of CO22. Empirical studies using bottom-up energy models show that
BECCS has an important role to play in the future electricity mix (Azar et al., 2006, 2010; Katofsky et al., 2010; Luckow et al., 2010; Ricci and Selosse, 2012; van den Broek et al., 2011; van Vuuren et al., 2007). Therefore, CCS technologies for coal, natural gas and biomass power plants could be attractive options to replace nuclear power and drastically reduce emissions in Europe.
In this context of global climate change and reduced social and political acceptance of nuclear power expansion in some European countries, we use the French version of the TIMES Integrated Assessment Model (TIAM-FR) to evaluate the impact of reducing and even slowly phasing out nuclear power on the evolution of the electricity mix, while considering the availability of CCS and BECCS technological options. This paper attempts to provide some answers to the following question: Are CCS on fossil and biomass power plants good substitutes for nuclear energy to decarbonize the electricity sector? What is the cost of nuclear power reduction and nuclear phase-out in Europe under an emissions reduction policy?
2
Biomass absorbs CO2 from the atmosphere through the process of photosynthesis and releases
it during combustion. If the released CO2 can be captured and stored permanently it then creates a situation of “negative CO2 emissions”.
Well before the Fukushima accident, several studies analyzed the effects of nuclear phase-out on electricity prices and carbon emissions. They observed a rise in electricity prices and costs associated with welfare losses, a decline in electricity exports and a rise in carbon emissions due to a shift from nuclear energy to fossil fuel power plants (Hoster 1998; Nakata, 2002). Nevertheless, the current environmental context of reducing emissions should also be taken into account when considering a possible nuclear phase-out as well as the possible deployment of carbon capture and storage technologies. Under a stringent climate scenario, models tend to favor the widespread deployment of nuclear energy. Therefore, boundaries on the expansion of nuclear power result in an increase in the system’s economic cost. When CCS is available, studies show that it should be widely implemented to decrease the cost of reaching low mitigation targets, as it appears to be a good substitute for nuclear energy (McJeon et al, 2011; Mori, 2012; Tavoni and van der Zwaan, 2011). The analysis presented here is a contribution to this subject with a focus on Europe. It highlights CCS and BECCS power’s potential to help mitigate climate change while dealing with severe resistance to nuclear expansion.
The paper is organized as follows: Section 1 presents the current picture of nuclear power capacity and CCS projects in Europe. Section 2 describes the TIAM-FR model and the policy scenarios. Section 3 presents and discusses the results of the long-term modeling. The conclusion summarizes the main results and the limits of our analysis.
1. A panorama of nuclear capacity and CCS projects in Europe 1.1. Nuclear power capacity: current picture
Europe has gone through three nuclear construction waves, in the 1960s, the 1970s, and the biggest in the1980s. In 2012, 15 countries in Europe operate 137 reactors with a total installed capacity of 125155 MW; this represents about one third of the world’s total capacity (table 1, IAEA-PRIS, 2012). Since the Fukushima accident, in Europe only Germany has directly shut down 8 of its power plants. Its installed capacity went from 20490 MW in 2011 to 12068 MW in 2012. In 2011, the largest nuclear producer was
France (423 TWh), followed by Germany (102 TWh)3, the United Kingdom (62 TWh),
Sweden (58 TWh), Spain (55TWh) and Belgium (46 TWh). Nuclear energy accounted for 77.7 % of France’s total electricity generation and 39 % or more in Sweden, Belgium, Switzerland, Hungary, Slovakia and Slovenia (table 1).
Table 1: Nuclear capacity in Europe
Countries Reactors operable (Nb)
Total net electricity capacity (MW) September 2012 Nuclear Electricity supplied (TWh) 2011 Nuclear share (%) 2011 France 58 63,130 423.5 77.7 United Kingdom 16 9,246 62.6 17.8 Sweden 10 9,378 58.1 39.6 Germany 9 12,068 102.3 17.8 Spain 8 7,560 55.1 19.5 Belgium 7 5,927 45.9 54 Czech Republic 6 3,766 26.7 33 Switzerland 5 3,263 25.7 40.8 Finland 4 2,736 22.3 31.6 Hungary 4 1,889 14.7 43.2 Slovakia 4 1,816 14.3 54 Bulgaria 2 1,906 15.3 32.6 Romania 2 1,300 10.8 19 Netherlands 1 482 3.9 3.6 Slovenia 1 688 5.9 41.7 Source: IAEA-PRIS (2012)
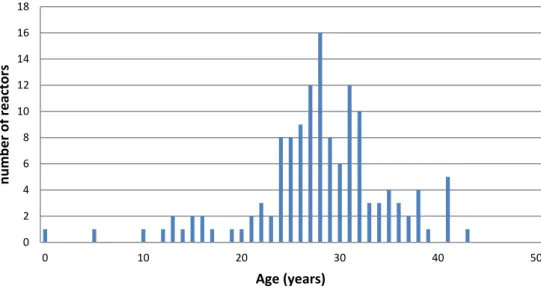
One important determinant of the future of nuclear energy in Europe is the age of the current operational nuclear reactors (van der Zwaan, 2008). Figure 1 shows the age distribution of European power plants by number of years in operation. The average age of European operating nuclear power plants is 28 years.
Figure 1: Number of nuclear power plants in Europe by years in operation
Source: IAEA-PRIS (2012)
In Europe, the initial projected lifespan of nuclear power plants is usually 30 to 40 years. However, some nuclear utilities envisage a reactor lifetime extension of over 40 years and even up to 60 years. This scenario is less likely since Fukushima, as many questions
0 2 4 6 8 10 12 14 16 18 0 10 20 30 40 50 number of reactors Age (years)
regarding safety upgrades, maintenance costs, and other issues need to be addressed more carefully (Worldwatch institute, 2011). Moreover, the French Nuclear Safety Authority (ASN) evaluated on a reactor-by-reactor basis whether a unit could operate for more than 30 years and concluded that the issue of lifetimes beyond 40 years was irrelevant. Therefore, if we assume nuclear phase-out in Europe (investment in new nuclear power plants is not allowed and the lifespan of the plant is fixed at 40 years), 26% of nuclear power plants will be shut down by 2020, 88% by 2030 and 99% by 2050.
1.2. CCS projects
If CCS is to become an essential climate change mitigation option, it would need to grow from megatons to gigatons (Herzog, 2011). The challenge for the CCS industry is to demonstrate the entire chain at the commercial stage, from the capture of CO2 to its injection into suitable storage sites. In 2011, there were eight large-scale projects in operation around the world and six under construction. This represents a total CO2 storage capacity of 33 megatons per year (global CCS institute). In Europe, only two CCS projects were actually operating among the 19 projects. The Sleipner gas-processing project in Norway started in 1996. About 1 Mt of CO2 is captured per year using pre-combustion technology and stored in a deep saline aquifer in the North Sea. The second operating project is the Snøhvit project. This is the first petroleum production plant in the Barents Sea. Gas production started in 2007 and CO2 capture, using amine technology, started in 2008. About 700,000 tons of CO2 are injected into an offshore deep saline aquifer. The majority of these projects are related to power generation (15 projects). Six projects are located in the UK, three in the Netherlands and one each in Spain, Italy, Norway, Bulgaria, Poland and Romania (for a list of the projects see global CCS institute). Half of the storage will be located offshore, either in deep saline aquifers or in depleted oil and gas reservoirs. There is currently one project injecting CO2 from a biotic source (an ethanol plant) located in Texas, Unites States. Several BECCS projects, mainly in the ethanol and pulp and paper sectors, are being evaluated or under construction worldwide (Biorecro, 2011). In the power sector, most coal and natural gas power facilities could substitute some or all of their fossil fuel feedstocks with biomass. We assume in the study that co-firing and full biomass plants are available technologies
to mitigate climate change. CCS seems to be a promising technology to reduce CO2
emissions in Europe, but to scale up this technology, key issues need to be addressed, such as decreasing its cost, large-scale transport infrastructure, legal and regulatory issues, and storage uncertainties (Herzog, 2011).
2. TIAM-FR description and policy scenarios 2.1. TIAM-FR model
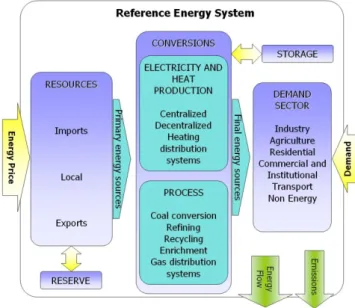
TIAM-FR is the French version of the TIMES Integrated Assessment Model, a widely used, linear programming TIMES family model developed under the IEA’s Energy Technology Systems Analysis Program (ETSAP). TIAM-FR is a bottom-up optimization model. It depicts the world energy system with a detailed description of different primary energy forms, existing and future technologies characterized by their economic and
technological parameters4, and end-use sectors that constitute the Reference Energy
System (RES) (Figure 2). Each primary energy form is extracted from multiple layers of reserves (fossil, biomass) or from resource potential (wing, hydro, geothermal, etc.) each with a potential and a specific unit cost. This constitutes a supply curve for each energy
form. Each energy demand is exogenously determined by the modeler5.
Figure 2: Synthetic view of the reference energy system
The development of the energy system can be analyzed in a short-, medium- and long-term perspective up until the year 2100. Our analysis focuses on the period 2005-2050. TIAM-FR is geographically integrated into 15 global regions, but the study only takes
Europe into consideration (Eastern Europe (EEU)6 and Western Europe (EU-15,
Iceland, Malta, Norway and Switzerland; (WEU)). TIAM-FR is a linear-programming
4 Investment cost, fixed and variable costs, availability factor, efficiency, lifetime, discount rate, etc.
5
If desired, energy demand can be endogenously calculated via price elasticities.
6 EEU includes Albania, Bosnia-Herzegovina, Bulgaria, Croatia, Czech Republic, Hungary, Macedonia, Poland, Romania, Slovakia, Slovenia and Yugoslavia.
approach in which the technical optimum is computed by minimizing the discounted global cost of the energy system, on the time horizon. For each region, it computes a total net present value of the stream of annual costs, discounted to a selected reference year. These regional discounted costs are then aggregated into a single total cost which is the objective function to be minimized by the model while satisfying numbers on constraints.
TIAM-FR integrates several carbon capture and sequestration technologies on fossil or bioenergy resources. The purpose of the capture process is to get a concentrated stream of almost pure CO2 at high pressure. Three modes of capturing CO2 from fossil fuels (coal, oil, natural gas) are retained: 1) a post-combustion mode using a variety of processes, such as reactive absorption or membranes, 2) a pre-combustion mode
converting chemical energy fuel into H2, followed by simultaneous low-cost carbon
separation and 3) an oxy-combustion mode characterized by limited costs of CO2
separation but necessitating O2 supply. For bioplants and co-firing plants, two capture
technologies are considered: pre-combustion capture for the biomass gasification process, and post-combustion capture for the biomass direct combustion process. For each technology, economic parameters are entered, such as capital costs incurred for investing and dismantling processes, operation and maintenance costs, efficiency, and the date the technology will enter the market. Regarding carbon transport, investment costs represent about 90% of the total cost of transport, and a cost of 10$/tCO2 is assumed in the model for Europe.
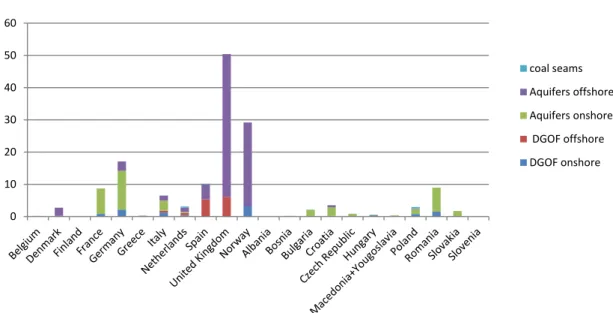
CO2 can be stored in depleted oil and gas fields, deep saline aquifers and deep unmineable coal seams. Theoretical storage capacities are indicated by region with a distinction between onshore and offshore. Cumulated global storage capacities are 13,900 Gt of CO2. Saline aquifers offer by far the largest storage capacity with 11,930 billion tons of CO2. In Europe, we have identified with the greatest possible accuracy the state of data storage capacity in each country. Based on the most pessimistic assumptions of the Geocapacity report (2009), a cumulated total capacity of 150 Gt of CO2 was retained for Europe, where 128 GtCO2 are located in Western Europe and 22 GtCO2 in Eastern Europe. 65% of the storage capacities are located offshore. The distribution of reservoirs is uneven across countries. The leading countries in terms of potential are the United Kingdom (50.4 Gt), Norway (29 Gt), Germany (17 Gt) and Spain (10 Gt) (figure 3).
Figure 3: Storage capacities in Europe
Source: Geocapacity (2009), Energy technology Institute (ETI, 2012) for the United Kingdom and Energy/Geological survey of the Netherlands (EGSN, 2012) for the Netherlands
Storage costs depend on the capacity of the reservoir and the number of injection wells. Based on the costs of the Zero Emissions Platform (the European Technology Platform for Zero Emission Fossil Fuel Power Plants, ZEP), the investment costs assumed are the following: 3$/tCO2 for onshore depleted oil and gas fields and 7$/tCO2 for offshore, 5$/tCO2 for onshore aquifers and 15$/tCO2 for offshore and 5$/tCO2 for coal seams.
2.2. Scenario definitions
Different scenarios are built to analyze the impact on the evolution of the electricity mix of European emission reduction targets, nuclear policy recommendations formulated in the latest EU roadmap 2050, and possible nuclear phase-out.
- BAU scenario: A baseline business-as-usual scenario without any emission
constraint is calculated first. In this reference scenario, no climate and energy policies are assumed. This scenario outlines some key patterns in the evolution of the European energy system, as represented in TIAM-FR.
- EU_preFuku: This scenario discusses the changes induced by a combination of a
stringent environmental and nuclear policy, as announced in its roadmap. In this
scenario, European CO2emissions must decrease by 20% by 2020 and 80% by
0 10 20 30 40 50 60 coal seams Aquifers offshore Aquifers onshore DGOF offshore DGOF onshore
2050 compared to 1990 levels7, and nuclear energy is exogenously fixed to
represent 26.5% of electricity generation in 2050. Moreover, global CO2 emissions are reduced by 50% in 2050 compared with 2005 levels in order to be consistent with the 2°C objective.
- EU_postFuku: The environmental constraint is the same as in the previous
scenario (EU_preFuku). In line with the post-Fukushima scenario developed in the European Roadmap 2050, nuclear energy is exogenously fixed to represent 20.5% of electricity generation in 2030 and 2050, instead of 26.5% in the pre-Fukushima scenario.
To discuss alternative development paths of the electricity system, we investigate two other scenarios with constraints on technology availability (EU_NoNuclear and EU_NoCCS):
- EU_NoNuclear: The environmental objective is the same as in EU_postFuku
and EU_preFuku. However, a nuclear electricity slowdown in Europe is studied. According to the panorama on nuclear power in Europe (presented in section 1), we assume that investments in new nuclear power plants are not allowed during the time period. The lifespan of nuclear power plants is 40 years, so existing nuclear power plants close at the end of their lifetime.
- EU_NoCCS: Due to the substantial uncertainties regarding the future
deployment of CCS mentioned in section 1, we also consider a case where carbon capture and storage is not available throughout the time horizon. Climate constraints, however, are those expressed in the pre- and post-Fukushima scenarios.
3. Results
3.1. European emissions
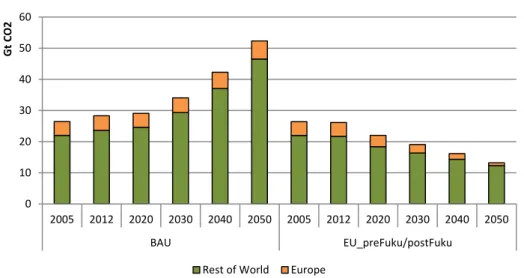
Global CO2 emissions rise from 26 Gt in 2005 to 52 Gt in 2050 in the BAU scenario, i.e. a growth rate of 98%, while European CO2 emissions increase from 4.4 Gt to 5.8 Gt over the same period, i.e. a growth rate of 32% (Figure 4). European CO2 emissions represent 17% of global CO2 emissions in 2005 and 11% in 2050. This result is
7
This carbon constraint represents the lowest CO2 mitigation target by 2020 put forward by Europe to UNFCCC for the Copenhagen Agreement in January 2010, and by 2050 as expressed in its Roadmap 2050.
explained by the growing share of China (from 18% of global CO2 emissions in 2005 to 31% in 2050) and India (from 4% to 7%) in the release of carbon emissions. The USA follows the same pathways as Europe, with their CO2 emissions representing 14% of global emissions in 2050 compared to 22% in 2005.
Figure 4: CO2 emissions (Gt)
In the climate constraint scenarios (EU_preFuku as in EU_postFuku), where world CO2 emissions are reduced by 50% in 2050 (by comparison with 2005) and EU emissions decrease by 20% in 2020 and 80% in 2050 (by comparison with 1990), EU emissions
represent 7% of the world’s CO2emissions, i.e. 0.9 Gt of CO2 in 2050. China, the
Middle East and the USA represent 30%, 18% and 14% respectively of global emissions in 2050.
3.2. European power generation
In the BAU scenario, 70% of electricity is produced by fossil power plants (66% from coal and 4% from oil and gas). The climate constraint induces a significant change in the structure of the electricity mix in 2050 to move to a low-carbon society (figure 5). The direct effect is a strong reduction of the production of electricity by coal and gas power plants without CCS. Indeed, this stringent environmental target induces a new fuel/technology choice in favor of CCS deployment. By 2050, 38% of European electricity is produced by fossil and bio power plants with a capture technology in EU_preFuku and 43% in EU_postFuku, as the nuclear share is constrained to be reduced in the new nuclear policy. The low carbon constraint also induces a significant development of renewable energy. This represents 26% of the European power mix in
0 10 20 30 40 50 60 2005 2012 2020 2030 2040 2050 2005 2012 2020 2030 2040 2050 BAU EU_preFuku/postFuku Gt CO2 Rest of World Europe
2050 in EU_preFuku and EU_postFuku scenarios compared to 1% in the BAU scenario.
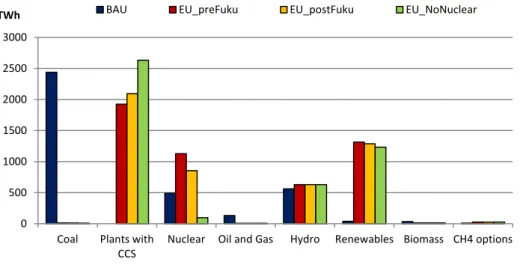
Figure 5: European power generation (TWh) in 2050
It is interesting to note that the post-Fukushima nuclear policy, which shows a lower share of nuclear electricity in Europe in the future (EU_postFuku scenario), involves an increase in the number of carbon capture technologies on power plants. So, CCS technologies appear to be a potential substitute for nuclear power when a stringent carbon constraint is applied, and more so than renewable energies.
Figure 6: European power generation (TWh) in 2050 in contrasted scenarios
This technological choice is all the more favored in a scenario where nuclear power generation is no longer deployed in the time horizon: the EU_NoNuclear scenario.
0 500 1000 1500 2000 2500 3000
TWh BAU EU_preFuku EU_postFuku
0 500 1000 1500 2000 2500 3000 Coal Plants with CCS
Nuclear Oil and Gas Hydro Renewables Biomass CH4 options
Indeed, the share of European electricity produced by plants with CCS reaches 57% in 2050 in EU-NoNuclear (Figure 6). Renewable electricity represents 27% of European power generation in 2050 in EU_NoNuclear. The share of hydroelectricity remains fairly constant, representing 14% instead of 13% in the EU_postFuku scenario.
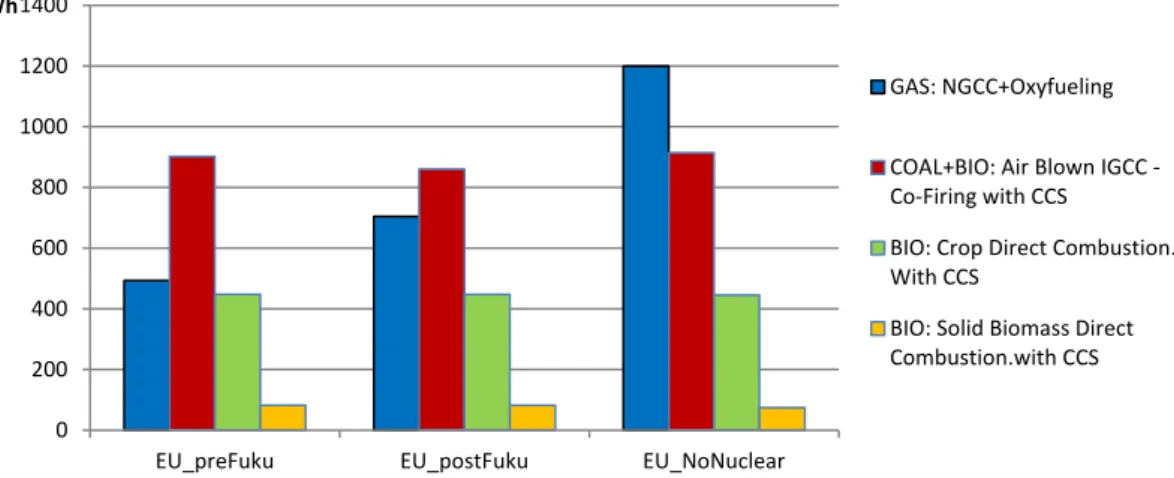
A focus on power plants with carbon capture shows that despite the potential of negative emissions induced by BECCS, fossil plants remain dominant in Europe (Figure 7).
Figure 7: European power generation (TWh) by plant with carbon capture in 2050
Gas represents 26% and 34% of power plants with CCS in 2050 in EU_preFuku and EU_postFuku respectively, and reaches 46% in EU_NoNuclear. Coal is also largely solicited but associated with biomass energies in co-firing IGCC plants with CCS. These represent 47% and 41% respectively in pre- and post-Fukushima scenarios and 35% in the scenario expressing a progressive phase-out of nuclear in Europe. In these co-firing power plants, biomass represents a maximum of 20% of the energy input to generate electricity.
Moreover, it is interesting to note that the less nuclear energy deployed, the more gas solicited to generate electricity. This situation is accentuated in the case of shutdown of nuclear power production in 2050 in EU_NoNuclear, where electricity from gas plants with CCS represents 46% of the plants with CCS. They represent 26% of the European power mix against 14% in the EU_postFuku scenario and 10% in the EU_preFuku scenario. Coal and biomass plants with CCS produce 35% of the electricity generated by plants with CCS in the EU_NoNuclear scenario, thus less than in the pre-and post- Fukushima scenarios. The share of bioplants with CCS significantly decreases in the mix
0 200 400 600 800 1000 1200 1400
EU_preFuku EU_postFuku EU_NoNuclear
TWh GAS: NGCC+Oxyfueling COAL+BIO: Air Blown IGCC ‐ Co‐Firing with CCS BIO: Crop Direct Combustion. With CCS BIO: Solid Biomass Direct Combustion.with CCS
with CCS as the nuclear policy decreases the nuclear contribution to power generation in Europe. This is the case even when the level of bioelectricity generation with a bio plant equipped with CCS technologies remains fairly unchanged in 2050, whatever the scenario, i.e. around 530 TWh in 2050. In EU_NoNuclear, the use of BECCS is limited by the potential of biomass in Western Europe, i.e. 13 EJ in 2050. In Eastern Europe, the potential is not saturated; technological choice comes from cost characteristics of the energy system and from the distribution of carbon constraints in Europe between Eastern and Western Europe. In the other scenarios, the use of BECCS remains constant, however its potential is not fully used. This implies that, at a certain point, the marginal cost of BECCS becomes uncompetitive compared to other abatement options, so that BECCS is used almost constantly, regardless of the technological constraint put on nuclear power.
To sum up, low carbon electricity generation options such as highly efficient natural gas combined cycle power plants, carbon capture technologies, nuclear power, and renewable energies, will compete in the electricity mix to meet climate targets. CCS technologies represent a significant option, and increasingly so in the case of nuclear phase-out. Indeed, gas and coal/biomass power plants with carbon capture are favored as renewable energies to replace the nuclear production of electricity. This raises the question of what will happen if carbon capture technologies are not developed in Europe in the future.
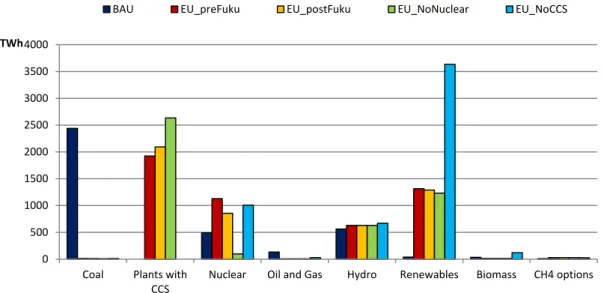
Figure 8: European power generation (TWh) in 2050 by scenario
0 500 1000 1500 2000 2500 3000 3500 4000 Coal Plants with CCS
Nuclear Oil and Gas Hydro Renewables Biomass CH4 options
TWh
In the EU_NoCCS scenario, the low-carbon transition of the European energy system must be achieved without using CCS technologies. In 2050, to reach climate targets and respect the post-Fukushima nuclear policy expressed in the European roadmap to 2050, electricity is mainly produced by renewable energies. Indeed, 66% of the electricity generation comes from renewable energies; 81% if hydroelectricity (11%) and bioelectricity from biomass power plants (2%) are taken into account (Figure 8). Note that if nuclear constraint is released, renewables account for 63% of electricity generation and nuclear power reaches 23% (against 13% in the BAU scenario).
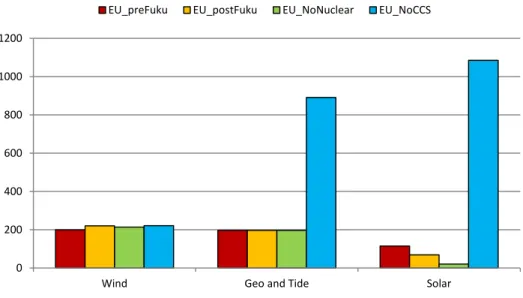
Renewable energies in the electricity mix are mainly represented by solar power. Indeed, 49% of European renewable electricity comes from solar energies in 2050 in EU_NoCCS. Geothermal and tidal electricity production represents 41% of renewable power generation (Figure 9).
Wind electricity production remains almost unchanged whatever the scenario investigated. In this sense, solar, geothermal and tidal technologies tend to represent technological substitutes of CCS in a context of climate and nuclear constraints.
Figure 9: European power generation (TWh) from renewables in 2050
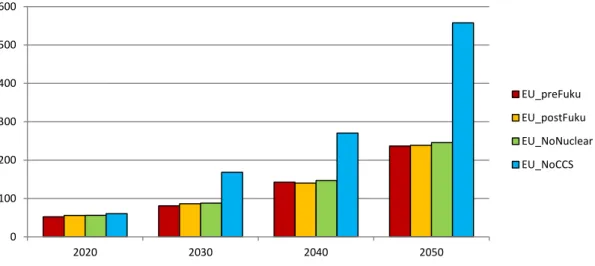
3.3. European carbon marginal costs perspective
Figure 10 represents the marginal cost of carbon in each climate scenario. This corresponds to the cost induced by additional CO2 emissions in the case of an energy system constrained by a CO2 mitigation target. Depending on the energy system and in particular its technological constraints, this marginal cost could be higher or lower for a
0 200 400 600 800 1000 1200
Wind Geo and Tide Solar EU_preFuku EU_postFuku EU_NoNuclear EU_NoCCS
similar carbon constraint. This is the case in the present study, where technological availability implemented in scenarios EU_NoNuclear and EU_NoCCS makes it harder to attain a low-carbon system.
Figure 10: European carbon marginal costs (€/tCO2)
In 2020, carbon marginal costs range from 52 €/tCO2in EU_preFuku to 60 €/tCO2 in
the EU_NoCCS scenario, via 56 €/tCO2 in EU_postFuku and EU_NoNuclear. Carbon marginal costs increase similarly over the time period in the pre- and post-Fukushima scenarios and in the non-Nuclear scenario, reaching 237, 238 and 246 €/tCO2
respectively in 2050. By contrast, they reach 558 €/tCO2in 2050 in the case where CCS
technologies are not available in Europe, i.e. in the EU_NoCCS scenario. Cost differences occur from 2030, when investments have started to satisfy the stringent technological and climate constraints. In order to compensate CCS unavailability (and so the fossil production of electricity), the development of renewables outweighs the cost of the energy system in a low-carbon objective context.
4. Conclusion
To achieve environmental commitments, Europe must decide on a significant policy of energy substitution, since its electricity is currently mainly produced from fossil sources. This transition from a fossil fuel-based electricity sector to a decarbonized one is also impacted by the current debate on the role of nuclear power in society. In this context, nuclear policy assumptions in the EC energy roadmap have somewhat changed since the Fukushima incident, with a post-Fukushima nuclear scenario fixing a constant share at 20.5% in 2030 and 2050, instead of 26.4% in 2050 before the accident. This paper
0 100 200 300 400 500 600 2020 2030 2040 2050 EU_preFuku EU_postFuku EU_NoNuclear EU_NoCCS
discusses a long-term technological and fuel shift in the European power system by implementing radical scenarios that express the unavailability of CCS and nuclear technologies in a carbon constraint context.
First of all, the results suggest that CCS technologies constitute a key carbon reduction option in case of stringent climate targets. In particular, carbon reduction constraints do not allow the use of additional high-carbon-emitting fossil power plants without integrating carbon capture technologies. Furthermore, the limitation of nuclear electricity increases the use of CCS technologies. In 2050, the European electricity produced by plants with CCS ranges from 38% of total production in the pre-Fukushima scenario to 43% in the post-Fukushima scenario. This rises to 57% in case of convergence towards nuclear phase-out. However, this could constitute a plausible pathway if power plants equipped with CCS were technologically and economically viable over the coming decades. In our model, the drivers of choice are the technological costs and the potential to respect imposed carbon constraints. The question is to determine whether, in Europe, the CO2 price will be sufficiently high to incentivize the construction of such plants considering that the cost of CCS remains uncertain (Herzog, 2011).
By 2050, when CCS technologies are available, fossil fuels still dominate power generation through carbon capture technologies, but bio plants with CCS are also deployed, allowing negative emissions. Their level of electricity production fluctuates relatively little, reaching 530 TWh, with respect to the potential of biomass in Europe, limited to 13 EJ by 2050, and considering the cost competitiveness of processes. Biomass is also used in co-firing technologies in association with coal. These plants are largely deployed when equipped with CCS and represent more than 40% of the plants with CCS in the pre- and post-Fukushima scenarios. Their share decreases with the reduction of nuclear in favor of gas plants with CCS, even though their level of electricity production remains in the same order of magnitude. Power plants with CCS are preferred over with renewable energies to substitute nuclear production of electricity, even though renewables play an important role in the transition to a low-carbon electricity sector. Renewable sources represent 26% of the production of electricity in pre- and post-Fukushima scenarios, and 27% when nuclear tends to be phased out. In the EU_NoCCS scenario, the unavailability of CCS technologies involves a significant fuel shift from fossil to renewable energy sources. Renewable energies represent 66% of electricity production. However, concerning the future electricity mix, the debate often
centers on whether renewable energies have the potential to close the supply gap that would arise and result in a stable electricity system, particularly without nuclear power (Netzer and Steinhilber, 2011). In this case, fossil power plants offer the benefit of a secure and reliable system, and thereby CCS technologies in a carbon reduction objective. That said, renewable energy sources play a relatively important role in generating electricity in all scenarios, even though their place in the power system results from the respective roles of nuclear and CCS technologies. In the EU_NoCCS scenario, the share of renewable energy sources in electricity generation increases considerably, especially solar energy; this means ensuring that the power system is sufficiently flexible to be able to decarbonize it in a plausible long-term pathway, notably with complementary power plants. Increasingly sophisticated grids will be required in terms of electricity lines, smart grids and electrical storage (Förster et al., 2012; EC, 2011), along with the introduction of new market mechanisms. In the absence of electrical storage, the use of intermittent renewable electricity will be linked to an additional – and at least as significant – use of electricity based on gas or coal. At the same time, one of the benefits of large-scale renewable integration is that it could pursue not only the aims of the environmental commitment, but also the ones of the energy policy in a large sense, as the energy independence security and the strengthening of the national markets competitiveness.
One limitation of this analysis is the fact that efficiency improvement should be taken into account since the future growth of electricity demand will have to be limited in order to achieve stringent carbon mitigation targets in the power sector. This constitutes a key point of the European Energy-Climate policy that has not been integrated into the model so far, with the exception of improving the efficiency of power plants over the time horizon. In their broad literature review and decarbonization scenario analyses, Forster et al. (2012) also highlight that the respective roles of nuclear and CCS technologies constitute the main bone of contention in the European power sector. There is a great deal of uncertainty regarding the costs and social acceptability of these
technologies. CO2 geological storage increasingly comes up against social acceptability
issues. Germany, for instance, no longer has a current CCS project following the cancellation of Jangswalde. CCS has been the focus of public protests based on the safety of insufficient storage and the “not in my backyard” phenomenon. This lack of social acceptability for onshore storage makes the prospect of offshore geological storage more probable. Therefore, it would be interesting to consider sensitivity analyses
with a scenario that prohibits onshore storage of carbon in order to evaluate whether Europe’s CCS potential is limited.
5. References
Azar, C., Lindgren, K., Larson, E., Möllersten, K., 2006. Carbon capture and storage from fossil fuels and biomass costs and potential role in stabilizing the atmosphère. Climatic Change 74, 47-49.
Azar, C., Lindgren, K., Obersteiner, M., Riahi, K., Van Vuuren, D., Michel, K., 2010. The feasibility of low CO2 concentration targets and the role of bio-energy with carbon capture and storage (BECCS). Climatic Change 100, 195-202.
Biorecro, 2011. Global Status of BECCS Projects 2010
Blohm-Hieber Ute, 2012. Energy Policy Framework, Roadmap 2050, ESNII Conference, Brussels, 25 June.
Deutsche Bank, 2011. CCS for climate protection: important, tedious and costly
EGSN, 2012. Independant Assessment of High Capacity Offshore CO2 Storage Options. ETI. 2012. UK Storage Appraisal.
European Commission (EC), 2012. Energy Roadmap 2050. Impact assessment and scenario analysis. Commission staff Working Paper. Brussels, 15.12.2012.
Förster H., Healy S., Loreck C., Matthes F., Fischedick M., Lechtenböhmer S., Samadi S. and Venjakob J., 2012. Metastudy Analysis on 2050 Energy scenarios, SEFEP working paper 2012-5, July.
Geocapacity, E. 2009. Assessing European capacity for geological storage of carbon dioxyde: WP2, Report Storage capacity.
Herzog, H.J., 2011. Scaling up carbon dioxide capture and storage: From megatons to gigatons. Energy Economics 33, 597-604.
Hoster, F., 1998. Impact of a nuclear phase-out in Germany: results from a simulation model of the European Power Systems. Energy Policy, 26-6, 507-518.
IAEA, 2011. Energy, Electricity and Nuclear Power Estimates for the Period up to 2050, Reference data series n° 1, 2011 Edition, August, ISBN 978-92-0-119410-7.
IPCC, 2007. Climate Change 2007, Fourth Assessment Report (AR4).
IPCC (Intergovernmental Panel on Climate Change), 2005. Carbon Dioxide Capture and Storage, Special Report. Cambridge University Press, Cambridge.
Jaouen Claude and Wantz Olivier, 2012. Redrawing the Map of Nuclear Industry, ParisTech Review, June 18th.
Katofsky, R., Stanberry, M., Frantzis, L., 2010. Achieving climate stabilization in an insecure world: does renewable energy hold the key? Report International Energy Agency - Renewable Energy Technology Development.
Luckow, P., Wise, M., Dooley, J.J., Kim, S., 2010. Large-scale utilization of biomass energy and carbon dioxide capture and storage in the transport and electricity sectors under stringent CO2 concentration limit scenario. International Journal of Greenhouse Gas Control 4, 865-877. Mori; 2012. An assessment of the potentials of nuclear power and carbon capture and storage in the long-term global warming mitigation options based on Asian Modeling Exercise scenarios. Energy Economics.
Nakata, T., 2002. Analysis of the impacts of nuclear phase-out on energy systems in Japan. Energy 27, 363-377.
Netzer N. and Steinhilber J. (EDS.), 2011. The end of nuclear energy? International perspectives after Fukushima. Perspective, Friedrich Ebert Stiftung, July. 79p.
Ricci, O, Selosse, S., 2012. Global and regional potential for bioelectricity with carbon capture and storage. Energy Policy, http://dx.doi.org/10.1016/j.enpol.2012.10.027
Tavoni and van der Zwaan, 2011. NuclearVersus Coal plus CCS: A Comparison of Two Competitive Base-Load Climate Control Options. Environmental Modeling and Assessment 16, 431-440.
McJeon, H.C., Clarke, L., Kyle, P., Wise, M., Hackbarth,A., Bryant, B.P., Lempert, R.J.,
2012. Technology interactions among low-carbon energy technologies: What can we learn from a large number of scenarios? Energy Economics 33, 619-631.
van den Broek, M., Veenendaal, V., Koutstaal, P., Turkenburg, W., Faaij, A., 2011. Impact of international climate policies on CO2 capture and storage deployment: Illustrated in the Dutch energy system. Energy Policy 39, 2000–2019.
van Vuuren, D., Den Elzen, M., Lucas, P., Eickhout, B., Strengers, B., et al., 2007. Stabilizing greenhouse gas concentrations at low levels: an assessment of reduction strategies and costs. Climatic Change 81, 119-159.
van der Zwaan, 2008. Prospects for nuclear energy in Europe. International Journal of Global Energy Issues , vol. 30, issue 1, pages 102-121.
Vasakova L., 2011. Energy Roadmap 2050. DG ENER, European Commission, December. World Energy Council, 2012. World Energy perspective: Nuclear energy one year after Fukushima.
Contact
Nadia MAÏZI
Directrice du Centre de Mathématiques Appliquées (CMA)
MINES ParisTech / CMA Rue Claude Daunesse BP 207
06904 Sophia Antipolis
Tel: +33(0)4 97 15 70 79 / Fax: +33(0)4 97 15 70 66 Courriel: nadia.maizi@mines-paristech.fr
Jean-Charles HOURCADE
Directeur du Centre International de Recherche sur l’Environnement et le Développemenr (CIRED)
CIRED
Campus du Jardin Tropical 45 avenue de la Belle Gabrielle 94736 Nogent sur Marne Cedex
Tel: +33(0)1 43 94 73 63 / Fax: +33(0)1 43 94 73 70 Courriel: hourcade@centre-cired.fr
Site Web: http://www.modelisation-prospective.org