HAL Id: hal-00951331
https://hal.archives-ouvertes.fr/hal-00951331
Submitted on 24 Feb 2014
HAL is a multi-disciplinary open access
archive for the deposit and dissemination of
sci-entific research documents, whether they are
pub-lished or not. The documents may come from
teaching and research institutions in France or
abroad, or from public or private research centers.
L’archive ouverte pluridisciplinaire HAL, est
destinée au dépôt et à la diffusion de documents
scientifiques de niveau recherche, publiés ou non,
émanant des établissements d’enseignement et de
recherche français ou étrangers, des laboratoires
publics ou privés.
IMPACT OF TONE MAPPING IN HIGH DYNAMIC
RANGE IMAGE COMPRESSION
Manish Narwaria, Matthieu Perreira da Silva, Patrick Le Callet, Romuald
Pépion
To cite this version:
Manish Narwaria, Matthieu Perreira da Silva, Patrick Le Callet, Romuald Pépion. IMPACT OF
TONE MAPPING IN HIGH DYNAMIC RANGE IMAGE COMPRESSION. VPQM, Jan 2014,
Chan-dler, United States. pp. 1-6. �hal-00951331�
IMPACT OF TONE MAPPING IN HIGH DYNAMIC RANGE IMAGE COMPRESSION
Manish Narwaria, Matthieu Perreira Da Silva, Patrick Le Callet, Romuald Pepion
LUNAM University - IRCCyN CNRS UMR 6597, 44306, Nantes, France
ABSTRACT
Tone mapping or range reduction is often used in High Dynamic Range (HDR) visual signal compression to take advantage of the existing image/video coding architectures. Thus, it is important to study the impact of tone mapping on the visual quality of decompressed HDR visual signals. To our knowledge, most of the existing studies focus only on the quality loss in the resultant low dynamic range (LDR) signal (obtained via tone mapping) and typically employ LDR displays for subjective viewing experiments. As a result, it is not clear how tone mapping affects the perceptual quality of the decompressed HDR signal produced by inverse tone mapping. To address that, we present the results and analysis of a comprehensive subjective study in which the decompressed HDR images were displayed on an HDR display. Our study reveals that, indeed, the perceptual quality of the decompressed HDR signal is dependent on the tone mapping method employed.
1. INTRODUCTION
Conventional imaging systems (both for capturing and displaying) cannot handle the vast range of luminance typically present in a real scene due to inherent hardware limitations (for example, the camera sensor might have a limited dynamic range as a result of which intensity values in the scene which are above a certain threshold get saturated). Thus, visual signals are typically captured such that they represent colors which should appear on a display device and not necessarily proportional to scene intensities. Such images and videos have low dynamic range (LDR) and are device-referred or output-referred. Obviously, LDR signals cannot typically reproduce the contrast (or dynamic range) of the real scene. That is, the finer visual details are lost thereby reducing the visual quality. Therefore, HDR imaging has attracted attention in both industry and academia [1] towards improving the visual experience of the end users by producing compelling pictures that have much larger contrast in comparison to the traditional LDR pictures.
With respect to HDR capture, the requirement of powerful camera sensors can be bypassed by software
processing, thanks to exposure fusion [1]. However, software processing for displaying HDR (known as tone mapping in which the dynamic range of the HDR image/video is reduced so that it matches with that of the display) invariably leads to loss of contrast and other finer details. As a result, it reduces the visual quality of the HDR scene and so this method of displaying HDR cannot be considered to be accurate. Thus, the more precise way of displaying HDR is the use of specialized displays with more powerful backlight structure resulting in a much larger dynamic range [3]. Such displays (often referred to as HDR displays) are now starting to become available in the consumer market (for instance, the SIM2 HDR display [4]).
Given that HDR images and videos capture more visual details as compared to the conventional LDR ones, they require a lot more storage space. Due to this, HDR image/video compression is an active research area. It is worth noting at this point that the existing coding architectures (for LDR images and videos) have become widely adopted standards supported by almost all software and hardware equipment dealing with digital imaging. As a result, it is of great interest to design HDR compression schemes that are compatible with existing coding architectures (for example [5], [6]). In this, dynamic range reduction (or tone mapping) is usually the first step. The resultant LDR image/video is then compressed using existing codecs. Next, inverse tone mapping is employed to convert the decompressed LDR signal to HDR.
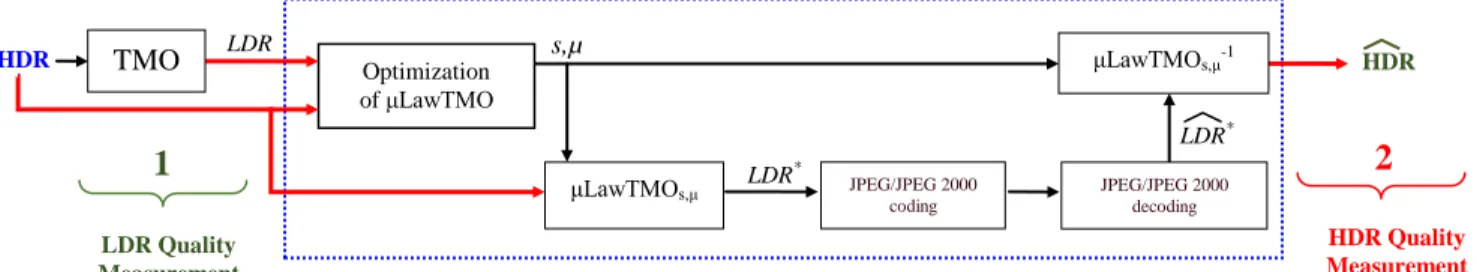
As already mentioned, TMOs are not necessarily transparent and as a result, the decompressed signal is not only affected by coding/compression error but also by the TMO. Thus, it is of interest to examine how some of the existing TMOs perform when it comes to HDR image compression. In Fig. 1, we have indicated the two stages at which visual quality loss occurs. It can be seen that stage 1 (i.e. HDR to LDR conversion via tone mapping) pertains to LDR quality assessment using the conventional LDR display and has been widely studied [2]. On the other hand, stage 2 demands HDR quality assessment i.e. the decompressed HDR image has to be displayed on an HDR display and subjectively rated. However, a survey of literature reveals that this has not been comprehensively investigated. Our study, therefore, aims to fill that gap and
analyze how different tone mapping methods affect the visual quality of decompressed HDR images.
2. TONE MAPPING BASED HDR COMPRESSION METHOD
In this section, we provide a brief description of the tone mapping based HDR image compression method [6] used in this study and whose block diagram is shown in Fig. 1. In this method, the first step is the tone mapping of the HDR image to obtain the LDR version. Next, a non-linear function similar to the µ-Law encoding is defined as
) 1 ln( ) / ( 1 ln ) ( s s x x LawTMO (1)where s is a scaling parameter and µ controls the depth of the logarithm function. These parameters are determined by non-linear least squares optimization as
i i i s E LawTMOHDR LDR 2 , ( ) min (2) where HDRi and LDRi respectively denote the ith pixel ofthe HDR and the corresponding tone mapped LDR image. Once the two parameters are determined, the HDR image is transformed by the function defined in (1) and quantized to 8 bits to obtain an image that has lower dynamic range as compared to HDR. As a result, this image can be compressed by an existing codec (we used JPEG 2000 in this paper) and the encoded bit stream along with the two function parameters are sent to the decoder. Along with the usual JPEG 2000 decoding, the decoder also applies the inverse function 1
LawTMO
in order to transform the decoded image to HDR. The inverse function is defined as 1( )
(/).ln(1)1
xs e s x LawTMO (3)It can be seen that the range reduction function in Eq. (1) and its inverse in Eq. (3) are both completely determined by s and µ. Further, as indicated by Eq. (2), these two control parameters are derived based on the premise that the transformed image is as close to the tone mapped LDR image as possible. This obviously implies that the TMO used has a direct impact on the visual quality of the final decompressed HDR image. In the next section, we investigate this aspect in more details.
3. DETAILS OF SUBJECTIVE VIEWING TESTS
This section gives the details of the test setup used for the subjective viewing experiments.
3.1. Test scenes
To include a wide range of still image content and varying illumination conditions, we used 6 HDR still image scenes whose tone mapped versions are shown in Fig. 2. These include outdoor only scenes (‘Carpark_IVC’, ‘Forest_path’ and ‘Lake’) and both indoor and outdoor scenes (‘Bausch_lot’, ‘Office_IVC’ and ‘Moto’). The resolution of the test scenes was HD (1920 × 1080). Note that in HDR, the luminance values are expressed in cd/m² and Fig. 4 (a) shows the luminance range (order of magnitude) of the test scenes used in this paper.
3.2. Tone mapping operators (TMOs)
The existing TMOs can be broadly classified into two categories namely local operators and global operators. As the name implies, local operators employ a spatially varying mapping which depends on the local image content. As opposed to this, global operators use the same mapping function for the whole image. Local TMOs are usually better at preserving the local details but are less effective in reproducing the overall brightness and contrast. This happens because of their design in which more emphasis is placed on preserving details in small neighborhoods and there may be no explicit global operation towards range reduction. On the other hand, global TMOs preserve the overall contrast better at the expense of local details. Global TMOs are generally computationally more efficient than the local ones. So while local and global TMOs have their own advantages and disadvantages, they inevitably degrade the visual quality. In this paper, we selected 5 TMOs: 3 local and 2 global. The local TMOs include the ones proposed by Ashikmin [7], Reinhard [8] and Durand [9]. These are denoted as AL, RL and Dur respectively.
Note that the former two TMOs operate locally but also have the option for global processing. For global TMOs, we chose the logarithmic TMO and the global version of the TMO proposed by Reinhard [8]. For the algorithmic details of the TMOs used, the reader is referred to their respective references. We used the HDR Toolbox available in [1] for the TMO implementations.
3.3. Test material preparation
All the TMOs used in this paper require one or more parameter value(s) to produce an acceptable quality tone mapped image. Moreover, these parameter(s) are highly content dependent. So these were selected on the basis of a pilot study for the six HDR still image contents [2]. We used the JPEG2000 compression scheme for compressing the transformed HDR images. Seven bit rates were chosen such that the resulting visual quality covers the entire range i.e. from excellent (rating 5) to bad (rating 1).
Figure 1. Tone mapping based HDR image compression method.
Bausch_lot (BL) Carpark_IVC (CI) Forest_path (FP)
Lake (LK) Moto (MT) Office_IVC (OI)
Figure 2. HDR scenes used in this paper. These are the tone mapped versions of the actual scenes.
As a result, we obtained a total of 210 decompressed HDR images (6 reference scenes × 5 TMOs × 7 bit rates).With the inclusion of the 6 reference scenes, we have a total of 216 still HDR images, i.e. 216 conditions = 6 reference scenes × 36 conditions per reference image, to be evaluated by subjects.
3.4. Apparatus and Rating Methodology
Observers were seated in a standardized room conforming to the International Telecommunication Union Recommendation (ITU-R) BT500-11 recommendations [10]. For displaying the HDR images, SIM2 HDR47E S 4K display [4] was used. The HDR47E S 4K is a 47-inch, 1080p LCD TV with maximum displayable luminance of 4000 cd/m². The viewing distance was set to three times the height of the screen (active part), that is approximately 178 cm and the room illumination was set to 130cd/m². For rating the compressed HDR images, we adopted the absolute category rating with hidden reference (ACR-HR) which is one of the rating methods recommended by the International Telecommunication Union (ITU) in Rec. ITU-T P.910 [11]. For rating overall quality, a five-level scale is used: 5 (Excellent), 4 (Good), 3 (Fair), 2 (Poor) and 1 (Bad). A total of 29 observers (14 males and 15 females) were used to subjectively evaluate the visual quality of the compressed HDR images. All were naive
(not expert in image or video processing) for the purpose of this study. We also employed post-experiment screening of the subjects in order to reject any outliers in accordance with the Video Quality Experts Group (VQEG) multimedia test plan [12]. Analysis per processed image and per source (i.e. reference) image was performed and in our case, none of the observers was rejected. The mean opinion score (MOS) for each stimuli was obtained by averaging the scores for that stimuli from all the observers.
4. QUALITATIVE ANALYSIS OF RESULTS
We obtained a total of 6264 subjective ratings (216 conditions each rated by 29 observers). This represents substantial ground truth to draw reasonably reliable conclusions.
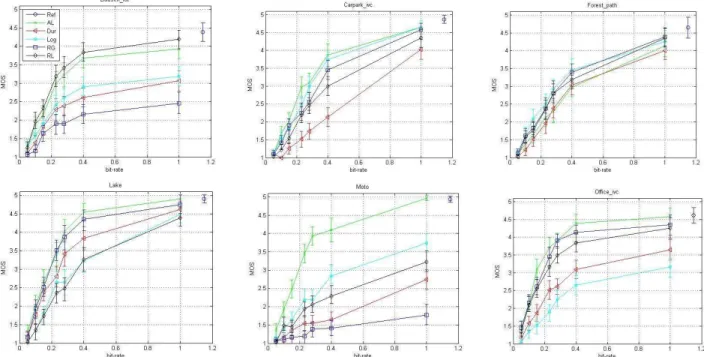
The bit-rate vs the MOS (higher indicates better quality) plots for the 6 scenes are shown in Fig. 3. We have also indicated the associated 95% confidence intervals in these plots. We can make the following observation from these plots:
(1) The small confidence intervals indicate a high degree of agreement between the observers and are evidence in favor of the reliability of the obtained subjective ratings.
HDR HDR s, µ
1
2
s,µ TMO LDR Quality Measurement HDR Quality Measurement μLawTMOs,μ JPEG/JPEG 2000 coding JPEG/JPEG 2000 decoding μLawTMOs,μ-1 Optimization of μLawTMO LDR* LDR LDR*(2) Recall that we used ACR-HR methodology in which the reference image (i.e. uncompressed HDR image in our case) is also shown to the observers without informing them. One can observe that the reference image was rated the highest for all the six.
(3) The reader will notice from these plots that nearly the entire range of quality levels (from bad to excellent) have been covered for all the six scenes. As a result, the data obtained is not biased towards any specific content, TMO or bit rate. (4) In general, the TMO curves are distinguishable
i.e. each TMO resulted in different quality HDR images. This is an important observation since it clearly implies that the visual quality of the decompressed HDR image is dependent on the type of TMO employed.
(5) In general, the local TMO, AL overall performs the best as it leads to better visual quality at nearly all bit rates.
Interestingly, for the scene ‘Forest_path’, the MOSs for different TMOs are much closer with significantly overlapping confidence intervals. A plausible explanation for this is related to how TMOs operate. In general, TMOs attempt a trade-off between preserving details in very dark and very bright scene regions. As a result, a scene with very dark (for instance, shadows) and very bright (for instance, sunlight) regions is the quite challenging for TMOs. Obviously some TMOs achieve a better said trade-off than others leading to different quality tone mapped scenes. With this in mind, the reader will notice that the other five scenes used in this paper have several darker regions which typically correspond to shadows, lower level of room illumination etc. In contrast, the scene ‘Forest_path’ has mainly bright regions (confirmed by the order of magnitude of the luminance ranges shown in Fig. 4 (a)). Consequently, most TMOs can preserve details leading to more similar visual quality and hence closer subjective ratings.
5. STATISTICAL ANALYSIS OF RESULTS
From the previous section, we find that indeed, different TMOs lead to quite different visual quality with one TMO performing better than others in different conditions i.e. depending on the scene and compression rate. Therefore, it will be interesting to further examine if the subjective ratings for scenes processed by one TMO are statistically different to the ones processed by another TMO. This would give insights into if a particular TMO leads to
statistically better (or worse) quality as compared to another TMO.
5.1. Parametric Statistical Testing
We conducted a two-tailed Student's t-test [13] to compare the subjective score distribution (or population) from each of the five TMOs. However, t-test requires that each of the population being compared follows a Gaussian distribution. We verified this via Jarque Bera (JB) test [13] which determines normality by matching the skewness and kurtosis of the data with those of a normal distribution. The JB test statistic is defined as
2 2 ) 3 ( 4 1 6 S K n JB (4)
Here, n is the number of observations, S and K denote skewness and kurtosis respectively. Samples from a normal distribution have S = 0 and K = 3. The results of the JB test revealed that none of the score distributions were strictly Gaussian. It may be pointed out however, that the JB test is strict in the sense that even small deviations from normality may result in the rejection of the assumption that the data follows normal distribution. Therefore, we also considered a 'relaxed' criteria to determine normality. For that we computed the higher order statistics (skewness and kurtosis) of each distribution. Since the Gaussian distribution has K value of 3, commonly, K values between 2 – 4 can be deemed Gaussian approximately [14]. Further given that S = 0 for normal distribution, one can assume approximate normality if S values are close to 0. The S and K values are reported in Table 1. From these, we can assume that the distributions are approximately Gaussian.
The null hypothesis under test is that the scores obtained from the five TMOs (for all the scenes and observers) are independent random samples from normal distributions with equal means (but unknown variances) against the alternative hypothesis that means are not equal:
2 1 0:OSTMO OSTMO H 2 1 : TMO TMO alt OS OS H
where OSTMO1 denotes the subjective opinion scores for images processed by one TMO and
2
TMO
OS denotes that for another TMO. If H0is true then it implies that statistically there is no difference in the perceived quality of the decompressed HDR images processed by the two TMOs being compared. On the basis of the observed mean values, standard deviations and number of observations, the t-values are computed. The null hypothesis H0 is
rejected if ttcritical where tcritical is computed from the
table for the t-Student distribution using a significance level α (α = 0.05 in this paper).
Figure 3. Bit rate Vs Mean Opinion Score (MOS) plots for the six scenes used in this paper. The respective scene names have been indicated in each plot. The error bars denote 95% confidence intervals. The legend for all the plots is the same as in the first plot. (Figure best viewed in color)
(a) (b)
Figure. 4 (a) Order of magnitude of the luminance range for the six HDR test scenes used in this paper, (b) Results for t-test: ‘blue colored squares’ (both TMOs statistically the same), ‘green colored squares’ (TMO indicated in row is statistically better than the one in the column), and ‘red color
squares’ (represent the opposite case). (Figure best viewed in color)
Table 1. Skewness and kurtosis values of the score distributions AL Dur Log RG RL Skewness (S) 0.0638 0.8027 0.5844 0.6096 0.4442
Kurtosis (K) 1.7668 2.7625 2.4469 2.1642 2.1621
5.2. Non-Parametric Statistical Testing
For the t-test, we assumed that score distributions are Gaussian (at least approximately). To further verify if such assumption is valid, we carried out the Wilcoxon rank-sum statistical test [13]. It is a non-parametric test and uses population medians (instead of the mean as in the case of
t-test). The null hypothesis that the two distributions have
the same median against the alternative hypothesis. As an important advantage, Wilcoxon rank-sum test
(non-parametric) does not require the assumption of Gaussian distribution. Therefore, it is expected to be more accurate for scenarios in which the distribution is non-Gaussian.
5.3. Discussion of the Results of Statistical Tests
We carried out the two statistical tests (t-test and Wilcoxon rank-sum test) by using the subjective scores corresponding to the decompressed HDR images obtained from a TMO across all the test conditions, from all the subjects and for all the 6 source (i.e. reference) scenes. That is, we compared 1218 subjective scores (29 observers × 6 reference scenes × 7 compression rates) obtained for one TMO with those for another TMO. Therefore, for five TMOs we have 2
10
5
C
comparisons. The results for the t-test are shown in Fig. 4 (b) in whichthe ‘blue colored squares’ denote that the TMO mentioned in the row is statistically the same (i.e. leads to similar visual quality) as that in the column. The ‘green colored squares’ in Fig. 4 (b) imply that the TMO indicated in the row is statistically better than the one in the column and ‘red color squares’ represent the opposite case. One can see that out of ten comparisons between the different TMOs only in one case (corresponding to Log and RG TMOs), the results are statistically indistinguishable. In the remaining cases, one TMO was found to be statistically better (or worse) than another. This therefore confirms the point made in the previous section that the visual quality of the decompressed HDR image is dependent on the type of TMO. Interestingly, we found that the results from the Wilcoxon rank-sum statistical test were the same as those from the t-tests. That is, the two statistical tests lead to the same conclusions. This probably justifies why the assumption of approximate Gaussianity is valid, at least in this case. Of course, there was no evidence before the start of the tests to believe that the two tests would lead to the same statistical conclusions. A closer look at Fig. 4 (b) shows that AL TMO statistically outperforms the remaining TMOs and is followed by RL TMO (recall that both are local TMOs). On the other hand, Dur TMO is statistically the worst. Log and RG TMOs (both are global TMOs) lead to very similar visual quality scores and are statistically indistinguishable. This suggests that local TMOs might lead to better visual quality in the decompressed HDR images due to preserving more details. Dur TMO (local) however does not follow this trend at least for the scenes used in this paper. Therefore, while the experimental results indicate that the local TMOs might be better, it might be unfair to generalize that local TMOs always perform better than the global ones.
6. CONCLUSIONS
Most of the existing studies have focused only on the quality aspects of the tone mapped LDR content and typically use LDR displays for subjective viewing. Consequently, how different TMOs affect visual quality of the decompressed HDR images when viewed on an HDR screen has not been studied. To provide answer to this question, we analyzed the impact of TMOs on the visual quality using a total of 6264 ratings obtained from the HDR subjective viewing tests. The results indicate that different TMOs indeed lead to quite different perceptual quality in the decompressed HDR images. Further, we carried out both parametric and non-parametric statistical analysis and found that statistical differences exist between the visual quality ratings of the images processed by different TMOs.
7. REFERENCES
[1] F. Banterle, A. Artusi, K. Debattista and A. Chalmers, "Advanced High Dynamic Range Imaging: Theory and Practice", ISBN: 978-156881-719-4, AK Peters (CRC Press), Natrick, MA, USA.
[2] M. Narwaria, M. Silva, P. Callet and R. Pepion “Effect of Tone Mapping on Visual Attention Deployment”, SPIE Conference on Applications of Digital Image Processing XXVII (Special Session on High Dynamic Range Imaging), vol. 8499, 2012.
[3] H. Seetzen, W. Heidrich, W. Stuerzlinger, G. Ward, L.
Whitehead, M. Trentacoste, A. Ghosh and A. Vorozcovs, “High Dynamic Range Display Systems”, in ACM Transactions on
Graphics (TOG), Vol. 23, No. 3, pp. 760-768, 2004. [4] http://www.sim2.com/HDR/
[5] G. Ward and M. Simmons, "JPEG-HDR: A Backwards-Compatible High Dynamic Range Extension to JPEG", in Proceedings of ACM SIGGRAPH 2006 Courses, Article no. 3, 2006.
[6] N. Sugiyama, H. Kaida, X. Xue, T. Jinno, N. Adami and M. Okuda,"HDR Compression Using Optimized Tone Mapping Model", in Proceedings of International Conference on Acoustics, Speech and Signal Processing (ICASSP), pp. 1001-1004, 2009.
[7] M. Ashikhmin, "A tone mapping algorithm for high contrast images" in Proceedings of 13th Eurographics Workshop on Rendering. Eurographics Association, pp. 145-156, 2002. [8] E. Reinhard, M. Stark, P. Shirley and J. Ferwerda, "Photographic tone reproduction for digital images" in ACM Transactions on Graphics (TOG), Vol. 21, No. 3, pp. 267-276, 2002.
[9] F. Durand and J. Dorsey, "Fast bilateral filtering for the display of high-dynamic range images", in ACM Transactions on Graphics (TOG), Vol. 21, No. 3, pp. 257-266, 2002.
[10] Recommendation ITU-R BT.500-13, “Methodology for the
subjective assessment of the quality of television pictures”,
2012.
[11] ITU-T Recommendation P.910, “Subjective video quality assessment methods for multimedia applications”, 2008. [12] D. Hands and K. Brunnstrom, Video Quality Experts Group (VQEG) Multimedia Group Test Plan, Version 1.21, 2008. [13] G. Snedecor and W. Cochran, Statistical Methods, Iowa State University Press (1989).
[14] D. C. Montgomery and G. C. Runger, "Applied Statistics and Probability for Engineers", Wiley-Interscience, 1999.