1
Title: Abiotic and biotic interactions in the diffusive boundary layer of kelp
blades create a potential refuge from ocean acidification
Authors: Fanny NOISETTE, Catriona HURD
Affiliation: Institute for Marine and Antarctic Studies, University of Tasmania, 20 Castray Esplanade, Battery Point, 7004 TAS Hobart, Australia
Corresponding author:
Fanny Noisette
Email: fanny.noisette@live.fr
Phone : +33 (0)6 03 10 84 80 (FR) / +1 (0)4 99 24 38 63 (AU)
Type of paper: Original Research Article
2 Summary
1
1. Seaweeds are able to modify the chemical environment at their surface, in a micro-zone called 2
the diffusive boundary layer (DBL), via their metabolic processes controlled by light intensity. 3
Depending the thickness of the DBL, sessile invertebrates such as calcifying bryozoans or 4
tube-forming polychaetes living on the surface of the blades can be affected by the chemical 5
variations occurring in this micro-layer. Especially in the context of ocean acidification, these 6
microhabitats might be considered as a refuge from lower pH, because during the day 7
photosynthesis temporarily raises the pH to values higher than in the mainstream seawater. 8
2. We assessed the thickness and the characteristics of the DBL at two pH levels (today’s average 9
surface ocean pH 8.1 and a reduced pH predicted for the end of the century, pH 7.7) and 10
seawater flows (slow, 0.5 and fast, > 8 cm s-1) on Ecklonia radiata (kelp) blades. Oxygen and 11
pH profiles from the blade surface to the mainstream seawater were measured with O2 and pH
12
microsensors for both bare blades and blades colonized by the bryozoan Membranipora 13
membranacea. 14
3. The DBL was thicker in slow compared to fast flow and the presence of bryozoans increased 15
the DBL thickness and shaped the DBL gradient in dark conditions. Net production was 16
increased in the low pH condition, increasing the amount of oxygen in the DBL in both bare 17
and epiphytized blades. This increase drove the daily pH fluctuations at the blade surface, 18
shifting them towards higher values compared to today’s pH. The presence of bryozoans led 19
to lower oxygen concentrations in the DBL and more complex pH fluctuations at the blade 20
surface, particularly at pH 7.7. 21
4. Overall this study, based on microprofiles, shows that, in slow flow, DBL micro-environments 22
at the surface of the kelps may constitute a refuge from ocean acidification with pH values 23
higher than thoseof the mainstream seawater. For calcifying organisms, it could also represent 24
training ground for harsh conditions, with broad daily pH and oxygen fluctuations. These 25
3 chemical micro-environments, biologically shaped by the macrophytes, are of great interest 26
for the resilience of coastal ecosystems in the context of global change. 27
28
Key-words (5): bryozoan, ecomechanics, epiphytism, hydrodynamic, seaweed, microhabitat, 29 pH 30 31 Introduction 32
Seaweeds are not only the dominant primary producers in coastal waters but they are 33
important bioengineers that are able to modify their surrounding environment (Hurd et al. 34
2014). In particular, brown macroalgae forming broad communities such as the Laminariales 35
and Fucales act as ecosystem engineers by influencing physical factors including seawater 36
velocity (Gaylord et al. 2007; Rosman et al. 2010) and light penetration (Reed & Foster 1984), 37
and the chemical characteristics of the mainstream seawater, including carbonate chemistry 38
(Delille, Borges & Delille 2009; Cornwall et al. 2013a; Hendriks et al. 2014), oxygen and 39
nutrient availability (Frieder et al. 2012; Saderne et al. 2015). Seaweed communities can 40
modulate their surrounding chemical environment on seasonal and diel cycles (Delille et al. 41
2000; Saderne, Fietzek & Herman 2013), however the most rapid and variable fluctuations in 42
chemical parameters occur in the microenvironments formed at the surface of the seaweeds, in 43
a zone called the diffusive boundary layer (DBL, also termed the concentration boundary layer) 44
(Hurd et al. 2014; Wahl, Saderne & Sawall 2016). 45
The DBL is a discrete micro-layer at the surface of many organisms (e.g. Kühl et al. 46
1995; de Beer et al. 2000), including all primary producers (e.g. Koch 1994; Brodersen et al. 47
2015), that buffers them from the mainstream seawater (Vogel 1999). This specific layer is 48
formed when a fluid flows over a solid, such as a kelp blade. The no-slip condition creates a 49
4 region of viscously-dominated laminar flow at the seaweed surface. In this thin laminar layer, 50
movement of ions and molecules is by molecular diffusion, and the metabolic activity of the 51
organism results in a concentration gradient due to the uptake and release of dissolved 52
substances to and from the organism’s surface (Vogel 1999; Hurd 2000). Fluctuations observed 53
in these microhabitats at the surface of seaweed are mainly driven by their photosynthesis and 54
respiration processes under the control of light (Sand-Jensen, Revsbech & Jörgensen 1985; 55
Hurd et al. 2011; Cornwall et al. 2013b ; Hofmann, Koch & de Beer 2016). Thus, metabolic 56
activity affects the micro-chemical environment of the DBL which differs from that in the 57
mainstream seawater just micrometres away (Hurd 2015), with implications for the alga itself 58
and all the other small organisms living on the blades. 59
The importance of DBLs in controlling the availability and transfer of nutrients and 60
metabolites to and from algal surfaces is well known (Raven 1997; Hurd 2000; De Beer & 61
Larkum 2001). The presence of a thick DBL formed under slow flows (< 2 cm sec-1) may, for 62
example, decrease the uptake of dissolved inorganic carbon and nutrients (Wheeler 1980; 63
Kregting et al. 2011). However, these microenvironements are beneficial for other processes 64
such as timing of gamete release (Pearson, Serrão & Brawley 1998) or keeping antifouling 65
agents at their surface (Dworjanyn, De Nys & Steinberg 2006). Interestingly, different 66
organisms such as bacteria, diatoms, larvae and spores live in this thin layer (Schaffelke 1999; 67
Wahl, Saderne & Sawall 2016). Some bigger and calcifying species such as bryozoans or tube 68
forming worms also settle on brown macroalgal blades (Saderne & Wahl 2013) and would be 69
submitted to the fluctuations occurring in these micro-habitats. In particular, bryozoans are 70
known to be epiphytic organisms which influence their algal substratum (Muñoz, Cancino & 71
Molina 1991; Hurd et al. 1994a), changing for example nutrient uptake at the seaweed surface 72
(Hurd et al. 1994a; Hepburn & Hurd 2005; Hepburn, Frew & Hurd 2012). According to their 73
size, their structure and their direct contact with the algal substratum, they are typically sessile 74
5 organisms which would be affected by oxygen and pH fluctuations that occur in the DBL (Irwin 75
& Davenport 2002; Wahl, Saderne & Sawall 2016). Nevertheless, there is a knowledge gap on 76
the interactive effects that bryozoans can have with other abiotic factors of the surrounding 77
water and their role in the formation and gradient creation in the DBL has never been clearly 78
observed. 79
The different physical and chemical parameters of the environment surrounding 80
macroalgae can affect the thickness of the DBL and the flux of dissolved substances, and thus 81
the concentration gradient which can vary from µm to mm (0.1 to 10 mm; Raven & Hurd 2012). 82
Flow rates directly impact the thickness of the DBL (Vogel 1999; Denny 2015) and variation 83
in metabolic processes can change the concentration gradients (Sand-Jensen, Revsbech & 84
Jörgensen 1985). In seaweeds, photosynthesis and respiration processes not only affect the 85
oxygen gradient of the DBL (e.g. Spilling et al. 2010) but they also change the pH due to the 86
uptake and release of DIC in light and dark, respectively (e.g. De Beer & Larkum 2001; Hurd 87
et al. 2011, Cornwall et al. 2013b ; Short, Pedersen & Kendrick 2015). This ability of 88
macrophytes to metabolically modify their local pH and the influencing effect of 89
hydrodynamics on DBL thickness have recently been put forward in the context of ocean 90
acidification (OA) to understand how seaweeds, seagrasses and their associated organisms, 91
particularly calcifiers, will respond to the predicted decrease in seawater pH, (Hendriks et al. 92
2015, 2017; Hurd 2015; Wahl, Saderne & Sawall 2016; Cox et al. 2017). The term OA 93
describes the average decrease in the surface oceanic pH and the associated changes in seawater 94
carbonate system caused by increasing CO2 release into the atmosphere since the beginning of
95
the industrial revolution (Gattuso & Hansson 2011). There is no doubt that OA is an ongoing 96
process and that the pH will be reduced by 0.1 to 0.3 pH units by the end of the century (Stocker 97
et al. 2013), and it is therefore essential to find ways to increase the resilience of sensitive 98
species and discover temporal or spatial refuge from OA (Hurd 2015). 99
6 In this context, this study aims to better characterize the thickness and concentration 100
gradient of the DBL at the blade surface of the kelp Ecklonia radiata, (C.AGARDH)J.AGARDH 101
1848, one of the most common and widespread brown macroalgae in southern hemisphere 102
coastal oceans, which forms large and dense seaweed communities (Steneck et al. 2002). As 103
the interactive effect of flow rate, mainstream seawater pH and epiphytism on DBL have never 104
been characterized, we measured oxygen concentrations and pH values from the blade to the 105
mainstream seawater, in saturating light and dark conditions, in fast and slow flow, today’s pH 106
and that predicted for 2100 and in the presence or absence of the common bryozoan 107
Membranipora mambranacea, LINNAEUS 1767. We hypothesised that, 1. the DBL would be 108
thicker in slow flow because low velocity favours the increase of the DBL (Hurd 2000); 2. the 109
DBL would also be thinner for blades with bryozoa because the ciliary motion of the zoides 110
may create turbulence disturbing the laminar properties of the DBL; 3. the DBL oxygen 111
gradient would be thicker in future OA compared to current pH conditions because the 112
productivity of fleshy algae is expected to increase under OA (Kroeker et al. 2013); 4. oxygen 113
concentration will be lower on blades colonized by bryozoans than on bare blade as bryozoan 114
colonies can shade the tissue decreasing the intensity received and so the photosynthetic 115
efficiency of the blades (Muñoz, Cancino & Molina 1991). Finally, knowledge of oxygen and 116
pH fluctuations in these different conditions may give some clues on if DBL microenvironment 117
on kelp blades might be considered as refuge from OA because of the buffering effect of 118
seaweed metabolism to their surrounding pH, permitting temporal respite from very low 119
mainstream pH. 120
121
Material and methods 122
Sample collection and laboratory acclimation 123
7 Around 80 lateral blades from separate individuals of the kelp Ecklonia radiata were 124
collected using scissors, by snorkelling, in the Tinderbox reserve (-43.058177 S, 147.330749 125
E), close to Hobart (Tasmania, Australia) on 17th and 24th September 2015. Bare blades and
126
blades colonized by the bryozoan Membranipora membranacea were sampled each time. 127
Blades were similar in term of color and length, collected at the same depth (≈ 3-4 m) and the 128
bryozoan patches upon blades had a diameter of 3.1 ± 0.1 cm. Field collections were allowed 129
by permit provided by the Department of Primary Industries, Parks, Water and Environment of 130
Tasmania (n°15115). Blades freshly cut were transferred to the laboratory in a cool box to keep 131
them at the field temperature (13.5°C). They were then placed in a temperature controlled room 132
(13°C), in 0.1 µm filtered/UV sterilized seawater bubbled with air, under low light conditions 133
(50 µmol photons m-2 s-1), until the beginning of the experiment, to acclimate them to laboratory 134 conditions. 135 136 Experimental design 137
All the experiments were carried out after a 2-day acclimation period, between 2 and 5 138
days after collection. Experiments were conducted in a 46 L unidirectional recirculating flume 139
(see description in Hurd et al. 1994b) filled with 0.1 µm filtered/UV sterilized seawater to a 140
depth of 15 cm. This type of unidirectional flume is considered as a standard tool to test the 141
interactions between organisms and their surrounding flow even if it cannot perfectly mimic 142
the hydrodynamics in the field (Vogel 1999). The flume was initially cleaned with a 1% sodium 143
hydroxide (bleach) solution and neutralized with a 1% thiosulfate solution (Hurd et al. 1994b). 144
It was subsequently rinsed with tap water every day, at the end of the daily experiments, to 145
avoid any biofilm formation inside. The flume was filled with seawater at the beginning of each 146
day and 8 different Ecklonia blade samples were measured over the same day. 147
8 Four blade replicates were measured in each different combination of light, mainstream 148
pH, flow and epiphytic condition i.e. bare blade or presence of bryozoans (64 different blades 149
in total). Measurements were carried out in both the light, at a saturating irradiance of 120 µmol 150
photons m-2 s-1 provided by overhead lights (T8 840, 36W, Thorn Lighting, UK) and dark 151
conditions (< 2 µmol photons m-2 s-1). Irradiance was measured with a flat underwater quantum 152
sensor LI-250A (LI-COR, Lincoln, USA). Two pH conditions were tested, the current sea-153
surface average pHT = 8.09 (hereafter 8.1)and a lower pH levelpredicted for the end of the
154
century in the worst-case scenario for ocean acidification, pHT = 7.71 (hereafter 7.7) (Stocker
155
et al. 2013). The pH was adjusted by bubbling with 100% CO2 into the seawater until reaching
156
the expected level (Hurd et al. 2011). Light and pH treatments were randomized in order to 157
have a single combination of light and pH per experimental day. In total, 8 days were necessary 158
to run the measurements for all the possible combined conditions. 159
Every day, two mainstream seawater velocities were randomly tested, a fast one, > 8 cm 160
s-1 and a slow one, < 0.5 cm s-1. The flow characteristics in the different regimes were 161
determined in the middle of the flume using a field 10 MHz Acoustic Doppler Velocimeter 162
(Sontek, San Diego, CA, USA) before the start of the experiment. These velocities were chosen 163
because they represent speeds at which the DBL can reach maximal and minimal values 164
(Hansen, Hondzo & Hurd 2011) and they are similar to those observed within kelp beds in the 165
field (Jackson & Winant 1983; Gaylord et al. 2007; Kregting et al. 2011). Individual kelp blades 166
colonized or not by bryozoans were randomly assigned to the different flow treatments. Each 167
of the replicate blades were attached to an aluminium plate covered with plastic film so they 168
could not move during the trials. Measurements were always made at the top of a crenulation, 169
in the middle of the blade, in the middle of bryozoan patch (for the bryozoans present 170
condition), in the same position in the flume (Hurd & Pilditch 2011). 171
9 Diffusive boundary layer measurements
173
The characterization of the DBL, i.e. its thickness and the oxygen concentration and pH 174
gradient, was determined using a 50 µm O2 micro-sensor and a 50 µm micro-pH electrode
175
coupled with a reference electrode (Unisense, Aarhus, Denmark), for 4 replicates in each 176
combined conditions of light, flow, bulk seawater pH and epiphytism (presence or absence of 177
bryozoans). The electrodes were attached to a Unisense MM33-2 manual micromanipulator 178
(Unisense, Aarhus, Denmark). A minimum period of 30 min acclimation to each treatment 179
occurred prior to starting vertical profiles, allowing the DBL to form and stabilize. Profiles of 180
O2 concentration and pH were taken by placing the microelectrodes at the surface of the blade
181
and by sequentially increasing the height of the probes towards the mainstream seawater. The 182
measurements were made at 0.05, 0.1, 0.15, 0.2, 0.3, 0.4, 0.5, 0.6, 08, 1, 3, 5, 10 and 50 mm 183
(bulk seawater) above the blade surface, for 2 min each, logging O2 and pH every second.
184
Values were then averaged over 30 seconds after the initial peak induced by the movement of 185
the electrode. 186
DBL thickness: DBL thickness was calculated for each O2 profile, on the raw values,
187
and was defined as the greatest height above the surface of the blade at which the concentration 188
of O2 was <1 % per 0.1 mm for four subsequent measurements (Hurd et al. 2011; Cornwall et
189
al. 2015). 190
O2 profiles: To describe the profiles, O2 was first standardized by dividing the
191
concentration at any given profile location by the bulk seawater concentration measured at the 192
end of the profile. Profiles were then fitted and smoothed with an exponential equation: y = y0 193
+ α exp (-β x) with y: the standardized O
2 concentration, y0: a constant, α: the oxygen
194
standardized concentration when x = 0, β: the rate of change x: the distance from the blade. 195
10 Interfacial oxygen fluxes: net production in light and respiration in dark conditions were 196
defined as interfacial oxygen fluxes (Hofmann, Koch & de Beer 2016), calculated from the raw 197
concentration values of the profiles using Fick’s first law (Revsbech & Jørgensen 1986): 198
𝐽 = −𝐷 (𝑑𝑐 𝑑𝑥) 199
with J: interfacial oxygen fluxes in µmol O2 m-2 s-1, D: diffusion coefficient of oxygen in
200
seawater in m-2 s-1 (D = 1.66 10-9 at 13.2°C and salinity 37, value calculated with the R package 201
marelac), dc: the change in concentration in the DBL in µmol m-3 and dx: the thickness of the
202
DBL in m. 203
Data analyses: DBL thicknesses, interfacial fluxes and O2 standardized concentrations
204
at the surface of the blade (0 mm) were analyzed using 3-way ANOVAs with pH, flow and 205
presence/absence of bryozoan (factor called “blade”) as crossed orthogonal factors followed by 206
post-hoc SNK tests. A 3-way MANOVA with the same factors was used to compare the 207
estimated y0, α and β coefficients of the curves fitted to the profiles. The analyses were run 208
independently for light and dark conditions, except for comparing DBL thicknesses in which 209
measurements in the light and dark conditions were combined because the DBL thickness is 210
affected by physical factors as flow speed and roughness but not light. All statistical analyses 211
were performed using the R software, version 2.15.0 (R Core Team 2013) after the normality 212
and the homoscedasticity of the data have been checked. 213
pH profiles: pH values acquired along the profiles were first transformed in H+ 214
concentration with the equation [H+] = 10-pH (Riebesell et al. 2010). H+ concentrations were 215
then standardized as for oxygen, by dividing the concentration at any given profile location by 216
the mainstream seawater concentration measured at the end of the profile. Standardized values 217
where then converted back in pH values using the equation pH = -log [H+] to obtain profiles of
218
pH deviation from the mainstream pH in the DBL. Finally, linear regression wasused to explore 219
11 the relationship between pH deviation from the mainstream value and the standardized oxygen 220
concentrations along the DBL. 221
222
Seawater parameters 223
During the eight experimental days, temperature, salinity, pH and nutrients were 224
measured three times a day, i.e. after flume filling, at midday and before flume draining. 225
Temperature was logged using a Precision Multi Digital thermometer (Testo, Lenzkirsh, 226
Germany), salinity was measured with a refractometer (HI96882, Hanna Instruments, 227
Woonsocket, RI, USA) and pH was determined immediately after sampling using a Orion star 228
A111 pH meter coupled with a OrionRoss ultra pH/ATC triode (Thermo Scientific, Waltham, 229
MA, USA) and calibrated with 4, 7 and 10 pHNBS buffers. pH was standardized on the total
230
scale using TRIS buffers prepared as directed by (Dickson, Sabine & Christian 2007). Samples 231
for nutrients were frozen at -20°C until defrosted and analysed for nitrate (NO3-) and phosphate
232
(PO4-) using a QuickChem 8500 series 2 Automated Ion Analyzer (Lachat Instrument,
233
Loveland, CO, USA). Water for total alkalinity (AT) was sampled once a day, pre-test showing
234
that alkalinity did not vary along the day. AT samples were poisoned with mercuric chloride
235
(0.02% vol/vol; Dickson, Sabine & Christian 2007) pending analyses, made later at the 236
Australian National University, using an automatic built in-house titrator (consisting in a 5 mL 237
Tecan syringe pump (Cavro XCalibur Pump), a Pico USB controlled pH sensor, and a TPS pH 238
electrode). AT values were then calculated using the Gran technique (Dickson, Sabine &
239
Christian 2007). Seawater carbonate chemistry, i.e. CO2 partial pressure (pCO2), carbon
240
dioxide, bicarbonate and carbonate ions concentrations ([CO2], [HCO3-] and [CO32-]), dissolved
241
inorganic carbon (DIC), and the saturation state of aragonite and calcite (ΩAr,ΩCa) were
242
calculated from temperature, salinity, pH and AT values measured for each pHlevel with the
12 Seacarb package (Gattuso, Epitalon & Lavigne 2016) using constants from Mehrbach et al. 244
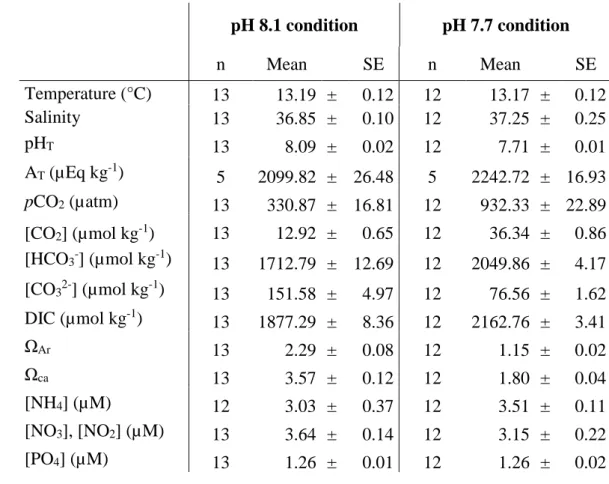
(1973) refitted by Dickson & Millero (1987). 245 246 Results 247 Seawater parameters 248
Average chemical parameters of the mainstream seawater at pH 8.1 and pH 7.7 249
conditions are given in Table 1. Standard errors of the values showed that the algae did not 250
strongly affect the bulk seawater chemistry, meaning that the physico-chemical parameters did 251
not vary during each daily experiment: the seawater was renewed each day. Seawater nutrients 252
of 3.4 µM for nitrate and ammonium and 1.3 µM for phosphate were within the normal range 253
for spring (Hepburn, Hurd & Frew 2006). According to the nutrient concentrations and DIC 254
values carbon or nitrogen limitation for photosynthesis are unlikely during our measurements. 255
256
DBL thickness 257
The average thickness of the DBL varied from 0.09 ± 0.03 mm (mean ± SE) in fast flow, 258
pH 7.7 conditions on bare blades to 0.94 ± 0.30 mm in slow flow and pH 8.1 condition, in the 259
presence of bryozoans on the blade (Figure 1). While pH did not affect the thickness of the 260
DBL, the flow (3-way ANOVA, df = 1, F = 25.908, p <0.001) and the presence of bryozoans 261
(3-way ANOVA, df = 1, F = 5.976, p = 0.018) had significant effects on its thickness. In slow 262
flow conditions, the DBL was always thicker than in fast flow conditions. Compared to bare 263
blades, the thickness of DBL was greater in blades colonized by bryozoans. 264
265
O2 profiles and interfacial fluxes
13 In both light and dark conditions, O2 profiles in fast flow treatments were much steeper
267
than in slow flow (Table 2, Gradient shape, p = 0.001 and 0.003 in light and dark conditions, 268
respectively), with initial oxygen concentration on the surface varying by 0.2 units (Figure 2 A, 269
B). Conversely, the oxygen gradients in slow flow treatments were more gradual, with a broader 270
range of O2 values from varying by 0.6 units (Figure 2 C, D). Under dark conditions, the
271
presence of bryozoans decreased the oxygen content within the DBL to a greater extent than on 272
bare blades regardless of the flow speed and the mainstream pH (Table 2, Gradient shape, p = 273
0.003). Thus, the shape of the profiles differed between fast and slow flow and in the presence 274
or absence of bryozoans in dark conditions, but no interactive effects were detected either in 275
the light or dark. 276
The mean standardized O2 concentration measured at the surface of the kelp blades in
277
the different conditions were differently affected by pH, flow and presence/absence of 278
bryozoans depending on the light conditions (Table 3). Under saturating light, O2
279
concentrations were > 1 because photosynthetic processes released oxygen. So the oxygen 280
concentration just above the blade was higher than in the mainstream seawater. In the light, O2
281
concentrations were significantly affected by pH (Table 2, surface [O2], p = 0.044) with higher
282
concentrations in pH 7.7 condition (1.14 ± 0.03) compared to pH 8.1 (1.25 ± 0.06). O2
283
concentrations were also significantly lower in fast than in slow flow (1.10 ± 0.03 and 1.28 ± 284
0.05, respectively, Table 2, surface [O2], p = 0.002). In the dark, standardized O2 concentrations
285
were < 1 because of the use of oxygen by respiration. In contrast to the light conditions, pH did 286
not affect the O2 levels at the surface in the dark. However, similar to the light conditions, they
287
varied according to the flow, being higher in fast flow treatments than in slow flow (0.91 ± 0.02 288
and 0.59 ± 0.06, Table 2, surface [O2], p > 0.001). The presence of bryozoans also significantly
289
decreased the oxygen concentrations at the surface compared to bare blades (0.68 ± 0.06 and 290
14 0.85 ± 0.05, respectively, Table 2, surface [O2], p = 0.008). No interactive effects were detected
291
either in the light or dark. 292
Interfacial fluxes in light condition were assimilated to net production (Table 3). Net 293
production increased significantly by 80% in pH 7.7 compared to pH 8.1 (0.30 ± 0.05 and 0.17 294
± 0.05 µmol m-2 s-1, respectively, Table 2, Interfacial flux, p = 0.049). The presence of 295
bryozoans also influenced the interfacial flux in the light (Table 2, Interfacial flux, p = 0.042). 296
Net production was higher on bare than epiphytized blades (0.29 ± 0.06 and 0.17 ± 0.04 µmol 297
m-2 s-1, respectively), likely due to the oxygen consumption by bryozoans. No significant effect 298
of pH, flow or blade state on respiration rate, i.e. interfacial fluxes in dark, were detected. 299
300
pH profiles and pH-O2 relationship (slow flow conditions only)
301
Among the 64 profiles measured, only 10 pH profiles in slow flow conditions were 302
useable due to technical issues with the microprobes. These profiles are presented in Figure 3, 303
which shows the variation in pH units from the mainstream seawater (increase in light 304
conditions and decrease in dark condition) for slow flow conditions, for bare blades and blades 305
with bryozoans, in the different mainstream pH conditions tested. On bare blades, pH variations 306
between light and dark were similar in both pH treatments, around 0.5 unit (Figure 3A). 307
However, pH at the blade surface in the pH 7.7 condition shifted towards higher values than 308
those measured in pH 8.1 treatment. In the light, the increase in photosynthesis at pH 7.7 309
elevated the mainstream pH by almost 0.3 units in the first µm of the DBL, compared to only 310
0.2 unit at pH 8.1. This means that the pH at the blade surface ranged from 7.8 to 8.3 in current 311
pH conditions and 7.5 to 8 in OA conditions, along daily cycles. For epiphytized blades at pH 312
8.1, the range of pH variation between light and dark was narrower than on bare blades (ΔpH 313
= 0.26 pH, Figure 3B). At pH 7.7, pH fluctuations on blades with bryozoans varied depending 314
on the profiles, with narrower or larger fluctuations than for the pH 8.1 condition. 315
15 The relationship between pH deviation from the mainstream value and oxygen 316
standardized values in the DBL was linear for bare blades, in both light and dark conditions (R² 317
= 0.95 to 0.99, p < 0.01, Figure 3C). The shape of the relationship for blades with bryozoans 318
were less obviously linear (Figure 3D) even if some of the linear regression were significant 319 (R² = 0.82 to 0.96). 320 321 Discussion 322
The fluctuations of oxygen concentrations and pH, occurring along DBL gradients in the 323
different conditions of light, flow, mainstream pH and epiphytism tested in our study showed 324
that interactions between abiotic and biotic factors can lead to unexpected chemical variations 325
in the microhabitats on the blades of the kelps and more generally on macrophytes (Koch 1994; 326
Short, Pedersen & Kendrick 2015; Hofmann, Koch & de Beer 2016). The presence of the 327
bryozoans on kelp blades increased the complexity of the habitat at the microscale. Particularly 328
in slow flow, DBL thickness increased, merging the algal DBL with that of the bryozoans’. The 329
interaction between the mainstream pH and the physiology of both kelp and epiphytes also led 330
to variations in oxygen concentrations and pH in the DBL which could afford protection from 331
future ocean acidification. This kind of interaction may enhance the resilience of organisms and 332
ecosystems to ocean acidification, even for those occurring on a microscale. 333
The thickness of the DBL was regulated by hydrodynamics, which engineer the laminar 334
layer above the blade where the chemical concentration gradient occurs. So, as we expected, 335
the DBLs were thin in faster flows, and thicker under slow flows. Seawater pH did not influence 336
the thickness of the DBL, in fast and slow flows, because physical processes set the maximum 337
thickness. The average thicknesses recorded for bare blades in our study for slow (~ 0.5 mm) 338
and fast flow (~ 0.1 mm) were within the range reported for Macrocystis sp., a genus closely 339
16 related to Ecklonia and the only other kelp for which DBL thickness have been measured (Hurd 340
2000 and references therein) and thinner (-50%) than those of coralline algae (Raven & Hurd 341
2012). 342
The thickness of the DBL was not only a factor of flow speed but was also affected by the 343
presence of bryozoans on E. radiata blades. Opposite to our second hypothesis, the DBL was 344
thicker on blades colonized by bryozoans (~ 0.8 mm in slow flow) than on bare blades (~ 0.3 345
mm in fast flow). The ciliary motion of zoides was expected to create turbulence, impacting the 346
building of the laminar layer above the blade. However, the presence of the bryozoan layer 347
increased the thickness of the DBL in all the conditions by creating their own DBL in addition 348
to the kelp’s one, essentially as a small canopy boundary layer (Cornwall et al. 2015). This 349
phenomenon has also been observed on Fucus species where the presence of hyaline hairs 350
increased the DBL thickness compared to hairless thalli (Spilling et al. 2010; Lichtenberg, 351
Nørregaard & Kühl 2017). The explanation is that small scale (µm - mm) surface topographical 352
features such as corrugations, the presence of hyaline hairs or the cilia of bryozoans likely 353
reduce the roughness Reynold’s number (Hurd et al. 1997; Hurd & Pilditch 2011; Lichtenberg, 354
Nørregaard & Kühl 2017) or create a local depression (Wangpraseurt et al. 2012) thus 355
increasing the DBL thickness. These engineering factors, flow velocity and the presence of 356
bryozoans, are therefore not only able to affect the thickness of the DBL but also can directly 357
and/or indirectly impact the chemical gradients occuring therein. 358
Measuring the oxygen gradient occurring in the DBL is a good way to understand and 359
characterize the surface micro-chemistry and how variable these fine-scale environments can 360
be (Shashar, Cohen & Loya 1993). Flow was the main factor which influenced the O2 gradients
361
within the DBL at the surface of E. radiata. However, net photosynthesis was similar in fast 362
and slow flow at the surface of E. radiata, suggesting that the photosynthetic process was not 363
mass-transfer limited by the thick DBL in fast slow flow conditions. This finding is similar to 364
17 that found for inorganic nitrogen uptake by the kelp Macrocystis pyrifera (Hurd et al. 1996) 365
while other studies report mass transfer limitation of photosynthesis (Carpenter & Williams 366
2007; Mass et al. 2010). As the DBL was very thin in fast flow, the profiles were very steep 367
and sharp in light and dark conditions and the standardized oxygen values were lower than in 368
slow flow because of fast diffusion of the oxygen molecules out of the DBL (Irwin & Davenport 369
2002; Irwin & Davenport 2010). Thus, the main differences between the other parameters 370
(mainstream pH, epiphytism) were better compared in slow flow conditions, as follows. 371
Net photosynthesis measured on blades increased with the pH decrease predicted for the 372
end of the century, in both bare and epiphytized blades while respiration remained similar in 373
both pH conditions. At pH 7.7, the standardised oxygen values measured in the light were 374
greater in the first 0.2 mm layers of the gradient, close to the kelp surface, than at pH 8.1, due 375
to the increase in photosynthesis. Because E. radiata is a HCO3--user for photosynthesis
376
(Falkenberg, Russell & Connell 2013; Cornwall, Revill & Hurd 2015; Britton et al. 2016), the 377
greater CO2 availability related to the pH decrease may not benefit the photosynthesis process
378
(Koch et al. 2013, Britton et al. 2016), as shown for Macrocystis pyrifera (Fernández, Roleda 379
& Hurd 2015). However the conversion of HCO3- to CO2, the substratum required by the
380
enzyme RuBisCO, implies carbon concentrating mechanism(s) (CCM) which require more 381
energy than the passive diffusion of CO2 (Giordano, Beardall & Raven 2005; Raven & Beardall
382
2014). Thus, the increase in both CO2 availability and passive diffusion at pH 7.7 may provide
383
an advantage to E. radiata, reducing energetic costs of CCMs and helping to increase primary 384
production (Cornwall et al. 2012; Raven, Beardall & Giordano 2014). 385
The presence of bryozoans on the kelp blades was correlated to a decrease in the 386
standardized O2 concentrations in the DBL compared to bare blades. Net photosynthesis was
387
lower on epiphytised blades as the bryozoans likely used oxygen produced by the algae for 388
respiration. Bryozoans might also have caused shading on the algal blade, decreasing its 389
18 photosynthetic efficiency (Muñoz, Cancino & Molina 1991). However, no change in 390
chlorophyll a content was detected between bare and epiphytised blades (see Supporting 391
Informations), supporting the findings of prior studies that reveal a lack of bryozoan effect on 392
pigment acclimation of kelp blades, and thus on photosynthetic efficiency (Hepburn, Hurd & 393
Frew 2006). The bryozoans’ contribution to the oxygen concentration gradient was particularly 394
obvious in the dark at pH 8.1, where standardized oxygen values of blades colonized by 395
bryozoans were two-times lower than on bare blades. This trend was less pronounced at pH 7.7 396
in the dark whereby the DBL oxygen concentrations looked similar for epiphytized and bare 397
blades. The pH decrease in the mainstream seawater did not affect the respiration rates of the 398
epiphyte/blade complex at the blade surface likely because bryozoans present a great plasticity 399
and different strategies which enable them to cope with pH decrease (Swezey et al. 2017a; 400
Swezey et al. 2017b). Moreover, the pH flucutations occuring in the micro-environment of 401
seaweeds can reach very low levels, from 8.1 down to 7.0 in the dark (De Beer & Larkum 2001; 402
Hurd et al. 2011) and bryozoans living upon the blades may be used to these daily drops in the 403
surrounding pH. 404
It is more and more recognized that the biological activity of both the seaweeds and their 405
epibionts can generate pH fluctuations with ranges, rates and magnitude of change that mask 406
the long-term trend predicted for the open ocean (Krause-Jensen et al. 2015; Hendriks et al. 407
2017; Wahl et al. 2017). pH measured at the surface of bare blades of E. radiata was linearly 408
correlated to the oxygen values recorded in the DBL in light as in dark conditions, as it has been 409
shown for other seaweeds (De Beer & Larkum 2001; Larkum, Koch & Kühl 2003; Cornwall et 410
al. 2013b). In slow flow, the mean daily pH in the first layers of the DBL remained higher in a 411
mainstream pH 8.1 compared to 7.7, similar to the findings for coralline algae (Cornwall et al. 412
2013b). However, pH fluctuations occurring in the DBL at low mainstream pH could reach pH 413
values > 7.7 in the light, likely providing respite conditions from the corrosive mainstream 414
19 seawater. This rise in pH at the blade surface compared to the bulk seawater pH has also been 415
measured in other macrophytes, with an increase from 0.4 to 1.2 pH unit (Hendricks et al. 416
2017). In our study, the presence of bryozoans narrowed the pH range experienced at the blade 417
surface in pH 8.1 condition compared to bare blades, restricting the exposure of bryozoans to 418
low pH values. In low pH conditions, however, the intensity of DBL pH fluctuation differed 419
depending on the profiles, maybe because of individual-specific responses of bryozoans to pH 420
due to phenotypic variance (Eriander, Wrange & Havenhand 2015). Overall, the shift in the 421
range of pH in the DBL towards higher values than the bulk seawater and narrower fluctuations 422
in the presence of bryozoans could lead to local chemical conditions which may be more 423
favorable than those of the mainstream seawater for organisms living on top or under the blades. 424
Thus, DBL microhabitats may constitute a refuge from the general pH decline predicted in the 425
context of ocean acidification. Such variations have also been evidenced at the blade surface of 426
green algae and seagrasses (Hendricks et al. 2017), extending the concept of OA refuge for 427
small and understory organisms to other macrophytes. 428
The substantial fluctuations in O2 concentration and pH reported here in the DBL and in
429
other studies on macrophytes (e.g. Hofmann et al. 2016; Hendrick et al. 2017) may represent 430
an alternation between stressful periods and release from pH stress for organisms associated 431
with seaweeds (Shashar, Cohen & Loya 1993; Wahl, Saderne & Sawall 2016). Living in 432
microhabitats with high fluctuations of environmental variables would be particularly 433
interesting for calcifying organisms in the context of ocean acidification. In fluctuating 434
environments, calcifiers may be less exposed, at least for a shorter period (Wahl et al. 2015), to 435
corrosive low pH/carbonate chemistry parameters which might decrease the dissolution process 436
and help them to cope with ocean acidification (Cornwall et al. 2014; Wahl et al. 2017). 437
Calcifiers such as mussels are able to take advantage of these fluctuations by shifting the 438
majority of their costly physiological processes, including calcification, to times when the 439
20 surrounding chemical conditions are more favorable (i.e. daytime) (Wahl et al. 2017). The DBL 440
chemical microhabitat could also constitute refuge and benefit other small invertebrates for 441
whom ocean acidification can affect the regulation of cellular homeostasis (Melzner et al. 442
2009). They might then represent interesting and attractive settlement sites for early life stage 443
of invertebrates which are supposed to lack efficient acid-base regulation systems (Byrne 2011). 444
Organisms which regularly encounter such strong fluctuations might be better able to 445
survive in the lower average pH seawater of the future, because they may present higher 446
phenotypic plasticity (Hurd et al. 2011; Boyd et al. 2016). Transient transgressions of tolerance 447
thresholds followed by relaxation periods in fluctuating regimes may not only favor high 448
phenotypic plasticity but may also select for more robust genotypes (Melzner et al. 2009; 449
Frieder et al. 2014). Thus the microenvironment of the DBL, particularly in slow flows, may 450
act as a stop-gap, enabling calcifiers and other organisms to acclimatize or adapt to lower pH 451
conditions projected for the coming decades (Hurd 2015). 452
The concept of refuge highlighted in this study can be generalized for the DBL 453
environments at the surface of kelp blades towards larger scales under the influence of biogenic 454
fluctuations created by macrophytes. Different studies have shown that oxygen and pH 455
fluctuations recorded in seagrass meadows (Unsworth et al. 2012; Hendriks et al. 2014; Saderne 456
et al. 2015) and seaweeds beds (Buapet, Gullström & Björk 2013; Pajusalu et al. 2013; Wahl 457
et al. 2017) were masking the global pH decrease predicted in the context of OA. These specific 458
chemical habitats dominated by macrophytes could help in mitigating the negative impact of 459
ocean acidification on calcifiers which live on the blades, in the canopy and in understory 460
(Semesi, Beer & Bjork 2009; Cox et al. 2017). They would not only provide temporal and 461
spatial refuge, enabling species to better cope with stressful conditions, but they could also 462
constitute selective areas facilitating the hardening of some populations and then, helping in 463
conserving resistant locally adapted populations. 464
21 465
Acknowledgments 466
The authors thank Clara Peron for her assistance during sampling and data analyses, 467
Pamela Fernandez for nutrient analyses and Michael Ellwood for alkalinity determination. 468
Fanny Noisette was supported by an Endeavour Research Fellowship from the Australian 469
Government. This work included the use of invertebrates (bryozoans) and seaweeds. Their 470
collection was allowed by a permit provided by the Department of Primary Industries, Parks, 471
Water and Environment of Tasmania (n°15115). All applicable institutional and/or national 472
guidelines for the care and use of living organisms were followed. 473
474
Author contribution: 475
FN and CH conceived and designed the experiments. FN performed the experiments and 476
analyzed the data. FN and CH wrote the manuscript. 477
478
Data accessibility 479
All data from this article will be available on Pangaea database, under OA-ICC data 480
compilation, with a digital object identifier DOI assigned later. 481
482
References 483
Boyd, P.W., Cornwall, C.E., Davison, A., Doney, S.C., Fourquez, M., Hurd, C.L., Lima, I.D. 484
& McMinn, A. (2016) Biological responses to environmental heterogeneity under 485
future ocean conditions. Global Change Biology, 22 (8), 2633–2650 486
22 Britton, D., Cornwall, C.E., Revill, A.T., Hurd, C.L. & Johnson, C.R. (2016) Ocean 487
acidification reverses the positive effects of seawater pH fluctuations on growth and 488
photosynthesis of the habitat-forming kelp, Ecklonia radiata. Scientific Reports, 6, 489
26036. 490
Brodersen, K.E., Lichtenberg, M., Paz, L.-C. & Kühl, M. (2015) Epiphyte-cover on seagrass 491
(Zostera marina L.) leaves impedes plant performance and radial O2 loss from the 492
below-ground tissue. Frontiers in Marine Science, 2, 58. 493
Buapet, P., Gullström, M. & Björk, M. (2013) Photosynthetic activity of seagrasses and 494
macroalgae in temperate shallow waters can alter seawater pH and total inorganic 495
carbon content at the scale of a coastal embayment. Marine and Freshwater Research, 496
64, 1040-1048. 497
Byrne, M. (2011) Impact of ocean warming and ocean acidification on marine invertebrate 498
life history stages: vulnerabilities and potential for persistence in a changing ocean. 499
Oceanography and Marine Biology: An Annual Review (eds R. Gibson, R. Atkinson, 500
J. Gordon, I. Smith & D. Hughes), pp. 1-42. Taylor & Francis. 501
Carpenter, R.C. & Williams, S.L. (2007) Mass transfer limitation of photosynthesis of coral 502
reef algal turfs. Marine Biology, 151, 435-450. 503
Cornwall, C.E., Boyd, P.W., McGraw, C.M., Hepburn, C.D., Pilditch, C.A., Morris, J.N., 504
Smith, A.M. & Hurd, C.L. (2014) Diffusion boundary layers ameliorate the negative 505
effects of ocean acidification on the temperate coralline macroalga Arthrocardia 506
corymbosa. Plos One, 9, e97235. 507
Cornwall, C.E., Hepburn, C.D., McGraw, C.M., Currie, K.I., Pilditch, C.A., Hunter, K.A., 508
Boyd, P.W. & Hurd, C.L. (2013a) Diurnal fluctuations in seawater pH influence the 509
response of a calcifying macroalga to ocean acidification. Proceedings of the Royal 510
Society B: Biological Sciences, 280, 2013-2201. 511
23 Cornwall, C.E., Hepburn, C.D., Pilditch, C.A. & Hurd, C.L. (2013b) Concentration boundary 512
layers around complex assemblages of macroalgae: Implications for the effects of ocean 513
acidification on understory coralline algae. Limnology & Oceanography, 58, 121-130. 514
Cornwall, C.E., Hepburn, C.D., Pritchard, D., Currie, K.I., McGraw, C.M., Hunter, K.A. & 515
Hurd, C.L. (2012) Carbon-use strategies in macroalgae: differential responses to 516
lowered pH and implications for ocean acidification Journal of Phycology, 48, 137-144. 517
Cornwall, C.E., Pilditch, C.A., Hepburn, C.D. & Hurd, C.L. (2015) Canopy macroalgae 518
influence understorey corallines’ metabolic control of near-surface pH and oxygen 519
concentration. Marine Ecology Progress Series, 525, 81-95. 520
Cornwall, C.E., Revill, A.T. & Hurd, C.L. (2015) High prevalence of diffusive uptake of CO2 521
by macroalgae in a temperate subtidal ecosystem. Photosynthesis research, 124, 181-522
190. 523
Cox, T.E., Nash, M., Gazeau, F., Déniel, M., Legrand, E., Alliouane, S., Mahacek, P., Le Fur, 524
A., Gattuso, J.-P. & Martin, S. (2017) Effects of in situ CO2 enrichment on Posidonia 525
oceanica epiphytic community composition and mineralogy. Marine Biology, 164, 526
103. 527
De Beer, D., Kühl, M., Stambler, N. & Vaki, L. (2000) A microsensor study of light enhanced 528
Ca 2+ uptake and photosynthesis in the reef-building hermatypic coral Favia sp. 529
Marine Ecology Progress Series, 194, 75-85. 530
De Beer, D. & Larkum, A.W.D. (2001) Photosynthesis and calcification in the calcifying algae 531
Halimeda discoidea studied with microsensors. Plant Cell and Environment, 24, 1209-532
1217. 533
De Beer, D. & Larkum, A.W.D. (2001) Photosynthesis and calcification in the calcifying 534
algae Halimeda discoidea studied with microsensors. Plant Cell and Environment, 24, 535
1209-1217. 536
24 Delille, B., Borges, A. & Delille, D. (2009) Influence of giant kelp beds (Macrocystis pyrifera) 537
on diel cycles of pCO 2 and DIC in the Sub-Antarctic coastal area. Estuarine, Coastal 538
and Shelf Science, 81, 114-122. 539
Delille, B., Delille, D., Fiala, M., Prevost, C. & Frankignoulle, M. (2000) Seasonal changes of 540
pCO2 over a subantarctic Macrocystis kelp bed. Polar Biology, 23, 706-716. 541
Denny, M. (2015) Ecological mechanics: Principles of life's physical interactions. Princeton 542
University Press. 543
Dickson, A.G. & Millero, F.J. (1987) A comparison of the equilibrium constants for the 544
dissociation of carbonic acid in seawater media. Deep Sea Research, 34, 1733-1743. 545
Dickson, A.G., Sabine, C.L. & Christian, J.R. (2007) Guide to best practices for ocean CO2
546
measurements. PICES special publication, pp. 176. North Pacific Marine Science 547
Organization, Sidney, British Columbia. 548
Dworjanyn, S., De Nys, R. & Steinberg, P. (2006) Chemically mediated antifouling in the red 549
alga Delisea pulchra. Marine Ecology Progress Series, 318, 153-163. 550
Eriander, L., Wrange, A.-L. & Havenhand, J.N. (2015) Simulated diurnal pH fluctuations 551
radically increase variance in—but not the mean of—growth in the barnacle Balanus 552
improvisus. ICES Journal of Marine Science: Journal du Conseil. 553
Falkenberg L, Russell B, Connell S (2013) Contrasting resource limitations of marine primary 554
producers: implications for competitive interactions under enriched CO2 and nutrient 555
regimes. Oecologia, 172, 575-583. 556
Fernández, P.A., Roleda, M.Y. & Hurd, C.L. (2015) Effects of ocean acidification on the 557
photosynthetic performance, carbonic anhydrase activity and growth of the giant kelp 558
Macrocystis pyrifera. Photosynthesis research, 124 (3) 293-304. 559
25 Frieder, C.A., Gonzalez, J.P., Bockmon, E.E., Navarro, M.O. & Levin, L.A. (2014) Can 560
variable pH and low oxygen moderate ocean acidification outcomes for mussel larvae? 561
Global Change Biology, 20 (3), 754-764 562
Frieder, C., Nam, S., Martz, T. & Levin, L. (2012) High temporal and spatial variability of 563
dissolved oxygen and pH in a nearshore California kelp forest. Biogeosciences, 9, 3917-564
3930. 565
Gattuso, J.-P., Epitalon, J.-M. & Lavigne, H. (2016) seacarb: Seawater Carbonate Chemistry. 566
R package version 3.0.13. http://CRAN.R-project.org/package=seacarb. 567
Gattuso, J.-P. & Hansson, L. (2011) Ocean acidification. pp. 326. Oxford University Press. 568
Gaylord, B., Rosman, J.H., Reed, D.C., Koseff, J.R., Fram, J., MacIntyre, S., Arkema, K., 569
McDonald, C., Brzezinski, M.A. & Largier, J.L. (2007) Spatial patterns of flow and 570
their modification within and around a giant kelp forest. Limnology and Oceanography, 571
52, 1838-1852. 572
Giordano, M., Beardall, J. & Raven, J.A. (2005) CO2 concentrating mechanisms in algae:
573
mechanisms, environmental modulation, and evolution. Annual Review of Plant 574
Biology, pp. 99-131. Annual Reviews, Palo Alto. 575
Hansen, A.T., Hondzo, M. & Hurd, C.L. (2011) Photosynthetic oxygen flux by Macrocystis 576
pyrifera: a mass transfer model with experimental validation. Marine Ecology Progress 577
Series, 434, 45-55. 578
Hendriks, I.E., Duarte, C.M., Olsen, Y.S., Steckbauer, A., Ramajo, L., Moore, T.S., Trotter, 579
J.A. & McCulloch, M. (2015) Biological mechanisms supporting adaptation to ocean 580
acidification in coastal ecosystems. Estuarine, Coastal and Shelf Science, 152, A1-A8. 581
Hendriks, I.E., Duarte, C.M., Marbà, N. & Krause-Jensen, D. (2017) pH gradients in the 582
diffusive boundary layer of subarctic macrophytes. Polar Biology, 1-6. 583
26 Hendriks, I.E., Olsen, Y.S., Ramajo, L., Basso, L., Steckbauer, A., Moore, T.S., Howard, J. & 584
Duarte, C.M. (2014) Photosynthetic activity buffers ocean acidification in seagrass 585
meadows. Biogeosciences, 11, 333-346. 586
Hepburn, C.D., Frew, R.D. & Hurd, C.L. (2012) Uptake and transport of nitrogen derived from 587
sessile epifauna in the giant kelp Macrocystis pyrifera. Aquatic Biology, 14, 121-128. 588
Hepburn, C.D. & Hurd, C.L. (2005) Conditional mutualism between the giant kelp Macrocystis 589
pyrifera and colonial epifauna. Marine Ecology Progress Series, 302, 37-48. 590
Hepburn, C.D., Hurd, C.L. & Frew, R.D. (2006) Colony structure and seasonal differences in 591
light and nitrogen modify the impact of sessile epifauna on the giant kelp Macrocystis 592
pyrifera (L.) C Agardh. Hydrobiologia, 560, 373-384. 593
Hofmann, L.C., Koch, M. & de Beer, D. (2016) Biotic Control of Surface pH and Evidence of 594
Light-Induced H+ Pumping and Ca2+-H+ Exchange in a Tropical Crustose Coralline 595
Alga. Plos One, 11, e0159057. 596
Hurd, C.L. (2000) Water motion, marine macroalgal physiology, and production. Journal of 597
Phycology, 36, 453-472. 598
Hurd, C.L. (2015) Slow flow habitats as refugia for coastal calcifiers from ocean acidification. 599
Journal of Phycology, 51, 599-605. 600
Hurd, C.L., Cornwall, C.E., Currie, K., Hepburn, C.D., McGraw, C.M., Hunter, K.A. & Boyd, 601
P.W. (2011) Metabolically induced pH fluctuations by some coastal calcifiers exceed 602
projected 22nd century ocean acidification: a mechanism for differential susceptibility?
603
Global Change Biology, 17, 3254-3262. 604
Hurd, C.L., Durante, K.M., Chia, F.S. & Harrison, P.J. (1994a) Effect of bryozoan colonization 605
on inorganic nitrogen acquisition by the kelps Agarum fimbriatum and Macrocystis 606
integrifolia. Marine Biology, 121, 167-173. 607
27 Hurd, C.L., Harrison, P.J., Bischof, K. & Lobban, C.S. (2014) Seaweed ecology and physiology. 608
Cambridge University Press. 609
Hurd, C.L. & Pilditch, C.A. (2011) Flow induced morphological variations affect diffusion 610
boundary layer thickness of Macrocystis pyrifera (Heterokontophyta, Laminariales) 611
Journal of Phycology, 47, 341-351. 612
Hurd, C.L., Quick, M., Stevens, C.L., Laval, B.E., Harrison, P.J. & Druehl, L.D. (1994b) A 613
low-volume flow tank for measuring nutrient uptake by large macrophytes. Journal of 614
Phycology, 30, 892-896. 615
Hurd, C.L., Stevens, C.L., Laval, B.E., Lawrence, G. & Harrison, P. (1997) Visualization of 616
seawater flow around morphologically distinct forms of the giant kelp Macrocystis 617
integrifolia from wave-sheltered and exposed sites. Limnology and Oceanography, 42, 618
156-163. 619
Irwin, S. & Davenport, J. (2002) Hyperoxic boundary layers inhabited by the epiphytic 620
meiofauna of Fucus serratus. Marine Ecology Progress Series, 244, 73-79. 621
Irwin, S. & Davenport, J. (2010) Oxygen microenvironment of coralline algal tufts and their 622
associated epiphytic animals. Biology and Environment: Proceedings of the Royal Irish 623
Academy, pp. 185-193. JSTOR. 624
Jackson, G.A. & Winant, C.D. (1983) Effect of a kelp forest on coastal currents. Continental 625
Shelf Research, 2, 75-80. 626
Koch, E.W. (1994) Hydrodynamics, diffusion-boundary layers and photosynthesis of the 627
seagrasses Thalassia testudinum and Cymodocea nodosa. Marine Biology, 118, 767-628
776. 629
Koch, M., Bowes, G., Ross, C. & Zhang, X.H. (2013) Climate change and ocean acidification 630
effects on seagrasses and marine macroalgae. Global Change Biology, 19, 103-132. 631
28 Krause-Jensen, D., Duarte, C.M., Hendriks, I.E., Meire, L., Blicher, M.E., Marbà, N. & Sejr, 632
M.K. (2015) Macroalgae contribute to nested mosaics of pH variability in a subarctic 633
fjord. Biogeosciences, 12, 4895-4911. 634
Kregting, L.T., Stevens, C.L., Cornelisen, C.D., Pilditch, C.A. & Hurd, C.L. (2011) Effects of 635
a small-bladed macroalgal canopy on benthic boundary layer dynamics: implications 636
for nutrient transport. Aquatic Biology, 14, 41-56. 637
Kroeker, K.J., Kordas, R.L., Crim, R., Hendriks, I.E., Ramajo, L., Singh, G.S., Duarte, C.M. & 638
Gattuso, J.-P. (2013) Impacts of ocean acidification on marine organisms: quantifying 639
sensitivities and interaction with warming. Global Change Biology, 19, 1884-1896. 640
Kühl, M., Cohen, Y., Dalsgaard, T., Jørgensen, B. & Revsbech, N.P. (1995) Microenvironment 641
and photosynthesis of zooxanthellae in scleractinian corals studied with microsensors 642
for 02, pH and light. Mar. Ecol. Prog. Ser, 117, 159-172. 643
Larkum, A.W.D., Koch, E.M.W. & Kühl, M. (2003) Diffusive boundary layers and 644
photosynthesis of the epilithic algal community of coral reefs. Marine Biology, 142, 645
1073-1082. 646
Lichtenberg, M., Nørregaard, R.D. & Kühl, M. (2017) Diffusion or advection? Mass transfer 647
and complex boundary layer landscapes of the brown alga Fucus vesiculosus. Journal 648
of The Royal Society Interface, 14, 20161015. 649
Mass, T., Genin, A., Shavit, U., Grinstein, M. & Tchernov, D. (2010) Flow enhances 650
photosynthesis in marine benthic autotrophs by increasing the efflux of oxygen from 651
the organism to the water. Proceedings of the National Academy of Sciences, 107, 2527-652
2531. 653
Mehrbach, C., Culberso.Ch, Hawley, J.E. & Pytkowic, R.M. (1973) Measurement of apparent 654
dissociation-constants of carbonic-acid in seawater at atmospheric-pressure. Limnology 655
& Oceanography, 18, 897-907. 656
29 Melzner, F., Gutowska, M.A., Langenbuch, M., Dupont, S., Lucassen, M., Thorndyke, M.C., 657
Bleich, M. & Pörtner, H.-O. (2009) Physiological basis for high CO2 tolerance in marine
658
ectothermic animals: pre-adaptation through lifestyle and ontogeny? Biogeosciences, 6, 659
2313-2331. 660
Muñoz, J., Cancino, J. & Molina, M. (1991) Effect of encrusting bryozoans on the physiology 661
of their algal substratum. Journal of the Marine Biological Association of the United 662
Kingdom, 71, 877-882. 663
Pajusalu, L., Martin, G., Põllumäe, A. & Paalme, T. (2013) Results of laboratory and field 664
experiments of the direct effect of increasing CO2 on net primary production of 665
macroalgal species in brackish-water ecosystems. Proceedings of the Estonian Academy 666
of Sciences, 62, 148-154. 667
Pearson, G.A., Serrão, E.A. & Brawley, S.H. (1998) Control of gamete release in fucoid algae: 668
sensing hydrodynamic conditions via carbon acquisition. Ecology, 79, 1725-1739. 669
R Core Team (2013) R: a language and environment for statistical computing. R Foundation 670
for Statistical Computing, Vienna, Austria. 671
Raven, J. (1997) Inorganic carbon acquisition by marine autotrophs. Adv. Bot. Res, 27, 85-209. 672
Raven, J.A. & Beardall, J. (2014) CO2 concentrating mechanisms and environmental change. 673
Aquatic Botany, 118, 24-37. 674
Raven, J.A., Beardall, J. & Giordano, M. (2014) Energy costs of carbon dioxide concentrating 675
mechanisms in aquatic organisms. Photosynthesis research, 121, 111-124. 676
Raven, J.A. & Hurd, C.L. (2012) Ecophysiology of photosynthesis in macroalgae. 677
Photosynthesis research, 113, 105-125. 678
Reed, D.C. & Foster, M.S. (1984) The effects of canopy shadings on algal recruitment and 679
growth in a giant kelp forest. Ecology, 65, 937-948. 680
30 Revsbech, N.P. & Jørgensen, B.B. (1986) Microelectrodes: their use in microbial ecology. 681
Advances in microbial ecology, pp. 293-352. Springer. 682
Riebesell, U., Fabry, V.J., Hansson, L. & Gattuso, J.-P. (2010) Guide to best practices for ocean 683
acidification research and data reporting. pp. 258. Luxembourg: Publications Office of 684
the European Union 685
Rosman, J.H., Monismith, S.G., Denny, M.W. & Koseff, J.R. (2010) Currents and turbulence 686
within a kelp forest (Macrocystis pyrifera): Insights from a dynamically scaled 687
laboratory model. Limnology and Oceanography, 55, 1145. 688
689
Short, J., Pedersen, O. & Kendrick, G. (2015) Turf algal epiphytes metabolically induce local 690
pH increase, with implications for underlying coralline algae under ocean acidification. 691
Estuarine, Coastal and Shelf Science, 164, 463-470. 692
Saderne, V., Fietzek, P., Aßmann, S., Körtzinger, A. & Hiebenthal, C. (2015) Seagrass beds as 693
ocean acidification refuges for mussels? High resolution measurements of pCO2 and 694
O2 in a Zostera marina and Mytilus edulis mosaic habitat. Biogeosciences Discuss., 12, 695
11423-11461. 696
Saderne, V., Fietzek, P. & Herman, P.M.J. (2013) Extreme variations of pCO2 and pH in a
697
macrophyte meadow of the baltic sea in summer: evidence of the effect of 698
photosynthesis and local upwelling. Plos One, 8, e62689. 699
Saderne, V. & Wahl, M. (2013) Differential responses of calcifying and non-calcifying 700
epibionts of a brown macroalga to present-day and future upwelling pCO2. Plos One, 8,
701
e70455. 702
Sand-Jensen, K., Revsbech, N.P. & Jörgensen, B.B. (1985) Microprofiles of oxygen in epiphyte 703
communities on submerged macrophytes. Marine Biology, 89, 55-62. 704
31 Schaffelke, B. (1999) Particulate organic matter as an alternative nutrient source for tropical 705
Sargassum species (Fucales, Phaeophyceae). Journal of Phycology, 35, 1150-1157. 706
Semesi, I.S., Beer, S. & Bjork, M. (2009) Seagrass photosynthesis controls rates of calcification 707
and photosynthesis of calcareous macroalgae in a tropical seagrass meadow. Marine 708
Ecology-Progress Series, 382, 41-47. 709
Shashar, N., Cohen, Y. & Loya, Y. (1993) Extreme diel fluctuations of oxygen in diffusive 710
boundary layers surrounding stony corals. The Biological Bulletin, 185, 455-461. 711
Spilling, K., Titelman, J., Greve, T.M. & Kuhl, M. (2010) Microsensor Measurements of the 712
External and Internal Microenvironment of Fucus Vesiculosus (Phaeophyceae). Journal 713
of Phycology, 46, 1350-1355. 714
Steneck, R.S., Graham, M.H., Bourque, B.J., Corbett, D., Erlandson, J.M., Estes, J.A. & Tegner, 715
M.J. (2002) Kelp forest ecosystems: biodiversity, stability, resilience and future. 716
Environmental conservation, 29, 436-459. 717
Stocker, T.F., Qin, D., Plattner, G.-K., Tignor, M., Allen, S.K., Boschung, J., Nauels, A., Xia, 718
Y., Bex, V. & Midgley, P.M. (2013) Climate Change 2013. The Physical Science Basis. 719
Working Group I Contribution to the Fifth Assessment Report of the Intergovernmental 720
Panel on Climate Change. (ed. C.U. Press). Groupe d'experts intergouvernemental sur 721
l'evolution du climat/Intergovernmental Panel on Climate Change-IPCC, C/O World 722
Meteorological Organization, 7bis Avenue de la Paix, CP 2300 CH-1211 Geneva 2 723
(Switzerland), Cambridge, United Kingdom and New York, NY, USA. 724
Swezey, D.S., Bean, J.R., Hill, T.M., Gaylord, B., Ninokawa, A.T. & Sanford, E. (2017a) 725
Plastic responses of bryozoans to ocean acidification. The Journal of experimental 726
biology, 220, 4399-4409. 727
Swezey, D.S., Bean, J.R., Ninokawa, A.T., Hill, T.M., Gaylord, B. & Sanford, E. (2017b) 728
Interactive effects of temperature, food and skeletal mineralogy mediate biological 729
32 responses to ocean acidification in a widely distributed bryozoan. Proceedings of the 730
Royal Society B: Biological Sciences, 284. 731
Unsworth, R.K., Collier, C.J., Henderson, G.M. & McKenzie, L.J. (2012) Tropical seagrass 732
meadows modify seawater carbon chemistry: implications for coral reefs impacted by 733
ocean acidification. Environmental Research Letters, 7, 024026. 734
Vogel, S. (1999) Life in Moving Fluids: The Physical Biology of Flow, 2nd edn. Princeton 735
University Press, Princeton, NJ, USA. 736
Wahl, M., Buchholz, B., Winde, V., Golomb, D., Guy‐Haim, T., Müller, J., Rilov, G., Scotti, 737
M. & Böttcher, M.E. (2015) A mesocosm concept for the simulation of near‐natural 738
shallow underwater climates: The Kiel Outdoor Benthocosms (KOB). Limnology and 739
Oceanography: Methods, 13, 651-663. 740
Wahl, M., Saderne, V. & Sawall, Y. (2016) How good are we at assessing the impact of ocean 741
acidification in coastal systems? Limitations, omissions and strengths of commonly 742
used experimental approaches with special emphasis on the neglected role of 743
fluctuations. Marine and Freshwater Research, 67, 25-36. 744
Wahl, M., Schneider Covachã, S., Saderne, V., Hiebenthal, C., Müller, J.D., Pansch, C. & 745
Sawall, Y. (2017) Macroalgae may mitigate ocean acidification effects on mussel 746
calcification by increasing pH and its fluctuations. Limnology and Oceanography, in 747
press, 10.1002/lno.10608 748
Wangpraseurt, D., Weber, M., Røy, H., Polerecky, L., de Beer, D., Suharsono & Nugues, M.M. 749
(2012) In situ oxygen dynamics in coral-algal interactions. Plos One, 7, e31192 750
Wheeler, W. (1980) Effect of boundary layer transport on the fixation of carbon by the giant 751
kelp Macrocystis pyrifera. Marine Biology, 56, 103-110. 752