Technology researchers and makes it freely available over the web where possible.
This is an author-deposited version published in:
https://sam.ensam.eu
Handle ID: .
http://hdl.handle.net/10985/11407
To cite this version :
Florence DANGLADE, Philippe VERON, Jean-Philippe PERNOT, Lionel FINE - Estimation of
CAD model simplification impact on CFD analysis using machine learning techniques - In:
ComputerAided Design and Applications (Londres: 2015 : 15), RoyaumeUni, 201506
-Proceedings of Computer-Aided Design and Applications (CAD’15) - 2015
Any correspondence concerning this service should be sent to the repository
Administrator :
[email protected]
Proceedings of CAD’15, London, UK, June 22-25, 2015, aaa-bbb © 2015 CAD Solutions, LLC, http://www.cadconferences.com
Title:
Estimation of CAD model simplification impact on CFD analysis using machine learning techniques Authors:
Florence Danglade, [email protected], LSIS - UMR CNRS 7296 Arts et Métiers ParisTech Aix-en-Provence France
Philippe Véron, [email protected], LSIS - UMR CNRS 7296 Arts et Métiers ParisTech Aix-en-Provence France
Jean-Philippe Pernot, [email protected], LSIS - UMR CNRS 7296 Arts et Métiers ParisTech Aix-en-Provence France
Lionel Fine, [email protected], AIRBUS Group Innovations Suresnes France Keywords:
CAD/FEA transfer; CAD model simplification; Machine learning DOI: 10.14733/cadconfP.2015.xxx-yyy
Introduction:
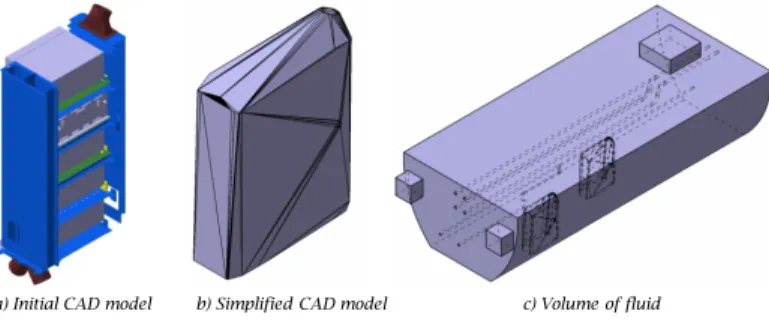
In the field of transfer from Computer-Aided Design (CAD) to Finite Element Analysis (FEA), preparation processes based on CAD model simplification ensure the quality and the reliability of analysis results. For convective heat transfer analysis, the analysis computation is based on a mesh of a fluid volume wrapping the simplified CAD model (Fig. 1 c). A huge number of elements are necessary to mesh all the local details. Without simplification, the CAD model of the fluid volume and its meshing are often impossible to obtain or the computing time is too high.
a) Initial CAD model b) Simplified CAD model c) Volume of fluid
Fig. 1: Example of CAD model representations.
Existing methods and tools for CAD model simplification allow preparing CAD model to produce an appropriate heat transfer analysis model. Thakur and al. [6] propose a classification of simplification technologies based on surface entity operators (SE class), volume entity operators (VE class), explicit features operators (EF class) or dimension reduction operators. We can add to this list, operations based on the simplification of assembly trees (AT class). Among all methods of simplification, we have selected appropriate operations according to our case and used them in an industrial context with ready-to-use software tools:
1. decimation (SE class) of edges, faces or vertices of the model ; 2. convex hull modeling (SE class) by wrapping of the model ;
Proceedings of CAD’15, London, UK, June 22-25, 2015, aaa-bbb © 2015 CAD Solutions, LLC, http://www.cadconferences.com
4. defeaturing (EF class) by removing features likes holes, pockets, protrusions, fillets or chamfers ;
5. substitution (EF class) by removing parts and modeling new basic parts (cylinders or parallelepipeds) ;
6. filtering (AT class) for removing parts from an assembly ; 7. merging (AT class) of several parts into a single component.
Depending on the use case, these seven methods can be combined in different orders to produce a simplified model. Moreover, for each operation, setting parameters must be adjusted (e.g. kinds of details to be removed by defeaturing, accuracy for decimation, and so on). Thus, a simplification process is defined by the choice of a sequence of simplification operations, and their setting parameters. For a component, a very large number of simplification processes can be driven. Currently, numerical simulation experts have to test different processes without necessarily achieving the optimal process. In practice, the choice of setting parameters is often empirical. Knowing the a priori best simplification process, will reduce design/simulation iterations.
Although much research has been devoted to a posteriori evaluation of simplification impact on analysis [2], little works have been led about a priori evaluation.
The impact of local simplification [3] and defeaturing ([5], [1]) processes on analysis results have aroused great interest. In the case of simplification process for heat transfer analysis, the level of simplification is very high. The characteristics of the CAD model are strongly impacted. In case of high level of simplification, it appears the accuracy of estimation is low with such application. So it is difficult to implement these methods. Only few attentions have been given to the impact of global simplification methods like convex hull modeling or substitution.
The challenge addressed by this work is to estimate the impact on convective FEA results due to the simplification process on a model (the volume of fluid) although it was not created.
Machine learning [4] techniques, like neural networks, support vector machine or decision tree, are able to imitate and accurately predict behaviour from a given set of examples. The use of these methods requires to precisely define input and output variables and choose carefully the set of examples for learning. The translation of raw data from CAD models to learning or testing database is a crucial point of this study. Examples for learning should be as representative as possible so that all the "level of simplification / cost of simplification" spectrum was covered. The new unknown cases must be in the field of learning cases. In the following section, an approach is proposed to build a database of representative examples in order to estimate the impact of simplification for a CAD model using machine learning techniques.
Estimation of the simplification impact on convective heat transfer analysis
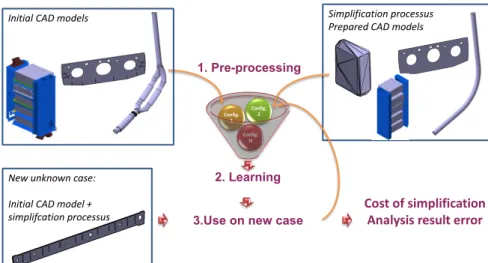
Cost of simplification and analysis result error criteria define the impact of simplification on analysis results. For a new unknown case, classifiers will estimate these output variables from the initial CAD model of the component and a proposed simplification process. Classifiers and their parameters were obtained previously by learning on examples of known cases.
The first step of the proposed approach (Fig. 2 step1) consists in building a database with examples for various component configurations. For this, we extracted key data from initial CAD model of products (e.g. surface area, volume, relationship with boundary conditions, number of faces) and from simplified CAD model previously computed (benefits between initial and prepared CAD model, Hausdorff distance). Others key data are also extracted about the analysis case (boundaries conditions, analysis results, costs) and about simplification process performed (methods used for the simplification, setting parameters, operations sequencing).
Proceedings of CAD’15, London, UK, June 22-25, 2015, aaa-bbb © 2015 CAD Solutions, LLC, http://www.cadconferences.com
2. Learning Config. N Config. 1 Config. 2
3.Use on new case
Simplification processus Prepared CAD models Initial CAD models
New unknown case: Initial CAD model + simplifcation processus
1. Pre-processing
Cost of simplification Analysis result error
Fig. 2: general workflow for estimating the impact of simplification on analysis results.
All these data are compiled in a matrix whose rows are component configurations and the columns are vectors of input and output variables. In the rows, each CAD model configuration is defined by a specific simplification process. In order to cover the whole spectrum "level / cost of simplification", the database contains the configurations corresponding to the initial model, to the most simplified model, to the reference model (lowest simplified model that can be simulated), and to other intermediate models (Fig. 3) with various level of simplification (LOS). The database contains all range of LOS.
d) Intermediate simplifications
a) Initial CAD model c) Reference CAD model b) Most simplified CAD model
Fig. 3: Examples of representative configurations of CAD model simplification for learning. In the columns, vectors of variables include two main output variables (analysis result error and simplification cost) and 20 input variables defined below.
Data must be adapted to machine learning technique like Neural Network. For that, variables are corrected in order to normalize them (from -1 to +1), to remove aberrant values and to discretize them into classes of variables which must be representative of the variable distributions.
Determinant input variables for each output variable are identified by ranking variables according to their impact on the classification accuracy. A backward removing method is used.
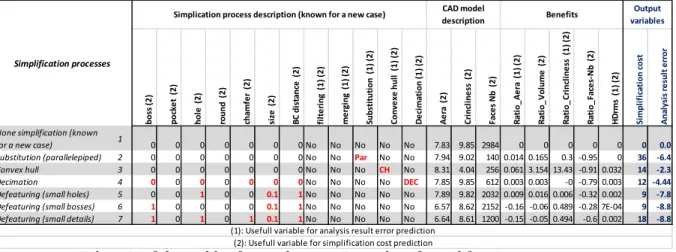
Useful variables for analysis error prediction are constituted of five variables relative to the simplification process and three variables relative to the level of simplification (benefits) (Tab. 1). Useful variables for simplification cost prediction are constituted of twelve variables relative to the simplification process, three variables relative to the CAD model and five variables relative to the level of simplification (benefits). Fig. 4 shows examples of CAD model simplification. Table 1 gives examples of useful variables for simplification cost and analysis error prediction.
Proceedings of CAD’15, London, UK, June 22-25, 2015, aaa-bbb © 2015 CAD Solutions, LLC, http://www.cadconferences.com 1) Initial CAD model
§ Faces #: 2984 § Simplification cost: 0 § Analysis result error: 0
5) Defeaturing (small details)
§ Faces #:140 § Simplification cost: 18 § Analysis result error: -8,8%
3) Convex hull
§ Faces #:256 § Simplification cost: 14 § Analysis result error: -2,3%
4) Decimation
§ Faces #:612 § Simplification cost: 12 § Analysis result error: -4,4%
2) Substitution
§ Faces #:140 § Simplification cost: 36 § Analysis result error: -6,4%
Fig. 4: Examples of CAD model simplification
bo ss (2 ) po ck et ( 2) ho le ( 2) ro un d (2 ) ch am fe r (2 ) si ze ( 2) BC d ist an ce ( 2) fil te rin g (1 ) ( 2) me rg in g (1 ) ( 2) Su bst itu tio n (1 ) ( 2) Co nv ex e hu ll (1 ) ( 2) De ci m at io n (1 ) ( 2) Ae ra ( 2) Cr in cl in ess (2 ) Fa ce s N b (2 ) Ra tio _A er a (1 ) ( 2) Ra tio _V ol um e (2 ) Ra tio _C rin cl in ess (1 ) ( 2) Ra tio _F ac es-‐ N b (2 ) HD rm s (1 ) ( 2) Si m pl ifi ca tio n co st An al ysi s r esu lt er ro r
None simplification (known
for a new case) 1 0 0 0 0 0 0 0 No No No No No 7.83 9.85 2984 0 0 0 0 0 0 0.0
Substitution (parallelepiped) 2 0 0 0 0 0 0 0 No No Par No No 7.94 9.02 140 0.014 0.165 0.3 -‐0.95 0 36 -‐6.4
Convex hull 3 0 0 0 0 0 0 0 No No No CH No 8.31 4.04 256 0.061 3.154 13.43 -‐0.91 0.032 14 -‐2.3
Decimation 4 0 0 0 0 0 0 0No No No No DEC 7.85 9.85 612 0.003 0.003 -‐0 -‐0.79 0.003 12 -‐4.44
Defeaturing (small holes) 5 0 0 1 0 0 0.1 1No No No No No 7.89 9.82 2032 0.009 0.016 0.006 -‐0.32 0.002 9 -‐7.8
Defeaturing (small bosses) 6 1 0 0 0 0 0.1 1No No No No No 6.57 8.62 2152 -‐0.16 -‐0.06 0.489 -‐0.28 7E-‐04 9 -‐8.8
Defeaturing (small details) 7 1 0 1 0 1 0.1 1No No No No No 6.64 8.61 1200 -‐0.15 -‐0.05 0.494 -‐0.6 0.002 18 -‐8.8
(1): Usefull variable for analysis result error prediction (2): Usefull variable for simplification cost prediction
Simplication process description (known for a new case) CAD model description Benefits variablesOutput
Simplification processes
Tab. 1. Useful variables for predictions. Examples of simplification processes.
Variables relative to the level of simplification are unknown variables for a new case. These intermediate output variables are themselves estimated from their own input variables.
In a second step, machine learning techniques are used for carrying out classifiers for the prediction of output variables and intermediates variables.
Classifiers and their parameters are selected by mean of three criteria, which are the average quadratic error, the percentage of classification errors and the receiver operating characteristic curve (curve giving the true-positive rate against the false-positive rate for varied thresholds).
The classifiers with best prediction accuracy are neural networks with 3 layers using Tan-Sigmoid transfer function and back-propagation method.
The final step consists in estimating impact of simplification on analysis for a new case.
In this step, only the characteristics of initial CAD model, the boundaries conditions are known. A set of simplification processes is built. This set contains several sequences of operations pre-selected by the user and all combinations of driving parameters. The impact of simplification process is estimated for each planned simplification process. Among this set, the best simplification process is the process with the lowest analysis error and the lowest simplification cost.
Proceedings of CAD’15, London, UK, June 22-25, 2015, aaa-bbb © 2015 CAD Solutions, LLC, http://www.cadconferences.com
Results
Examples for learning and test were a set of single parts and products in STEP214 files format. CAD models were simplified with CATIAV5, GPURE or NX5 SIEMENS software. Examples for learning were distributed in two sets: training set (66%) and a test set (33%) statistically equivalent.
Meshes were carried out by ANSYS Meshing software. Meshes characteristics were the same for all examples (triangular volume mesh, medium size, without adaptation). The mesh quality is the same for all examples. Analysis simulations were carried out by ANSYS Fluent software. Classifiers and theirs parameters were selected and performed using the Weka platform.
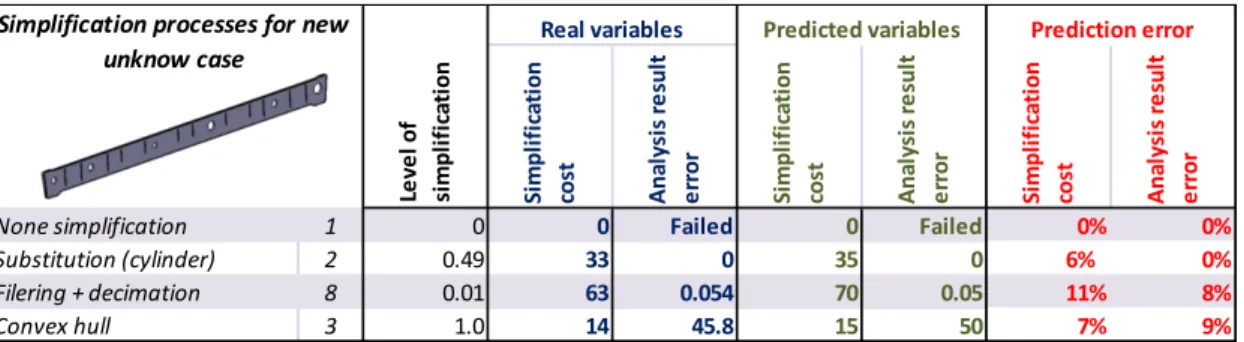
Tab. 2 shows an example of a new case for which eleven simplification processes were tested. With a maximum prediction error of 11% and no unacceptable error, the confidence rates of classifiers are satisfactory. The best simplification process for this case is the process number # 2.
Si m pl ifi ca tio n co st An al ysi s r esu lt er ro r Si m pl ifi ca tio n co st An al ysi s r esu lt er ro r Si m pl ifi ca tio n co st An al ysi s r esu lt er ro r
None simplification 1 0 0 Failed 0 Failed 0% 0%
Substitution (cylinder) 2 0.49 33 0 35 0 6% 0%
Filering + decimation 8 0.01 63 0.054 70 0.05 11% 8%
Convex hull 3 1.0 14 45.8 15 50 7% 9%
Real variables Predicted variables Simplification processes for new
unknow case Le ve l o f si m pl ifi ca tio n Prediction error
Tab. 2. Examples of predictions results Conclusion
These results show that machine learning techniques based on neural networks can be used to predict the impact of simplification processes on CAD model for heat transfer FEA purposes. A great set of processes can be tested without embedding simplifications and simulations. The proposed method provides us to perform time-consuming simulations.
The best simplification process is identified among a set of candidate processes, limited and proposed by the analysts. All simplification processes with all operations and setting parameters may be tested. Further studies should therefore implement an optimization loop in order to be able to suggest the optimal simplification process to the analysts.
The proposed approach could be easily applied to the prediction of simplification impact for more than one component and to the global decision making.
At the end, the proposed approach and tools should reduce significantly the number and duration of design/simulation iterations.
References:
[1] Danglade F., Pernot J.P., Veron P. : On the use of Machine Learning to Defeature CAD Models for Simulation, Computer-Aided Design and Applications, Volume 11, Issue 3, 2014, Pages 358-368,
http://dx.doi.org/10.1080/16864360.2013.863510
[2] Foucault G., Cuillière J.-C., François V., Léon J.C., Maranzana R., Adaptation of CAD model topology for finite element analysis, Computer-Aided Design, Volume 40, Issue 2, February 2008, Pages 176-196. http://dx.doi.org/10.1016/j.cad.2007.10.009
[3] Gopalakrishnan S.H., Suresh K., A formal theory for estimating defeaturing-induced engineering analysis errors, Computer-Aided Design, Volume 39, Issue 1, January 2007, Pages 60-68.
http://dx.doi.org/10.1016/j.cad.2006.09.006
[4] Mitchell T.: Machine Learning, McGraw Hill, 1997
[5] Tang J., Gao S., Li M., Evaluating defeaturing-induced impact on model analysis, Mathematical and Computer Modelling, Volume 57, Issues 3–4, February 2013, Pages 413-424.
[6] Thakur A., Banerjee A.G., Gupta, S.K.: A survey of CAD model simplification techniques for physics-based simulation applications , CAD Computer Aided Design, 41 (2), pp. 65-80.