Science Arts & Métiers (SAM)
is an open access repository that collects the work of Arts et Métiers Institute of
Technology researchers and makes it freely available over the web where possible.
This is an author-deposited version published in: https://sam.ensam.eu
Handle ID: .http://hdl.handle.net/10985/14645
To cite this version :
François BARGAIN, Damien THUAU, Pierre PANINE, Georges HADZIIOANNOU, Fabrice
DOMINGUES DOS SANTOS, Sylvie TENCE-GIRAULT - Thermal behavior of
poly(VDF-ter-TrFE-ter-CTFE) copolymers: Influence of CTFE termonomer on the crystal-crystal transitions - Polymer
- Vol. 161, p.64-77 - 2019
Any correspondence concerning this service should be sent to the repository
Administrator : archiveouverte@ensam.eu
Thermal behavior of poly(VDF-ter-TrFE-ter-CTFE) copolymers: Influence of
CTFE termonomer on the crystal-crystal transitions
François Bargain
a,b, Damien Thuau
c, Pierre Panine
d, Georges Hadziioannou
c,
Fabrice Domingues Dos Santos
e, Sylvie Tencé-Girault
a,b,f,∗aMatière Molle et Chimie, CNRS UMR-7167 ESPCI Paris, PSL Research University, 10 rue Vauquelin, 75005 Paris, France bArkema, CERDATO, Route du Rilsan, 27470 Serquigny, France
cLaboratoire de Chimie des Polymères Organiques, ENSCPB, Université de Bordeaux, 16 Avenue Pey-Berland, F-33607 Cedex Pessac, France dXenocs SA, 19, rue François Blumet, 38360 Sassenage, France
ePiezotech S.A.S., Arkema - CRRA, rue Henri Moissan, 69493 Pierre-Bénite Cedex, France
fPIMM, Arts et Metiers ParisTech, CNRS, Cnam, HESAM Université, 151 Bd de l’Hôpital, 75013 Paris, France
H I G H L I G H T S
•
Structural evolutions of VDF-based terpolymers with temperature and CTFE content.•
Thermal correlation of SAXS-WAXS, DSC, DMA, dielectric spectroscopy and D−E loops data.•
One or two crystal-crystal transitions are observed depending on CTFE content.•
A model for continuous transition from orthorhombic RFE to hexagonal PE is proposed.•
Enhancement of electroactive properties in the temperature range of the RFE-PE transition. A R T I C L E I N F O Keywords: SAXS-WAXS Structural transition Electro-active terpolymer A B S T R A C TDepending on their CTFE content (from 0 to 10 mol %), poly (VDF-ter-TrFE-ter-CTFE), poly(vinylidene
fluoride-ter-trifluoroethylene-ter-chlorotrifluoroethylene) copolymers exhibit ferroelectric (FE) or relaxor ferroelectric
(RFE) properties at low temperature whereas they all present paraelectric (PE) behavior at high temperature. This thermal evolution of their electro-active properties is related to reversible crystal-crystal transitions. We studied these structural transitions for three different copolymers with various amount of CTFE (0, 4.4 and 9.7 mol %) using simultaneous SAXS-WAXS experiments along thermal cycles. We identified two types of crystalline phase at low temperature with their proper crystal-crystal transition: the first one containing all-trans conformations (orthorhombic FE phase) has a discontinuous transition towards the hexagonal PE phase, the second one which incorporates gauche disordered conformations (orthorhombic DFE (Defective Ferroelectric) or RFE) transits continuously towards the same hexagonal PE phase. For the intermediate composition (4.4 mol % CTFE), we observe the coexistence of these two simultaneous phase transitions, one discontinuous (FE to PE) and one continuous (RFE to PE), whereas only the continuous one exists in the higher CTFE composition (9.7 mol %). Relaxor ferroelectric properties are precisely observed in the temperature range of the structural RFE to PE transition [0 °C, 40 °C], highlighting the importance of this crystal-crystal transition. By coupling electric dis-placement−electric field (D−E) loop measurements, thermo-mechanical experiments (DSC and DMA) and di-electric spectroscopy, we propose a model to explain this RFE-PE continuous crystal-crystal transition in ter-polymers.
1. Introduction
Poly(vinylidene fluoride) (PVDF) homopolymer and VDF-based copolymers belong to a unique family among Electroactive Polymers
(EAP). Depending on processing conditions and comonomer(s) nature and content, these materials exhibit different electroactive behaviors: paraelectric, ferroelectric, relaxor ferroelectric, piezoelectric, electro-strictive, pyroelectric, electrocaloric … Contrary to ionic polymers or ∗Corresponding author. PIMM, Arts et Metiers ParisTech, CNRS, Cnam, HESAM Université, 151 Bd de l'Hôpital, 75013 Paris, France.
E-mail address:sylvie.girault@ensam.eu(S. Tencé-Girault).
dielectric elastomers, these electroactive properties are directly related to the organization of dipoles (mainly C-F bonds) in the semi-crystalline structure of the polymer [1,2]. For instance, in PVDF, β, γ, and δ phases have non-centrosymmetric crystal symmetries which induce ferroelec-tricity, piezoelectricity and pyroelectricity whereas α phase is para-electric due to its centrosymmetry [3]. The optimal phase for electro-active applications is the β phase mostly obtained after stretching of PVDF films [4]. PVDF sample crystallized in the β phase is ferroelectric, piezoelectric and pyroelectric [5]. These properties are observed in the whole temperature range in which PVDF is crystallized, until the melting.
After copolymerization with trifluoroethylene (TrFE) comonomer, a crystalline phase similar to the β phase is obtained upon solvent eva-poration or cooling from the melt, without any stretching treatment [6]. Poly(VDF-co-TrFE) copolymers containing 20–50 mol % of TrFE are ferroelectric, piezoelectric and pyroelectric, but in a more restricted temperature range than PVDF homopolymer [7]. Indeed, these copo-lymers exhibit a Curie transition between room temperature and melting temperature. Above the Curie temperature (TC), copolymers present a paraelectric behavior. This Curie transition is a reversible structural transition from a Ferroelectric (FE) crystalline phase with
all-trans conformations along chains in crystals to a Paraelectric (PE)
crystalline phase, characterized by a disorder of trans and gauche con-formations along polymer chains [8]. The FE-PE transition is a dis-continuous 1st order transition between orthorhombic pseudo-hex-agonal (FE) and hexpseudo-hex-agonal (PE) symmetries. Moreover, not only change of electroactive properties but also an endothermic peak and a max-imum of dielectric constant (ε′) are characteristic signals of Curie transition [9,10]. The endothermic peak as well as the maximum of ε' show a thermal hysteresis between heating and cooling. This Curie transition, quite rare in polymers, has been studied extensively in poly (VDF-co-TrFE) copolymers containing various amount of TrFE [6,11]. At time being, crystalline phases and thermal transitions are quite well understood in poly(VDF-co-TrFE) copolymers [12,13]. This knowledge of relations between chemical structure, processing, crystalline orga-nization and macroscopic properties allows designing devices with desired electro-active properties: ferroelectric memories, sensors (pressure, temperature), actuators …
Poly(VDF-ter-TrFE-ter-X) terpolymers, containing around 10 mol % of X termonomer, where X can be chlorofluoroethylene (CFE) or chlorotrifluoroethylene (CTFE), have been developed for fifteen years. They exhibit high dielectric constant and high deformation under electric field (electrostriction) at room temperature [14,15]. So, they are more and more used in organic printed and flexible electronics (organic transistors), but also for actuators (haptic feedback) or elec-trocaloric devices [1,16–19]. These terpolymers belong to the family of relaxor-ferroelectric (RFE) materials. This electroactive behavior is well known in ceramics for many decades [20]. In these VDF- and TrFE-based terpolymers, when the temperature increases, ε′ exhibits a broad maximum in the 20–50 °C range. The position of the maximum in-creases with the frequency of the applied electric field and there is no thermal hysteresis upon heating and cooling [21]. This behavior is completely different from the behavior of a ferroelectric for which ε′ maximum does not evolve with the frequency [10] and shows an hys-teresis [22]. Furthermore, a very low enthalpy is measured at the temperature of ε' maximum in DSC. At room temperature, the RFE crystalline structure presents more similarities with PE phase (intra-chain disorder) than with FE phase (all-trans conformations), due to its high inter-chain distance and to the absence of intra-chain order. Re-cently, Yang et al. [21] explained the RFE behavior in CTFE-based terpolymers by the expansion of the inter-chain distance and by the physical pinning induced by CTFE units. Both effects favor an almost free rotation of the dipoles which promotes the relaxor-ferroelectric behavior characterized by low Prand Ec. Until now, only electric dis-placement−electric field (D−E) loops experiments showed a switch from RFE to PE behavior around 40–50 °C [21] but no structural
experiments have evidenced the existence of a crystalline phase tran-sition. Only a continuous evolution of the WAXS position of the Bragg RFE peak, corresponding to continuous evolution of inter-chain dis-tance, has been observed [21].
The goal of this study is to understand the structural and morpho-logical evolutions which arise simultaneously with evolution of di-electric properties and to elucidate if it can be associated to a structural transition. In this publication, simultaneous SAXS-WAXS experiments are performed on terpolymer films with high amount of CTFE (9.7 mol %). We show for the first time that a structural transition takes place around ε' maximum. This structural transition from the orthorhombic RFE symmetry to the hexagonal PE symmetry is continuous, without thermal hysteresis and associated with a very low enthalpy. By studying terpolymer films with intermediate content of CTFE (4.4 mol %), we show the coexistence at low temperature of FE and RFE crystalline phases, both phases evolving with temperature towards the PE crys-talline phase. While the transition FE-PE is discontinuous, the RFE-PE transition is continuous and no thermal hysteresis was observed.
The correlation of SAXS-WAXS, DSC, DMA, dielectric spectroscopy and D−E loop techniques allow a better understanding of the behavior of these terpolymers at the temperature of use.
2. Experimental section 2.1. Materials and films preparation
Poly(VDF-co-TrFE) 70/30 mol % copolymer (Terpo0) and
poly(VDF-ter-TrFE-ter-CTFE) 61/34.6/4.4 mol % and 60/30.3/9.7 mol %
terpo-lymers (Terpo4.4 and Terpo9.7) powders were provided by Piezotech [23]. Polymer powders were dissolved in methylethylketone at 10 wt % by using a reflux set-up at 80 °C overnight to get homogeneous polymer solution. Two different protocols were used for the films preparation depending on the characterization method targeted.
Solvent-casting method. The solution was spread homogeneously on
glass substrate and let 1h at room temperature to evaporate. A drying step at atmospheric pressure was performed in an oven overnight at 60 °C for copolymer film and at 30 °C for terpolymer films. Solvent-cast films (20 μm thickness) were named Terpo0-SC, Terpo4.4-SC and Terpo9.7-SC. These samples were used to perform simultaneous SAXS-WAXS experiments. A 1h annealing in the PE phase was done in an oven at 130 °C, 110 °C and 95 °C on Terpo0-SC, Terpo4.4-SC andTerpo9.7-SC films, respectively. The annealing temperature was fixed at 20 °C below the melting temperature of each sample. Corresponding Terpo0-R, Terpo4.4-R and Terpo9.7-R samples were used for DSC, DMA and dielectric spectroscopy experiments.
Spin-coating method. For electrical characterization (D-E loops),
metal-insulator-metal (MIM) capacitors were formed on glass substrate. Glass substrates were cleaned by ultrasonic bath of acetone and iso-propanol of 15 min each and subsequently air dried. 80 nm thin layer of aluminum (Al) was deposited by thermal evaporation (70 °C) at low pressure (1 × 10⁻⁷mbar) on the substrate through shadow mask to pattern the bottom electrode. Then, polymer solutions containing 4.4 and 9.7 mol % of CTFE were spin coated at a rotation speed of 2000 rpm for 60 s and subsequently annealed at 110 °C and 95 °C for 1 h respec-tively in order to evaporate the solvent and increase crystallinity. Finally, another 80 nm thin layer of Al was deposited on 2 μm polymer layer by thermal evaporation (70 °C) through shadow mask to form the top electrode. Resulting samples are named Terpo4.4-R′ and Terpo9.7-R'.
Information on various films and thermal treatments are gathered in
Table 1.
2.2. Differential scanning calorimetry (DSC)
DSC measurements were performed using a Q1000 series TA Instruments. Disks of polymer films were cut using a 3 mm cylindrical
shape punch and superimposed in the DSC aluminum pan to reach 7–8 mg. Heating and cooling ramps were done at 10 °C/min under he-lium flow, temperature range were adapted to each composition.
2.3. Dielectric spectroscopy
Dielectric measurements were achieved on an Alpha-Analyzer (Novocontrol) spectrometer. Annealed Terpo0-R polymer film (Terpo4.4-R or Terpo9.7-R), was placed between two circular titanium electrodes (1 cm diameter). A sinusoidal tension (1 V amplitude at 102, 103, 104, 105and 106Hz) was applied to determine the complex re-lative permittivity ε (ε′, ε’’ and tan δ = ε’‘/ε'). At the same time, tem-perature ramps at 1 °C/min were applied using a Quatro Cryosystem (Novocontrol). A first heating until 130 °C (110 °C or 95 °C) temperature was performed to ensure a good thermal contact between the electrodes and Terpo0-R (Terpo4.4-R or Terpo9.7-R) film. Data were recorded during the cooling back to −50 °C and upon the second heating up to 130 °C (110 °C or 95 °C).
2.4. Simultaneous SAXS-WAXS experiments
Simultaneous Small and Wide Angle X-rays Scattering experiments were performed on the Xenocs Nano-inXider SW system in transmission mode using Cu Kαradiation (λ = 1.54 Å) from an X-ray microsource (GeniX3D) operating at 50 kV-0.6 mA (30 W). Scattering patterns were collected using the combination of two detectors Pilatus3 (Dectris) operating simultaneously in SAXS and WAXS positions. Distances be-tween the sample and SAXS and WAXS detectors are fixed allowing a continuous q range between 0.01 Å−1and 4.2 Å−1(2θ range between 0.15° and 62°) and the collimation was chosen to maximize intensity. The scattering vector q is defined as =q 4 sin and 2θ is the Bragg angle. Terpo0-SC/Terpo4.4-SC/Terpo9.7-SC sample with a thickness of 20 μm was placed on a Linkam hot stage (HFSX350) and submitted to thermal ramps at 1 °C/min: (i) first heating from −10 °C/−30 °C/ −30 °C to 130 °C/110 °C/95 °C then left at 130 °C/110 °C/95 °C for 15 min, (ii) cooling to −10 °C/−30 °C/−30 °C and (iii) second heating to 130 °C/110 °C/95 °C. SAXS and WAXS patterns were recorded si-multaneously each minute. The temperature being continuously varied, every spectrum is the result of scattering collected over 1 °C tempera-ture range. In this study, only cooling and second heating steps were analyzed. The study of the first heating is already published for the Terpo0-SC copolymer [13]. The thermal treatment undergone by the solvent-cast samples during the first heating until high temperature (PE phase) following by an isotherm at 130 °C, 110 °C and 95 °C is quite similar to the 1h annealing performed in an oven. After the first heating and isotherm, Terpo0-SC/Terpo4.4-SC/Terpo9.7-SC samples will be named Terpo0-R/Terpo4.4-R/Terpo9.7-R.
The reduction of 2D datasets from the Pilatus3 detectors to 1D was achieved by radially averaging the raw data detector counts using Foxtrot data reduction software [24]. All SAXS and WAXS intensities were corrected for the flat field and for the Ewald sphere solid angle.
The periodic crystalline/amorphous organization of semi-crystalline polymers was determined from the Lorentz-corrected SAXS intensity profiles (q2I(q)). The position of the maximum of the q2I(q) plot, q
max,
allows the determination of the period of the lamellar organization, called long period, LP:
= = +
L 2
q L L
P
max c a (1)
Lc and Laare respectively the thickness of the crystalline and amor-phous lamellae.
The integral of the corrected intensity is called the « Invariant », Q, defined as: = Q q I(q) dq 0 2 (2)
Q is named « Invariant », because its value is related to the mean square
fluctuation of electron density, irrespective of special features of the structure [25]. For semi-crystalline polymers organized in two lamellar phases, amorphous and crystalline, corresponding to electronic den-sities, ρaand ρc, the invariant can be written as [26]:
= ×
Q (c a)2 cv(1 cv) (3)
with cv, the volume fraction of crystalline phase. The integral intensity of the diffusion, the invariant, depends on the contrast (ρc– ρa)2and on the crystallinity, but does not depend on the characteristic dimensions of the system.
The mass crystallinity is deduced from WAXS measurements. WAXS patterns were fitted using the Fityk0.9.8 software [27] in a wide 2θ range between 10° and 60°. With this software, we decompose WAXS spectrum into crystalline and amorphous contributions. The crystalline peaks are associated with sharp peaks while amorphous signal is fitted by broad peaks. A mass index of crystallinity cmof films was calculated using the following equation:
= + × A A A 100 [%] c m c c a (4)
in which Acand Aaare the areas under fitted crystalline peaks and amorphous halos, respectively. The volume fraction of crystalline phase can be calculated from the mass crystallinity, using the electronic density ρ of the polymer:
= c v c c m (5) If a Bragg peak is associated with only one (hkl) family of planes, its corrected full width at half maximum (FWHM) Δ2θhklgives the ex-tension of crystal domains, Dhkl, perpendicular to (hkl) planes, using the Scherrer formula [28]: = × × D 0.9 2 cos hkl hkl cor hkl (6)
With the corrected full width 2 hklcor= 2 hkl2 2res2 where Δ2θhklis the measured width and Δ2θres= 0.27° is the estimated in-strumental width of the set-up measured on LaB6sample. Widths are converted in radians for the calculation.
Table 1
Composition and annealing conditions for different film samples.
Composition (mol %) VDF/TrFE/CTFE Solvant Cast films Annealing conditions Annealed Films
Solvent-cast Spin-coating Terpo0 = Copolymer 70/30/0 Terpo0-SC 1h00 130 °C Terpo0-R – Terpo4.4 = Intermediate amount of CTFE 61/34.6/4.4 Terpo4.4-SC 1h00 110 °C Terpo4.4-R Terpo4.4-R′ Terpo9.7 = High amount of CTFE 60/30.3/9.7 Terpo9.7-SC 1h00 95 °C Terpo9.7-R Terpo9.7-R′
2.5. Electric displacement−electric field (D−E) loops
Measurements of the polarization hysteresis loops (D-E loop) were carried out using a TF Analyzer 2000 (aixACCT System). Electric dis-placements were measured on metal-insulator-metal (MIM) capacitors (Terpo4.4-R′ and Terpo9.7-R') as integrated current versus electric field, which was swept as a triangular voltage waveform up to 150 V/ μm at a frequency of 10 Hz between the bottom and the grounded top electrode. Note that herein we limited the D-E loop measurements of both materials to 50 °C. At higher temperature, the effects of ionic losses due to impurities and electrical conduction prevent getting reliable polarization hysteresis loops.
2.6. Dynamic mechanical analysis (DMA)
Samples for DMA experiments were cut from 20 μm thickness films by using a rectangular shape punch. DMA tests were performed using a Q800 TA Instruments Dynamic Mechanical Analyzer. Storage modulus, E′, and loss factor, tan δ = E’‘/E', of Terpo4.4-R (Terpo9.7-R) film were measured in film tension configuration following a heating ramp at 1 °C/min from −100 °C to +110 °C (95 °C). A sinusoidal tensile de-formation of 0.2% was applied at 1 Hz frequency.
3. Results
3.1. Overview of copolymer sample Terpo0
The non-annealed copolymer poly(VDF-co-TrFE), named Terpo0-SC,
was already studied by simultaneous SAXS-WAXS experiments, DSC, infrared spectroscopy and dynamic mechanical analysis [13]. This previous study showed that the first heating, after the solvent casting step, until 130 °C temperature, (below Tmand without melting), in-duced irreversible structural changes. An increase of the crystallinity is observed due to the appearance of a Defective Ferroelectric (DFE) crystalline phase, this minority DFE phase coexisting with the majority ferroelectric phase (FE) below the Curie temperature. After this first heating (without melting), copolymer Terpo0-SC exhibits a reversible Curie transition upon thermal cycling.
The Curie transition is a transition from the ferroelectric (FE) phase at low temperature to the paraelectric (PE) phase at high temperature. This transition is characterized by a maximum of the dielectric con-stant, ε', at the Curie temperature (TC-heatand TC-coolupon heating and cooling respectively) with a thermal hysteresis, ΔTC= TC-heat– TC-cool and without frequency dependence (Fig. 1a). This transition is a first
order structural transition characterized by a thermal hysteresis and an endothermic peak in DSC (Fig. 1 b). At high temperature, the PE
crystalline phase has a hexagonal symmetry and presents a dynamical disorder of gauche and trans conformations along polymer chains [8]. At low temperature, polymer chains are crystallized in the orthorhombic FE crystalline phase with all-trans conformations. For an easier de-scription of the transition, these two crystalline phases are frequently represented by two different orthorhombic cells.
PE crystal cell: a = b 3 = 0.986 nm, b = 0.569 nm and
c = 0.230 nm (chain axis) [29].
FE crystal cell: a = 0.905 nm, b = 0.512 nm and c = 0.255 nm
Fig. 1. Dielectric and structural evolutions of
Terpo0-R along a thermal cycle through the Curie transition. All the data are recorded during a cooling from 130 °C to low temperature (−10 °C) following by heating until 130 °C at 1 °C/min. (a) dielectric constant ε′, (b) DSC, (c)–(d) 2D color representation of SAXS and WAXS intensities, the ordinate axis is the temperature while the abscissa axis is q (SAXS) or 2θ (WAXS). Each line represents the azimuthal in-tegration of a 2D scattering pattern. Intensity is coded with color from black (lower intensity) to the red (highest intensity). (e) the invariant Q and (f) the evolution of the Bragg peak position of the crystal-line phases DFE (red), FE (blue) and PE (green), grey symbols are used when coexistence of FE and PE phases is observed. In (e) en (f) full and open symbols are used for heating and cooling respectively. In (f) the largest symbols are used for the majority phase and the smallest ones for the minority phase. (For interpretation of the references to color in this figure legend, the reader is referred to the Web version of this article.)
(chain axis) [29].
Each crystalline phase can be identified by its particular WAXS profile: (Fig. 1d):
- a unique Bragg peak located at d200 = d110 = dPE = 0.493 nm (2θ = 17.98°), with a width Δ2θPE= 0.44° for the PE phase, - a broad Bragg peak at d110/d200= dFE= 0.448 nm (2θ = 19.80°),
with Δ2θFE= 0.73° for the FE phase followed with two small peaks at 2θ = 35.15° (0.255 nm) and 2θ ∼ 40° (0.22 nm)
On the WAXS image (Fig. 1d) and graph (Fig. 1f), discontinuities in the evolution of Bragg peak position are observed at the Curie transition upon cooling and heating. There is a 20 °C temperature range in which both PE and FE phases coexist, underlying the first order nature of this PE ↔ FE phase transition. Furthermore, a hysteresis marked inFig. 1f is observable between cooling and heating. The evolution of the De-fective Ferroelectric phase (DFE) is plotted inFig. 1f. The DFE phase, characterized by a variable amount of gauche conformations originated from chemical defects and from thermal equilibrium, evolves con-tinuously with temperature [13]. Its inter-planar distance, dDFE, evolves continuously from 0.494 nm at high temperature (130 °C) to 0.464 nm at low temperature (−10 °C). A structural transition from a hexagonal to an orthorhombic symmetry is observed in a temperature range of around 20 °C, below the Curie temperature, this transition is depicted by a hysteresis (Fig. 1f). As this crystalline phase contains conformational gauche defects, the packing of the chains is less dense; their cell parameters are larger than those of the FE phase at room temperature.
The SAXS image (Fig. 1c) shows the evolution of the periodic or-ganization of the crystalline lamellae upon cooling and heating. Once again, a discontinuity and a hysteresis are observed at the Curie tran-sition. The integration of this scattering intensity, the invariant Q, is reported inFig. 1e. The invariant exhibits a significant drop at TC-heat, from high values below to lower values above. This evolution of the scattered intensity at small angles has already been reported [13,30] but not well understood and interpreted. We will develop this point later in the discussion and propose an interpretation based on the evolution of the electronic densities of PE, FE and DFE phases with
temperature.
Copolymers poly(VDF-co-TrFE), like Terpo0, are sought after and used for their ferroelectric properties. They are used to work, after a polarization step, at a temperature well below the Curie transition.
3.2. Poly(VDF-ter-TrFE-ter-CTFE) terpolymers
After copolymerization with a third monomer CTFE (< 10 mol %), the thermal behavior of the polymer is fully modified. As observed in
Fig. 2, upon heating, the temperature and the enthalpy associated to melting decrease, whereas the endothermic peak associated with Curie transition progressively shifts to lower temperatures and seems to dis-appear. The dielectric constant exhibits now a broad maximum, around room temperature, varying with frequency but with no more thermal hysteresis (seeFig. 3in the next section3.2.a). These materials, de-veloped for printed electronics or actuators applications are used nearly room temperature (∼25 °C) [16–18].
3.2.a. Relaxor ferroelectric terpolymer with high amount of CTFE: Terpo9.7 Thermal evolution of the behavior under electric field. The dielectric
behavior of Terpo9.7-R sample is characterized by a broad maximum of ε’ (Fig. 3) upon cooling and heating without any thermal hysteresis. At low frequency (f = 100 Hz), the temperature of this maximum is 35 °C. An increase of ε′ is observed at higher temperature, associated to some ionic conductivity due to residual impurities. The increase of solicita-tion frequency shifts the ε′ maximum from 35 °C (f = 100 Hz) to 60 °C (f = 1 MHz). It corresponds to the relaxor-ferroelectric behavior [14,15]. The evolution of tan δ signal (ε’‘/ε') gives also some informa-tion on the dielectric behavior. Here, two small peaks are observed at low frequency: one broad peak associated to the glass transition at low temperature (−20 °C) and one peak at 25 °C. The increase of frequency leads to the shift of the glass transition relaxation to higher temperature but also to an enhancement of this later peak. At high frequency, the relaxation peak related to RFE-PE transition is no longer discernible. This behavior was already described in the literature [21,31]. Capsal et al. [31] claimed that above a merging frequency, the dielectric be-havior of the relaxor terpolymer is governed by the relaxation asso-ciated to glass transition.
Fig. 2. DSC thermograms (10 °C/min) of Terpo0-R, Terpo4.4-R and Terpo9.7-R samples. Domains around [0 °C, 100 °C] are enlarged on left and right side for
Another way to study this electro-active material is to perform D-E loop measurements. The shape of the hysteresis loop allows de-termining the type of behavior: ferroelectric, relaxor ferroelectric or paraelectric. Two characteristic values can be extracted from these D-E loops: the remnant polarization, Pr, which is the polarization at zero electric field and the coercive field, Ec, which is the electric field ne-cessary to bring the polarization to zero. Bipolar D-E loops performed on Terpo9.7-R' sample, at six different temperatures (from 0 to 50 °C), are shown inFig. 4.
The evolution of Pr with the temperature is reported in supple-mentary informationFigure SI-1. At T = 0 °C, the hysteresis loop cor-responds to a relaxor ferroelectric behavior characterized by low rem-nant polarization (Pr= 12 mC/m2) and low coercive field (Ec= 13 V/
μm). When the temperature increases, the cycle shrinks to reach Pr= 2–3 mC/m2and Ec= 5 V/μm at 20 °C with the appearance of a Double Hysteresis Loop (DHL) that disappears at 50 °C. At higher temperature (T = 40–50 °C), a residual hysteresis can be observed. It corresponds to a paraelectric behavior. Following the evolution of D-E loops and the decrease of Prsuggest an evolution from a RFE material to a PE material between 0 and 50 °C.
In literature, a Single Hysteresis Loop (SHL) behavior was observed for CTFE-based terpolymers crystallized from the melt then stretched, while a Double Hysteresis Loop (DHL) was observed without stretching [21,32]. In our case, films are spin-coated and annealed, never melted nor stretched, the shape of the D-E loop looks more like a DHL behavior.
Thermal evolution of the structure and morphology. SAXS and WAXS
data acquired during temperature sweeps on Terpo9.7-R sample are reported inFig. 5. The first observation we can made on color SAXS and WAXS images is the reversibility of cooling-heating cycle without any thermal hysteresis concerning the morphology (SAXS) as well as for the crystalline structure (WAXS). To follow organization changes occurring during temperature cycles, SAXS and WAXS spectra recorded at 0, 30 and 90 °C (Fig. 5a-c) during the second heating are also shown.
As evolutions during cooling and second heating are similar, only changes on WAXS and SAXS spectra during the later will be discussed. At T = 0 °C, the WAXS spectrum presents a symmetrical crystalline peak around 2θ = 18.6° (Fig. 5a). It can be fitted by one broad peak, characteristic of the RFE phase (orange peak). The inter-reticular dis-tance of the RFE phase at T = 0 °C is dRFE= 0.476 nm. Moreover, the peak is broad and its width (Δ2θRFE= 1°) can be interpreted by the juxtaposition of two diffraction lines coming from (200) and (110) planes, considering the same orthorhombic (pseudo-hexagonal) sym-metry for the RFE phase and for the FE phase. The crystallinity index,
c
m(see Section2.4for the calculation), is around 27%. At T = 30 °C (Fig. 5-b), the position of the peak is shifted to lower 2θ (dRFE= 0.483 nm) while its width is slightly reduced (Δ2θRFE= 0.8°). At T = 90 °C (Fig. 5-c), the WAXS spectrum corresponds to the PE phase with high inter-reticular distance (dPE= 0.497 nm) and low peak width (Δ2θPE= 0.6°). The thinning down of the width of the Bragg peak is linked to the hexagonal symmetry of this PE phase. In the hexagonal symmetry (a = b 3), diffraction lines corresponding to (200) and (110) planes are exactly superimposed (d200 = d110) resulting to a lower width of the Bragg peak. While in the orthorhombic (pseudo-hex-agonal) symmetry where a ≠ b 3, the two diffraction lines are juxta-posed (d200≠ d110) and not resolved, leading to a broader Bragg peak. To explain this transition, the monitoring of the inter-reticular distance and of the width of the Bragg peak is reported below.
Concerning the SAXS evolution during heating, the correlation peak at T = 0 °C corresponds to Lpvalue of 22 nm. A tiny evolution of this parameter is observed when the temperature increases (Lp= 24 nm at
Fig. 3. Dielectric spectroscopy (1 °C/min heating at f = 100 Hz to 1 MHz)
measurements on Terpo9.7-R sample. Thermal evolutions of (a) dielectric constant ε′ and (b) tan δ (ε’‘/ε′).
T = 90 °C) whereas the intensity of the peak is doubled. Monitoring this evolution using invariant (Q) calculation may help to study the RFE-PE phase transition.
To help understanding the RFE-PE transition, we report inFig. 6
physical parameters extracted from WAXS: the inter-planar distance (Fig. 6a) and the angular width Δ2θ (Fig. 6b) associated with the Bragg peak around 2θ = 19° and from SAXS: the invariant Q (Fig. 6c).
The significant evolution of Δ2θ inFig. 6b allows us to define three different regimes. The angular width is constant around 1.1° between −30 and 0 °C, then sharply decreases to 0.65° at 50 °C, to finally reach a plateau at 0.6° at higher temperatures. This change of width between 0 and 50 °C can be explained by a change of symmetry. At low tem-perature, the RFE phase is orthorhombic and (200) and (110) diffrac-tion lines are juxtaposed but separated (pseudo-hexagonal symmetry), leading to a broad crystalline peak. At high temperature, the PE phase is hexagonal and (200) and (110) diffraction lines are strictly super-imposed, leading to a narrower crystalline peak. The decrease of an-gular width should correspond to the continuous merging of both dif-fraction lines, as observed for the continuous DFE-PE phase transition in poly(VDF-co-TrFE) copolymers [13].
With the same three domains: below 0 °C, between 0 and 50 °C and above 50 °C, we can explain the continuous increase of the inter-planar distance reportedFig. 6a. In the RFE phase, at low temperature, and in the PE phase, at high temperature, linear increases of inter-planar distance with temperature are observed. Between 0 °C and 50 °C, in the temperature range of the RFE-PE transition the evolution is slightly nonlinear. It should correspond to an expansion of the crystal lattice due to the conversion of some trans conformations in gauche con-formations, as ever observed by FTIR experiments in CTFE-based ter-polymers [21].
Moreover, the crystal extension perpendicular to the polymer chain
direction can be calculated by using the Scherrerformula (6)and taking into account the angular width of the Bragg peak characteristic of the PE phase. A value of 15 nm (Δ2θcor= 0.54°) is obtained in this terpo-lymer film, compared to 24 nm value (Δ2θcor= 0.34°) obtained in the PE phase of copolymer film (Section3.1). This decrease of correlation length perpendicular to polymer chains might be related to the in-troduction of CTFE units which can act as defects during the crystal-lization.
The same three temperature domains are also detectable in the evolution of invariant reported inFig. 6c. This evolution, correlated with the evolution of the density of the crystalline and amorphous phases, will be detailed in the discussion section4.3. Thermal evolution
of the Invariant. As thermo-mechanical behavior of semi-crystalline
polymers depends on their crystalline phase and crystallinity, an evo-lution of these properties in the RFE-PE transition temperature range is expected. Mechanical evolutions of Terpo9.7-R sample are represented inFig. 7. The decrease of the storage modulus between −50 °C and +100 °C show two main slope breaks (Fig. 7a), the first one around −20 °C is due to the glass transition Tg, and the second one between 0 and 45 °C is associated with a broad relaxation peak in tan δ signal (Fig. 7b). This maximum of tan δ appears precisely in the temperature range of the RFE-PE transition deduced from WAXS and SAXS experi-ments (Fig. 6).
In poly(VDF-co-TrFE) copolymers with TrFE content around 30 mol %, the discontinuous FE-PE Curie transition, consisting in concerted switching of trans in gauche conformations along polymer chains, is characterized by a sharp decrease of E′ modulus and a maximum of tan δ [13,33]. An analogy can be made with the behavior observed in terpolymer sample where trans conformations are progressively trans-formed in gauche conformations. So, the decrease of E' can be explained by the decrease of crystalline phase density coupled to the increase of
Fig. 5. Results of simultaneous SAXS-WAXS
ex-periments during cooling (95 °C to − 30 °C) and second heating (-30 °C to 95°C) on Terpo9.7-R sample. In the upper part: 2D color representa-tion of SAXS (left) and WAXS (right) intensities. The ordinate axis is the temperature and the abscissa axis is q (SAXS) or 2θ (WAXS). Each line represents the azimuthal integration of a 2D scattering pattern. Intensity is coded with color from black (lowest intensity) to red (highest in-tensity). The lower part of the figure shows SAXS and WAXS spectra during 2nd heating (a) 0 °C, (b) 30 °C and (c) 90 °C. On the SAXS spectra, LP values are calculated on
Lorentz-corrected spectra not shown here. On the WAXS spectra, the decomposition into amorphous (grey) and crystalline RFE (orange) and PE (green) Bragg peaks is shown. (For interpreta-tion of the references to color in this figure le-gend, the reader is referred to the Web version of this article.)
intra-chain disorder. The associated relaxation peak reflects the high crystalline mobility during the RFE-PE phase transition in [0 °C; 45 °C] temperature range. Above 45 °C, a decreasing modulus « plateau » is observed. This kind of « plateau » has been already noticed in Bargain et al. [13] and was attributed to the decreasing of the crystalline PE phase density. The melting of the PE phase occurring around 120 °C is not represented here.
To summarize, we observe a structural transition, from an orthor-hombic to a hexagonal symmetry, in the temperature range [0 °C, 45 °C]. This transition is due to the progressive substitution of trans conformations by gauche conformations. This thermal transition is re-versible and non endothermic, only a change of slope is observed on DSC curve (Fig. 2). In this wide temperature range, the dielectric con-stant is maximum (Fig. 3), the behavior is relaxor-ferroelectric (Fig. 4), the crystal structure is orthorhombic RFE. At high temperature (T > 50 °C), the behavior is paraelectric (Fig. 4) and the crystalline structure is hexagonal PE.
3.2.b. Terpolymer with intermediate amount of CTFE: Terpo4.4
For an intermediate amount of CTFE, 4.4 mol %, a small en-dothermic peak centered at 40 °C is observed on the DSC thermogram (Fig. 2). As for Terpo9.7-R, we performed on Terpo4.4-R simultaneous SAXS-WAXS experiments upon thermal cycles between 110 °C and −30 °C. SAXS and WAXS data acquired during first cooling and second
heating are represented inFig. 8. Once again, the evolution observed on 2D representation of SAXS and WAXS intensities, during cooling and second heating, is reversible without any thermal hysteresis. So, only changes on WAXS and SAXS spectra during the second heating will be discussed.
At T = 20 °C, the WAXS spectrum presents an asymmetrical crys-talline peak around 2θ = 19° (Fig. 8a) which can be decomposed in two peaks, one attributed to the RFE contribution (orange peak) with the inter-reticular distance, dRFE= 0.478 nm, whereas the second (blue peak) corresponds to a smaller distance, 0.466 nm. The crystallinity index is around 30%. At T = 50 °C (Fig. 8b), only one thin crystalline peak, characteristic of the PE phase can be fitted (dPE= 0.486 nm). The position of this peak is shifted to higher inter-reticular distance when the temperature increases (dPE= 0.496 nm at 105 °C onFig. 8c). Po-sitions and relative proportions of crystalline peaks need to be followed to clarify the structural transitions occurring in this sample.
The SAXS evolution during the second heating is also interesting. The position of the correlation peak very slightly evolves between 20 °C and 105 °C (from 28 to 29 nm) whereas the evolution of the peak in-tensity has three different regimes. The inin-tensity increases continuously from −30 °C to 30 °C then sharply decreases and finally increases again to 105 °C (2D color representation of SAXS in Fig. 8). Monitoring thermal evolution of invariant may give some hints on structural transitions in this terpolymer sample with intermediate amount of CTFE.
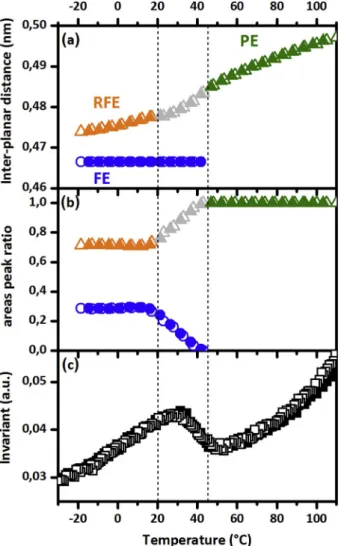
Physical parameters extracted from WAXS: inter-planar distances associated with Bragg peaks around 2θ = 19°, peaks area ratios (AFE/ (ARFE + AFE) and ARFE/(ARFE'+AFE)) and from SAXS (invariant) are reported inFig. 9.
InFig. 9a, inter-reticular distances of blue and orange (RFE) peaks
Fig. 6. Parameters from SAXS-WAXS experiments on Terpo9.7-R sample
(Fig. 5) are plotted versus temperature during first cooling (open symbols) and second heating (full symbols) ramp. From WAXS: (a) inter-planar distance and (b) Bragg peak width Δ2θ for RFE and PE phases. From SAXS: (c) invariant.
Fig. 7. DMA measurements (1 °C/min heating at f = 1 Hz). Thermal evolutions
of (a) storage modulus E′, (b) tan δ (E’‘/E′) of Terpo9.7-R. The temperature domain between dashed red lines corresponds to the RFE-PE phase transition, deduced from SAXS-WAXS experiments (Fig. 6). (For interpretation of the re-ferences to color in this figure legend, the reader is referred to the Web version of this article.)
evolve in different ways. The one corresponding to the blue peak does not evolve until it disappears at 45 °C. The other one corresponding to RFE phase evolves continuously with temperature. The integrated in-tensities (areas of Bragg peaks) of these two peaks do not evolve until 20 °C (Fig. 9b), then between 20 and 45 °C the intensity of the blue peak decreases while the intensity of the other one increases (grey symbols), above 45 °C the intensity of the PE Bragg peak is constant. This evolution of one phase to the detriment of another one (between 20 °C and 45 °C) was already observed in poly(VDF-co-TrFE) copoly-mers and was assigned to the first order Curie transition [13]. So, we associate the blue peak to a FE phase and we consider that the evolution observed is representative of a Curie transition. Indeed, between 20 and 45 °C, it is not possible to separate RFE and PE peaks, so the increase of intensity can be attributed to the PE phase. For this composition, the fact that the FE phase is a minority phase (less than 30%) and that the Curie temperature is low can explain that no thermal hysteresis be-tween FE and PE phases is noticeable [34]. Above 45 °C, only PE phase is present in Terpo4.4-R. It is interesting to observe that an endothermic peak centered at 40 °C is observed on the DSC curve drawn inFig. 2. We can easily relate this peak to the Curie transition occurring in the same temperature range.
For this composition, due to uncertainty related to the separation of RFE and FE peaks, we did not monitor the evolution of the width of the RFE Bragg peak. But at high temperature, only the PE phase remains, we measure a corrected width Δ2θcor= 0.47°. The correlation length is then 17 nm, intermediate between those in Terpo0-R (24 nm) and in Terpo9.7-R (15 nm). This progressive decrease of correlation length when the amount of CTFE increases shows once again that CTFE units are incorporated in crystalline lamellae as defects.
Furthermore, the evolution of invariant is characterized by in-creases at lower and higher temperatures and by a drop between 30 and 45 °C (Fig. 9 c). This unique behavior can be well explained if we
consider separately both transitions: FE-PE (Curie) transition and RFE-PE transition. The Curie transition is characterized in Terpo0-R by a sharp decrease of invariant (Fig. 1c and 1e) while the signature of the RFE-PE transition, observed in Terpo9.7-R, is a plateau (Fig. 6c). The shape of invariant signal of Terpo4.4-R film may be seen as a super-position of these two behaviors.
All these data allow us to conclude on the coexistence of FE and RFE phases in annealed films of poly(VDF-ter-TrFE-ter-CTFE) with 4.4 mol % CTFE. We sought to observe this coexistence of phases at room tem-perature in polarization behavior. Bipolar D-E loops, performed on Terpo4.4-R' film at six different temperatures (from 0 to 50 °C), are shown inFig. 10.
At T = 0 °C, the hysteresis loop is slightly open with remnant po-larization Pr= 18 mC/m2 and coercive field Ec= 20 V/μm. The D-E loop does not evolve between 0 and 20 °C. The Prand Ec are inter-mediate between those observed in Terpo9.7-R' (Fig. 4) and those usually measured in the ferroelectric poly(VDF-co-TrFE) copolymers (Pr∼ 60 mC/m2and Ec∼ 50 V/μm for a sample similar to Terpo0-R [35]). These intermediate Prand Ec are due to the proportion of FE phase present in terpolymer film with intermediate amount of CTFE termonomer. Above 20 °C, the hysteresis loop shrinks. The drop of Pr (Figure SI-1in supplementary information) and Ecmay be associated to the Curie transition. A relaxor ferroelectric behavior seems to be ob-served at 40 and 50 °C. We can conclude that the relaxor ferroelectric behavior of the RFE phase is hidden by the ferroelectric behavior of the FE phase in this sample below 20 °C. The temperature range of depo-larization and appearance of relaxor ferroelectric behavior [20 °C; 50 °C] corresponds well with the temperature range of Curie transition previously determined. In this temperature range, the FE phase dis-appears progressively while the RFE phase subsists. The paraelectric behavior which should appear at higher temperatures is not shown in these experiments due to the difficulties to obtain hysteresis loops at
Fig. 8. Results of simultaneous SAXS-WAXS
experi-ments during cooling (110 °C to − 30°C) and 2nd heating (−30 °C to 110 °C) of Terpo4.4-R sample. In the upper part: 2D color representation of SAXS (left) and WAXS (right) intensities. The ordinate axis is the temperature and the abscissa axis is q (SAXS) or 2θ (WAXS). Each line represents the azimuthal in-tegration of a 2D scattering pattern. Intensity is coded with color from black (lower intensity) to red (highest intensity). The lower part of the figure shows SAXS and WAXS spectra during 2nd heating (a) 20 °C, (b) 50 °C and (c) 105 °C. On the SAXS spectra, LP values are calculated on
Lorentz-cor-rected spectra not shown here. On the WAXS spectra, the decomposition into amorphous (grey), crystalline FE (blue), RFE (orange) and PE (green) peaks is shown. (For interpretation of the references to color in this figure legend, the reader is referred to the Web version of this article.)
elevated temperatures arising from the enhanced impurity ion loss and electrical conduction. Following the evolution of D-E loops confirms our previous conclusions: mix of FE and RFE behaviors at low tem-perature.
As the frequency dependence of the dielectric constant is not the same for a ferroelectric or a relaxor-ferroelectric material, it is inter-esting to perform dielectric spectroscopy on this terpolymer Terpo4.4-R. Mechanical (DMA) and dielectric evolutions of Terpo4.4-R are re-presented inFig. 11.
Starting from −50 °C, the storage modulus E′ first decreases around −25 °C due to the glass transition (Tg). Between 0 and 50 °C, E' seems to evolve in two steps: a smooth decrease from 0 to 25 °C followed by a sharper decrease at around 40 °C (Fig. 11a). This particular behavior is well correlated with tan δ signal (Fig. 11b). Indeed, three relaxation peaks can be identified: a relaxation peak characteristic of the glass transition and two overlapped peaks: a broad one between 0 and 50 °C and a narrow at 40 °C. By analogy with the behaviors observed in co-polymer Terpo0 [13] and in Terpo9.7-R (Fig. 7) samples, the broad peak (between the two dashed red lines) can be associated to the continuous RFE-PE transition (progressive conversion of trans in gauche conformations in small VDF-TrFE sequences) whereas the narrow one can be associated to the Curie (FE-PE) transition (concerted switching of trans in gauche conformations over large VDF-TrFE sequences). These relaxation peaks reflect the high crystalline mobility during these structural transitions. Above 50 °C, similarly to what was observed in Terpo0 [13] and in Terpo9.7-R (Fig. 7) the decreasing modulus plateau is attributed to the thermal evolution of the PE phase. The melting of this phase occurring around 130 °C is not represented here.
The dielectric behavior of Terpo4.4-R sample is characterized by a broad maximum of ε′ located at 50 °C (Fig. 11c). There is no thermal hysteresis between heating and cooling. A slight evolution of this maximum is observed at high frequency (f = 1 MHz). The shape of the ε′ signal seems to be the superposition of that one of copolymer Terpo0 (sharp evolution at discontinuous Curie transition and frequency-in-dependent) and that of a terpolymer with high CTFE content Terpo9.7 (broad evolution at continuous RFE-PE transition and frequency de-pendent). The evolution of tan δ signal (ε’‘/ε') shows two relaxation peaks: one broad peak associated to glass transition at low temperature and one peak associated to FE-PE transition at 50 °C (Fig. 11d). While the relaxation peak associated to the RFE-PE transition was weak in Terpo9.7, here in Terpo4.4 it is not even discernible. The increase of frequency leads to the shift of the glass transition relaxation to higher temperatures and also to enhancement of this RFE-PE transition peak. At high frequency, the relaxation peak related to FE-PE transition is still observable with no frequency dependence. Contrary to mechanical
Fig. 9. Parameters from SAXS-WAXS experiments on Terpo4.4-R (Fig. 8) are plotted versus temperature during cooling (open symbols) and 2nd heating ramp (full symbols). From WAXS: (a) inter-planar distances, (b) areas peak ratio for FE (blue), RFE (orange) and PE (green) phase, grey symbols are used when coexistence of FE and PE phases is observed. From SAXS: (c) invariant. The temperature domain between dashed lines corresponds to the Curie transition. (For interpretation of the references to color in this figure legend, the reader is referred to the Web version of this article.)
response, it is difficult to separate contributions of FE-PE and RFE-PE phase transitions in the dielectric response of terpolymer films with intermediate composition, probably because the applied frequency is not the same (1 Hz in DMA and > 100 Hz in dielectric spectroscopy). We conclude that the FE-PE Curie transition seems to have a pre-dominant signature for this intermediate composition of CTFE.
4. Discussion
4.1. Model for the continuous RFE-PE transition in terpolymers
Simultaneous SAXS-WAXS data correlated with DSC, DMA, di-electric spectroscopy and D-E loop experiments allow us to build a microscopic model for the thermal evolution of crystalline phase
Fig. 11. DMA (1 °C/min heating at f = 1 Hz) and dielectric spectroscopy (1 °C/min heating at f = 100 Hz to 1 MHz) measurements, thermal evolutions of (a) storage
modulus E′, (b) tan δ (E’‘/E′), (c) dielectric constant ε′ and (d) tan δ (ε’‘/ε′) of Terpo4.4-R.
Fig. 12. Schematic representation of the evolution of crystalline phase between -30 °C and 90 °C in Terpo9.7-R. For each temperature (T), the crystalline phase, its
associated inter-reticular distance dTand peak width (Δ2θ), obtained from WAXS experiments, are indicated on the top. Red ellipses represent CTFE units which
promote chemical gauche conformations in polymer chains. Purple circles represent thermal gauche conformations appearing in trans VDF-TrFE sequences. The inter-chain distance at each temperature,∼ (2/√3). dTis named hT. (For interpretation of the references to color in this figure legend, the reader is referred to the
between −30 °C and 90 °C in Terpo9.7 (Fig. 12).
At low temperature (T = −30 °C), the crystalline RFE phase consists in polymer chains including CTFE units (red ellipses). Between these units, VDF-TrFE sequences are mainly composed of trans conformations with some gauche conformations promoted by these bulkier termo-nomer units. As already discussed, the inter-planar distance, dRFE, measured by WAXS is higher in Terpo9.7 (dRFE∼ 0.474 nm) than in Terpo0 (d ∼ 0.450 nm). The Bragg peak is broad (Δ2θ = 1.1°), due to the juxtaposition of (200) and (110) diffraction lines of the orthor-hombic pseudo-hexagonal symmetry of the RFE phase.
The first regime between −30 °C and 0 °C corresponds to the linear thermal expansion of this RFE crystal phase with only small variations of inter-reticular distance, from d-30∼0.474 nm to d0∼ 0.476 nm, with no change of the symmetry (Δ2θ remains around 1.0°). The electro-active behavior is characterized by a hysteresis loop slightly open, with Pr= 12 mC/m2and Ec= 13 V/μm (Fig. 4).
The second regime between 0 and 50 °C is characterized by a faster increase of inter-reticular distance as well as a significant decrease of angular width (Fig. 6a and 6b). Inside RFE crystals, the inter-chain distance continuously increases due to the conversion of some trans conformations, located in VDF-TrFE sequences, in gauche conformations (purple dots). The simultaneous continuous decrease of angular width is explained by a progressive change of symmetry from orthorhombic to hexagonal. At T = 20 °C, a shrunk DHL cycle is observed with low Pr around 2 mC/m2(Fig. 4), this D-E loop is characteristic of the relaxor ferroelectric behavior. Then, at T = 50 °C, the PE phase is observed with hexagonal symmetry (reduced angular width, Δ2θ = 0.65°, due to the perfect superposition of (200) and (110) diffraction lines). The paraelectric behavior is observed (no hysteresis in D-E loop inFig. 4). The third regime between 50 and 90 °C corresponds to thermal expansion of the PE crystal phase. The increase of inter-planar distance is important (d50∼ 0.489 nm to d90∼ 0.497 nm) compared to the one in the first regime (thermal expansion of RFE phase). It might be related to lower dipoles interaction in the PE phase due to the intra-chain disorder arising from dynamical trans-gauche switching. No change of angular width is noticed in this regime (Δ2θ = 0.6° at 90 °C).
The structural transition observed from the orthorhombic RFE phase to the hexagonal PE phase is similar to the transition previously de-scribed from the orthorhombic DFE phase to the hexagonal PE phase in poly(VDF-co-TrFE) copolymer [13]. The decrease of the Bragg peak width ΔθRFEand the simultaneous increase of the dRFEdistance can be interpreted by an expansion of the cell parameter b. The a/b ratio de-creases progressively to reach 3. At this value, the symmetry of the phase is hexagonal [13].
It is interesting to note that the temperature domain [0 °C, 40 °C] in which the relaxor ferroelectric properties are expected is precisely the
domain of the structural transition from the RFE crystalline phase to the PE crystalline phase. In addition to its specific polarization cycle, no enthalpic signature (DSC), a decrease of mechanical modulus (DMA) and a maximum of dielectric constant (dielectric spectroscopy) are its main macroscopic manifestations.
4.2. How CTFE incorporates the crystalline phases and modifies thermal transitions
In this study, structural evolutions induced by the incorporation of CTFE termonomers are mainly monitored by the changes of inter-planar distances, characteristic of crystalline phases, and by invariant beha-vior. Thermal evolutions are reported inFig. 13for three different CTFE contents. This figure allows us to correlate the thermal evolution of inter-planar distances with the thermal behavior of the invariant Q for each composition.
The copolymer Terpo0-R mainly crystallizes in the FE phase which disappears abruptly at the Curie transition and becomes the PE phase. The minority crystalline phase, the DFE phase, continuously evolves towards PE phase upon heating. The evolution of the FE and DFE phases presents a hysteresis between cooling and heating.
As CTFE content increases, inter-planar distances increase in Terpo4.4-R sample proving the incorporation of CTFE units into both FE and DFE crystal lattices. These two crystalline phases coexist at room temperature with larger cell parameters than in Terpo0-R. The FE phase is now the minority phase, which still evolves discontinuously with temperature (Curie transition) but without any thermal hysteresis. The other crystal phase, now called RFE, is the main phase; it evolves continuously with the temperature towards the PE phase.
As already suggested by Yang et al. [21], we notice similarities between DFE (in Terpo0-R) and RFE (in Terpo4.4-R and Terpo9.7-R) crystalline phases. These two crystalline phases are formed from the
all-trans FE phase after incorporation of gauche conformational defects. In
the DFE phase, gauche conformations come from chemical “defects” (head-to-head defects, different distribution of TrFE groups along the chains …) [13] whereas in RFE phase, these gauche conformations are due to the incorporation of the CTFE termonomer. Moreover, the ob-servation of a minority FE phase swelled by the CTFE units proves that the CTFE can also be incorporated into an all-trans chain.
For the high content of CTFE, the swelled FE phase disappears. Terpo9.7-R crystallizes only in the RFE phase. This crystalline RFE phase evolves continuously towards the PE phase. Temperature evolu-tions of the inter-planar distances of terpolymers Terpo4.4-R and Terpo9.7-R show no hysteresis between cooling and heating.
We noted two similarities between DFE and RFE phases. In both cases, the crystallization of disordered gauche conformations is
Fig. 13. Thermal evolution of the
inter-planar distances of (a): Terpo0-R, (b): Terpo4.4-R and (c): Terpo9.7-R for FE (blue), DFE (red), RFE (orange) and PE (green) phases, the grey symbols are used when coexistence of FE and PE phases is observed, during heating (full symbols) and cooling (open symbols). In (a) and (b) the largest symbols are used for the majority phase and the smallest for the minority phase. Thermal evolution of the invariant, Q, of (d): Terpo0-R, (e): Terpo4.4-R and (f): Terpo9.7-R, measured values during heating (black line) and cooling (grey line) and Qmodelduring heating ( × ) and cooling
(+). (For interpretation of the references to color in this figure legend, the reader is re-ferred to the Web version of this article.)
observed, from chemical defects for the DFE or from CTFE termonomers for the RFE phase, and these two orthorhombic phases evolve con-tinuously towards the hexagonal PE phase upon heating. But both phases evolve differently when an electric field is applied. A poling step can transform the DFE phase into the FE phase [13] while the RFE phase remains unchanged after removing the electric field.
4.3. Thermal evolution of the invariant
The thermal evolution of the invariant (Q) seems well correlated with the evolution of the inter-planar distances (Fig. 13), especially the hysteresis for Terpo0 and the «discontinuity » at the Curie transition for Terpo0 and Terpo4.4. In this section, we show how it is possible to reproduce the thermal evolution of the invariant by using the inter-planar distances measured at each temperature. Details are developed in supplementary information (SI).
The invariant is a measure of the electronic densities repartition in the material. Each interface of electronic density in the material con-tributes to the invariant. Its contribution depends on its volume fraction and its contrast (square of the difference of the electronic densities between the two phases constituting the interface). For example, in the case of a semi-crystalline polymers organized in two lamellar phases, amorphous and crystalline, the expression of Q is given in section2.4. (Equation(3)).
In our samples, at low temperature, there are two crystalline phases (FE and RFE (or DFE)) and one amorphous phase (named hereafter A) and at high temperature, there is one crystalline phase (PE) and one amorphous phase. We have to consider four interfaces: FE/A, FE/RFE, RFE/A and PE/A. Thanks to the WAXS data, we know the thermal evolution of the densities and of the fraction of each crystalline phase. For the amorphous phase, we suppose a linear thermal evolution of the density, possibly with two regimes.
Using our WAXS data, we can reproduce the thermal evolution of the invariant Q for the three samples during heating and cooling. The calculated values are superimposed on the experimental curve in
Fig. 13. The adjustable parameters are the relative fractions of each interface and the thermal coefficients of the amorphous phase density. From this calculation, we deduce information about the nature and amount of the interfaces present at each temperature. We already knew that only the PE/A interface exists at high temperature but this model shows that at low temperature, the interface FE/A is a very minority interface, while FE/RFE and RFE/A interfaces are majority. These ob-servations support the model already developed in our previous study on poly(VDF-co-TrFE) [13], the DFE or RFE crystal phases are majority located at the interface between the FE phase and the amorphous phase, decreasing significantly the amount of FE/A interface.
Linear variations of Q, at low and high temperature, are associated with the linear evolutions of the FE, the PE and the amorphous den-sities. The FE phase has a major contribution to the invariant because of its high density. Its high density compared to DFE and RFE densities explains that invariant is higher for Terpo0 than for Terpo4.4 and Terpo9.7 at low temperature. The significant discontinuity of invariant is due to the quick disappearance of the FE dense crystalline phase at Curie temperature. This sharp drop observed in Terpo4.4 proves a
posteriori that the crystalline peak around 2θ = 19° in Terpo4.4-R
(Fig. 8b), is correctly interpreted by the juxtaposition of a FE Bragg peak and a RFE Bragg peak, since it is the existence of this FE phase which causes the drop of the invariant at TC(Figs. 9 and 13). Then the terpolymer Terpo4.4-R can be seen as a blending of ferroelectric crys-talline lamellae and relaxor-ferroelectric lamellae.
In our model, the thermal evolution of the amorphous density is linear, with two slopes and a cutoff temperature. At low temperature, the slope is nearly the same for the three copolymers. The cutoff tem-perature is close to the Curie transition (Terpo0-R) or to the RFE to PE transition (Terpo4.4-R and Terpo9.7-R). Above the transition, the thermal decreasing of the amorphous density is faster and the slope
increases with the amount of CTFE. Thus, the free volume of the amorphous phase changes in the vicinity of the FE (or RFE) to PE transition.
5. Conclusion
In poly(VDF-co-TrFE), the Curie transition from the ferroelectric state to the paraelectric state is linked to a discontinuous structural transition from an orthorhombic FE structure to a hexagonal PE struc-ture. We previously showed that after annealing above the Curie tran-sition, a minority defective ferroelectric phase (DFE) coexisted with the all-trans FE phase. This DFE phase continuously changes with tem-perature towards the PE phase.
In this study, we explore the existence of such a structural transition for relaxor-ferroelectric terpolymers in which a transition from the re-laxor-ferroelectric state to the paraelectric state was observed on D-E loops.
We studied the thermal evolution of the crystalline structure of terpolymers containing 4.4 mol % and 9.7 mol % of CTFE. In the ter-polymer with 9.7 mol % of CTFE, a single crystalline phase is observed with an orthorhombic structure. This crystalline structure evolves continuously with temperature: after a linear expansion of the crystal cell from −30 °C to 0 °C, a continuous structural transition from or-thorhombic symmetry to hexagonal symmetry is observed between 0 °C and 45 °C. The hexagonal crystalline structure PE is observed at 50 °C, and then undergoes a linear expansion up to 90 °C.
For an intermediate composition, 4.4 mol% CTFE, the RFE behavior is superimposed with the FE behavior (D-E loops). We show that this superposition of behaviors is due to the coexistence of the RFE and the FE crystalline phases in this intermediate composition. In the tem-perature range of 0 °C–50 °C, we observe both the discontinuous Curie transition from the FE orthorhombic phase to the hexagonal PE phase and the continuous structural transition from the RFE orthorhombic phase to the PE hexagonal phase.
We showed for the first time, that the high dielectric constant, ε', observed between 0 °C and 50 °C, in poly(VDF-ter-TrFE-ter-CTFE) with high amount of CTFE, is associated with a structural transition during which the trans conformations (of the orthorhombic RFE crystal struc-ture) are transformed into gauche conformations in the hexagonal PE crystal phase. This continuous transition in a wide temperature range [0 °C, 50 °C] is reversible without hysteresis.
During this study we also showed how SAXS experiments and spe-cially the measure of the invariant, Q, is useful to monitor crystal/ crystal transitions and especially to separate discontinuous and con-tinuous structural transitions. A jump of the invariant is associated with a first order (discontinuous) structural transition while a change of the slope characterizes a continuous structural transition. This sensitivity of the invariant to characterize a discontinuous transition is interesting because the decomposition of Bragg lines into multiple peaks, as in the case of Terpo4.4-R is not easy to achieve since the dissymmetry of the peaks is not obvious to identify and interpret.
Acknowledgments
The authors are grateful to French National Agency of Research and Technology (ANRT) and Arkema for supporting this work at the MMC laboratory (CIFRE convention no. 2014/0573) and also to French National Agency of Research (ANR) and Arkema for the financial sup-port of this work at LCPO (Industrial Chair HOMERIC n°AC-2013-365). Michel Cloitre at the MMC laboratory is sincerely thanked for en-lightening discussion during the PhD thesis of F. Bargain. The authors are indebted to Xenocs to provide time on a Nano-inXider SAXS-WAXS system at Sassenage before delivering a Nano-inXider to Arkema CERDATO. Authors are grateful to the LEM laboratory (Arkema, Serquigny, France) for facilitating dielectric spectroscopy measure-ments, especially David Deperrois and Stéphane Bizet for technical
helps and discussions. Ilias Iliopoulos is sincerely and warmly thanked for enlightening discussions, reading and clarifying this article.
Appendix A. Supplementary data
Supplementary data to this article can be found online athttps:// doi.org/10.1016/j.polymer.2018.11.064.
References
[1] T. Soulestin, V. Ladmiral, F. Domingues Dos Santos, B. Améduri, Vinylidene fluoride- and trifluoroethylene-containing fluorinatedelectroactive copolymers. How does chemistry impact properties? Prog. Polym. Sci. 72 (2017) 16–60https:// doi.org/10.1016/j.progpolymsci.2017.04.004.
[2] L. Zhu, Q. Wang, Novel Ferroelectric Polymers for High Energy Density and Low Loss Dielectrics, Macromolecules 45 (2012) 2937–2954,https://doi.org/10.1021/ ma2024057.
[3] A.J. Lovinger, D.C. Basset (Ed.), Poly(vinylideneFluoride) in Developments in Crystalline Polymers-1, Applied Science Publishers LTD, 1982.
[4] K. Matsushige, K. Nagata, S. Imada, T. Takemura, The II-I crystal transformation of poly(vinylidene fluoride) under tensile and compressional stresses, Polymer 21 (1980) 1391–1397https://doi.org/10.1016/0032-3861(80)90138-X. [5] R.G. Kepler, R.A. Anderson, Ferroelectric polymers, Adv. Phys. 41 (1992) 1–57
https://doi.org/10.1080/00018739200101463.
[6] A.J. Lovinger, T. Furukawa, G.T. Davis, M.J. Broadhurst, Crystallographic changes characterizing the Curie transition in three ferroelectric copolymers of vinylidene fluoride and trifluoroethylene: 1. As-crystallized samples, Polymer 24 (1983) 1225–1232https://doi.org/10.1016/0032-3861(83)90050-2.
[7] K. Tashiro, K. Takano, M. Kobayshi, Y. Chatani, H. Tadokoro, Structural study on ferroelectric phase transition of vinylidene fluoride-trifluoroethylene copolymers (III) dependence of transitional behavior on VDF molar content, Ferroelectrics 57 (1984) 297–326https://doi.org/10.1080/00150198408012770.
[8] K. Tashiro, K. Takano, M. Kobayashi, Y. Chatani, Structural study on ferroelectric phase transition of vinylidene fluoride-trifluoroethylene random copolymers, Polymer 22 (1981) 1312–1314https://doi.org/10.1016/0032-3861(81)90226-3. [9] G. Teyssedre, A. Bernes, C. Lacabanne, DSC and TSC study of a VDF/TrFE
copo-lymer, Thermochim. Acta 226 (1993) 65–75 https://doi.org/10.1016/0040-6031(93)80207-Q.
[10] T. Furukawa, M. Date, E. Fukada, Y. Tajitsu, A. Chiba, Ferroelectric Behavior in the Copolymer of Vinylidenefluoride and Trifluoroethylene, Jpn. J. Appl. Phys. 19 (1980) 109–112.
[11] J.F. Legrand, Structure and ferroelectric properties of P(VDF-TrFE) copolymers, Ferroelectrics 91 (1989) 303–317https://doi.org/10.1080/00150198908015747. [12] R. Tanaka, K. Tashiro, M. Kobayashi, Annealing effect on the ferroelectric phase
transition behavior and domain structure of vinylidene fluoride
(VDF)–trifluoroethylene copolymers: a comparison between uniaxially oriented VDF 73 and 65% copolymers, Polymer 40 (1999) 3855–3865https://doi.org/10. 1016/S0032-3861(98)00609-0.
[13] F. Bargain, P. Panine, F. Domingues Dos Santos, S. Tencé-Girault, From solvent-cast to annealed and poled P(VDF-TrFE) films: new insights on the defective ferro-electric phase, Polymer 105 (2016) 144–156https://doi.org/10.1016/j.polymer. 2016.10.010.
[14] S. Zhang, R.J. Klein, K. Ren, B. Chu, X.I. Zhang, J. Runt, Q.M. Zhang, Normal fer-roelectric to ferfer-roelectric relaxor conversion in fluorinated polymers and the relaxor dynamic, J. Mater. Sci. 41 (2006) 271–280 https://doi.org/10.1007/978-0-387-38039-1_24.
[15] F. Bauer, Review on the properties of the ferrorelaxor polymers and some new recent developments, Appl. Phys. A 107 (2012) 567–573,https://doi.org/10.1007/ s00339-012-6831-8.
[16] J. Li, S. Sun, F. Yan, Solution Processable Low-Voltage Organic Thin Film Transistors with High-k Relaxor Ferroelectric Polymer as Gate Insulator, Adv. Mater. 24 (2012) 88–93,https://doi.org/10.1002/adma.201103542.
[17] S.T. Choi, J.O. Kwon, F. Bauer, Multilayered relaxor ferroelectric polymer actuators for low-voltage operation fabricated with an adhesion-mediated film transfer technique, Sens. Actuators, A A. 203 (2013) 282–290https://doi.org/10.1016/j. sna.2013.08.049.
[18] S.G. Lu, X. Chen, T. Levard, P.J. Dilio, L.J. Gorny, C.D. Rahn, Q.M. Zhang, Large Displacement in Relaxor Ferroelectric Terpolymer Blend Derived Actuators Using Al Electrode for Braille Displays, Sci. Rep. 5 (2015) 11361,https://doi.org/10.1038/ srep11361.
[19] R. Ma, Z. Zhang, K. Tong, D. Huber, R. Kornbluh, Y.S. Ju, Q. Pei, Highly efficient electrocaloric cooling with electrostatic actuation, Science 357 (2017) 1130–1134, https://doi.org/10.1126/science.aan5980.
[20] R.A. Cowley, S.N. Gvasaliya, S.G. Lushnikov, B. Roessli, G.M. Rotaru, Relaxing with relaxors : a review of relaxor ferroelectrics, Adv. Phys. 60 (2011) 229–327,https:// doi.org/10.1080/00018732.2011.555385.
[21] L. Yang, B.A. Tyburski, F. Domingues Dos Santos, M.K. Endoh, T. Koga, D. Huang, Y. Wang, L. Zhu, Relaxor Ferroelectric Behavior from Strong Physical Pinning in a Poly(vinylidene fluoride-co-trifluoroethylene-co-chlorotrifluoroethylene) Random Terpolymer, Macromolecules 47 (2014) 8119–8125,https://doi.org/10.1021/ ma501852x.
[22] T. Furukawa, Structure and functional properties of ferroelectric polymers, Adv. Colloid Interface Sci. 71–72 (1997) 183–208 https://doi.org/10.1016/S0001-8686(97)90017-8.
[23] https://www.piezotech.eu/en/.
[24] As of October 26, the software can be obtained by sending a mail, (2018) Software is free for non-profit usage, directly usable with Nexus and ESRF 2D data format foxtrot@xenocs.com.
[25] O. Glatter, O. Kratky, Small Angle X-ray Scattering, Academic Press, 1982. [26] F.J. Balta-Calleja, C.G. Vonk, X-ray Scattering of synthetic Polymers, Polymer
Science Library 8 (1989) Elsevier.
[27] M.J. Wojdyr, Fityk : a general-purpose peak fitting program, Appl. Cryst. 43 (2010) 1126–1128,https://doi.org/10.1107/S0021889810030499.
[28] H.P. Klug, L.E. Alexander, X-ray Diffraction Procedures for Polycrystalline and Amorphous Materials, second ed., Wiley-Interscience, New York, 1974. [29] E. Bellet-Almaric, J.F. Legrand, Crystalline structures and phase transition of the
ferroelectric P(VDF-TrFE) copolymers, a neutron diffraction study, Eur. Phys. J. B. 3 (1998) 225–236https://doi.org/10.1007/s100510050307.
[30] C. Bourgaux-Leonard, J.F. Legrand, A. Renault, P. Delzenne, Annealing effects in ferroelectric poly(vinylidene fluoride-trifluoroethylene) copolymers: real-time stu-dies using synchrotron radiation, Polymer 32 (1991) 597–604https://doi.org/10. 1016/0032-3861(91)90470-4.
[31] J. Capsal, E. Dantras, C. Lacabanne, Molecular mobility interpretation of the di-electric relaxor behavior in fluorinated copolymers and terpolymers, J. Non-Cryst. Solids 363 (2013) 20–25https://doi.org/10.1016/j.jnoncrysol.2012.12.008. [32] M.R. Gadinski, Q. Li, G. Zhang, X. Zhang, Q. Wang, Understanding of Relaxor
Ferroelectric Behavior of Poly(vinylidene fluoride−trifluoroethylene−chlorotri-fluoroethylene) Terpolymers, Macromolecules 48 (2015) 2731–2739,https://doi. org/10.1021/acs.macromol.5b00185.
[33] F. Oliveira, Y. Leterrier, J.A. Manson, O. Sereda, A. Neels, A. Dommann, D. Damjanovic, Process Influences on the Structure, Piezoelectric, and Gas-Barrier Properties of PVDF-TrFE Copolymer, J. Polym. Sci. B Polym. Phy. 52 (2014) 496–506,https://doi.org/10.1002/polb.23443.
[34] K. Tashiro, M. Kobayashi, Structural phase transition in ferroelectric fluorine polymers: Xray diffraction and infrared/Raman spectroscopic study, Phase Transitions 18 (1989) 213–246https://doi.org/10.1080/01411598908206864. [35] F. Bargain, T. Soulestin, F. Domingues Dos Santos, V. Ladmiral, B. Améduri,
S. Tencé-Girault, Semicrystalline organization of VDF- and TrFE-basedelectroactive terpolymers: Impact of the trans-1,3,3,3-tetrafluoropropenetermonomer, Macromolecules 50 (2017) 3313–3322,https://doi.org/10.1021/acs.macromol. 7b00051.
![Fig. 2. DSC thermograms (10 °C/min) of Terpo0-R, Terpo4.4-R and Terpo9.7-R samples. Domains around [0 °C, 100 °C] are enlarged on left and right side for Terpo9.7-R and Terpo4.4-R samples respectively.](https://thumb-eu.123doks.com/thumbv2/123doknet/7381949.215621/6.892.127.765.733.1020/thermograms-terpo-terpo-samples-domains-enlarged-samples-respectively.webp)