Assessment of PEG on Polymeric Particles Surface, a Key Step in Drug Carrier Translation
Jean-Michel Rabanel 1, 2, Patrice Hildgen 1, Xavier Banquy 2, ‡
1 Laboratoire de Nanotechnologie Pharmaceutique, Faculté de Pharmacie, Université de Montréal, C.P. 6128,
Succursale Centre-ville, Montréal, Québec, H3C 3J7, Canada
2 Canada Research Chair in Bio-inspired materials, Faculté de Pharmacie, Université de Montréal, C.P. 6128,
Succursale Centre-ville, Montréal, Québec, H3C 3J7, Canada
‡ Corresponding author: xavier.banquy@umontreal.ca Tel. 1-514-343-2470 ABSTRACT [271 words]
Injectable drug nanocarriers have greatly benefited in their clinical development from the addition of a superficial hydrophilic corona to improve their cargo pharmacokinetics. The most studied and used polymer for this purpose is poly(ethylene glycol), PEG. However, in spite of its wide use for over two decades now, there is no general consensus on the optimum PEG chain coverage-density and size required to escape from the mononuclear phagocyte system and to extend the circulation time. Moreover, cellular uptake and active targeting may have conflicting requirements in terms of surface properties of the nanocarriers which complicates even more the optimization process. These persistent issues can be largely attributed to the lack of straightforward characterization techniques to assess the coverage-density, the conformation or the thickness of a PEG layer grafted or adsorbed on a particulate drug carrier and is certainly one of the main reasons why so few clinical applications involving PEG coated particle-based drug delivery systems are under clinical trial so far.
The objective of this review is to provide the reader with a brief description of the most relevant techniques used to assess qualitatively or quantitatively PEG chain coverage-density, conformation and layer thickness on polymeric nanoparticles. Emphasis has been made on polymeric particle (solid core) either made of copolymers containing PEG chains or modified after particle formation. Advantages and limitations of each technique are presented as well as methods to calculate PEG coverage-density and to investigate PEG chains conformation on the NP surface.
Key words: Poly(ethylene glycol), coverage-density, nanoparticle, surface analysis, DLS, Zeta
potential, fluorescence quantification, NMR, XPS
Table of content
Introduction p 0
1. PEGylation of polymeric particles p 0
1.1. Particle fabrication methods and consequences on PEG distribution p 0 1.2. Relationship between PEG coverage-density and the NP biophysical properties p 0
1.3. Current challenges in PEG dosage p 0
1.4. PEG surface coverage parameters p 0
2. Indirect assessment of surface PEGylation efficiency p 0
2.1. Particle size p 0
2.2. Surface hydrophilicity p 0
2.3. Zeta potential p 0
2.4. Protein binding p 0
3. Direct assessment of surface PEGylation efficiency based on solution dosage p 0
3.1. PEG and PEG copolymer dosage by colorimetric methods p 0
3.2. Chromatographic quantification methods p 0
3.3. PEG quantification by UV and Fluorescence spectroscopy p 0
4.1. Total PEG dosage p 0
4.2. Surface-bound PEG dosage p 0
5. Direct assessment of surface PEGylation by XPS studies p 0
5.1. Principles of XPS p 0
5.2. Survey scan and elemental analysis p 0
5.3. High resolution spectra and chemical bonds quantification p 0
5.4. Measurement of a PEG layer thickness by XPS p 0
6. Assessment of polydispersed PEG layer p 0
7. Perspectives and conclusions p 0
References p 0
Supporting information
Introduction
Poly(ethylene glycol) (PEGs) is extensively used as a surface modifier of particulate drug carriers to provide important biological properties such as reducing toxicity and extending circulation time [1, 2]. Amongst all drug carriers, polymeric “PEGylated” microparticles (MP) and nanoparticles (NP) are investigated for their potential use as drug delivery and targeting systems taking advantage of their stability in biological media, their prolonged period of circulation in the blood and their role in decreasing drug toxicity and clearance [3-7]. However, only a few nanocarrier platforms based on PEGylated particles have reached the market with, in several cases, limited improvements over already available formulations [8].
Controlling NP surface properties is a challenging task due to the many, often conflicting, constrains that are involved in the design of a particle surface. Such constraints involve the
simultaneous specific recognition of targeted pathological sites and avoidance of non-specific
recognition by serum proteins, cells, tissues and organs. While the former is conferred by elements such as antibodies, peptides, ligands, etc., the latter is usually conferred by a polymeric hydrophilic corona covering the entire particle surface.
Poly(ethylene glycol) has been for more than two decades the polymer of choice for such corona, even if alternatives are now emerging [9, 10]. PEG and PEG monomethyl ether are ones of the few polymers approved for internal use in humans by the FDA, which is an important consideration when developing new pharmaceutical formulations [11, 12]. Nonetheless, biocompatibility of new excipient created by PEG covalent coupling to various polymers needs to be documented before advancing to the clinical trials stage [7]. Its unique combination of properties such as biocompatibility, low immunogenicity, water and organic solvent solubility, have made PEG the gold standard since the beginning of the 90’s. Indeed, Doxil®, a PEGylated liposomal formulation of doxorubicin was introduced on the US market as early as 1995 [13]. Since then, formulation development based on PEGylated polymeric particles has been confined to the clinical trial level, although some have recently shown promising outcomes [7, 14].
So far, optimal PEG surface coverage-density has been empirically determined for each system by varying the experimental conditions of carrier preparation, often with only a qualitative proof of PEG presence on the surface. Considering how critical PEG is for NP performance, routine but precise assessment of PEG surface coverage-density is a pre-requisite in drug carrier development, production and quality control.
The objective of this review is to provide the reader with available tools to assess qualitatively or quantitatively PEG surface coverage-density either directly or indirectly on polymeric MP or NP surfaces. Advantages and limitations of each technique will be presented as well as methods to calculate PEG density and to estimate PEG chains conformation.
1.1. Particle fabrication methods and consequences on PEG distribution
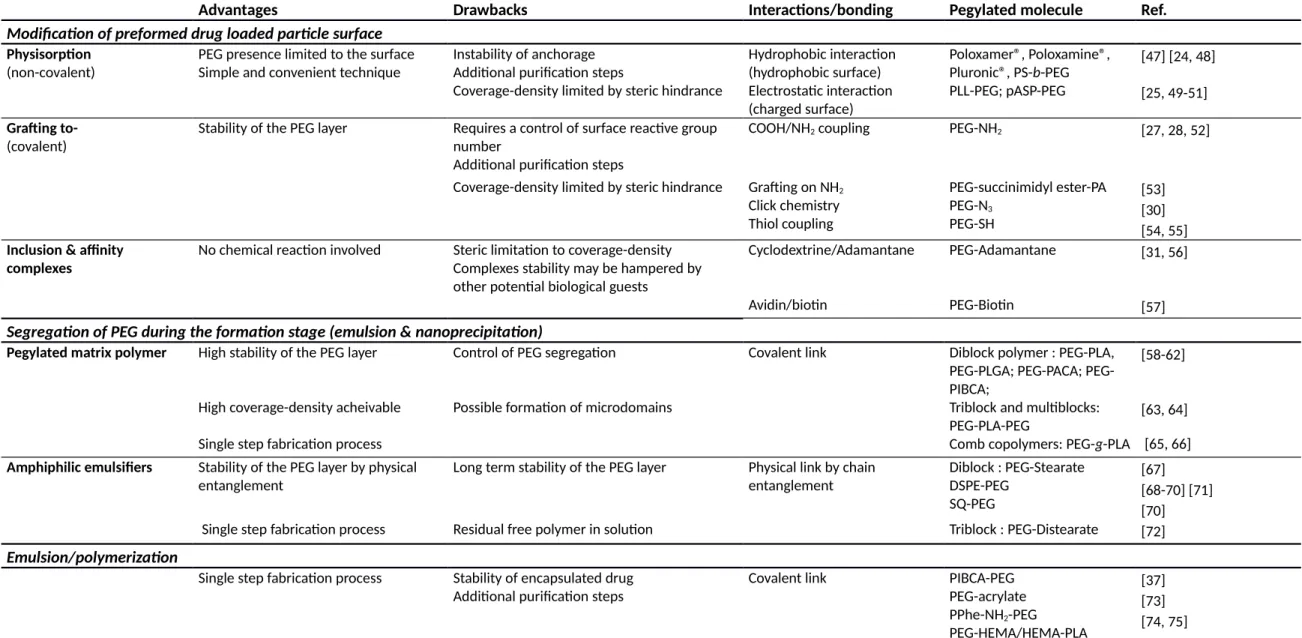
Polymeric NPs have diverse morphologies, preparation methods, type of polymer matrix as well as intended uses [15-18]. Creation of a PEG coating on a NP surface can be achieved in different ways (Table 1) such as the segregation of (i) a hydrophilic segment of the core matrix polymer at the surface (ex: poly(lactic-co-glycolic)/PEG or poly(lactic)/PEG diblock polymers), or (ii) of additives with an amphiphilic structure (ex. PEG-oleate, PEG-stearate). Alternatively, it can also result from the addition of hydrophilic polymers on preformed particle by either (iii) physiosorption, electrostatic interactions (iv) covalent attachment (grafting-to approaches) of functional PEG to available surface reactive groups or (v) emulsion/copolymerization [3, 19].
When polymeric NPs are formed by emulsification techniques such as microfluidic techniques [20, 21] or nanoprecipitation, PEG can be introduced on the NP surface either as an amphiphilic molecule additive or as part of the polymer matrix (Fig. 1-B). It is ideally expected that PEG segments will segregate completely to the interface with water, while the hydrophobic part of the polymer will remain in the particle core. However, PEG segments can also remain in the particle core as well (Fig. 1-A), thus decreasing PEG concentration at the surface [22]. Several reasons can account for such phenomenon, such as entanglements, small polymeric chains lost in the external aqueous phase, physical processes involved in the NP preparation (such as diffusion of water and solvent, viscositycontrasts, polymer-polymer interactions, etc.), solidification processes, or the presence of aqueous cavities in the particle (Fig. 1 A).
Approaches based on the surface modification of preformed particles have the advantage of ensuring the presence of PEG exclusively at the surface. On the other hand, they may result in batch-to-batch variations of coupling yield and incomplete coverage due to steric constraints and reaction rates. PEG copolymer adsorption can be achieved by hydrophobic interactions [23, 24] or by electrostatic interactions with charged particle surfaces [25]. Such interactions can be too weak to guaranty strong anchoring of PEG chains on the NP surface in vivo [26]. Covalent grafting of end-functionalized PEG chains on preformed particles is less reported (the “grafting-to” approach). Just to name a few, such approach can involve a carbodiimide coupling reaction between an activated COOH group and NH2 to form amide bond [27, 28]; modified PEG reaction with thiols yielding to thioester bonds [29]; or more recently an alkyne/azide coupling reaction [30]. In all cases, the grafting density of PEG on preformed particles is expected to be rather low or at least insufficient to reach the brush conformation regime mainly due to steric limitations of the adsorption of the hydrophobic anchors or to the steric hindrance affecting the coupling reaction of neighboring bulky PEG chains. Moreover, tedious separation and purification steps have to be implemented to eliminate the excess of non-adsorbed or unreacted PEG chains. This particular step can be very problematic if the anchoring strength is weak as with physio-adsorbed polymers.
1.2 Relationship between PEG coverage-density and the NP biophysical properties
The PEG layer may have different roles in a particle biological fate, and all of them depend on the chain coverage-density. PEG coatings are known to prevent aggregation and to stabilize particles and colloidal suspensions in physiological salt concentration media by steric and hydration repulsions [31-33].
Figure 1. Pegalyted polymeric micro or nanoparticle: (A) PEG distributions in a polymeric
particle depending on the fabrication process; (B) Schematic representation of the different types of PEG anchoring on a surface; (C) PEG conformations on a particle surface.
The resistance to non-specific absorption (opsonisation) of plasmatic proteins is the most important determinant of NP fate once injected in the host [34]. High resistance to protein adsorption leads to a decreased uptake by the Mononuclear Phagocytose System (MPS), decreased degradation and elimination rate leading to a longer half-life in the blood stream, which in turn influences drug pharmacokinetic (PK) parameters. The resistance to proteins binding (the so-called “antifouling effect”) is dependent on PEG chains coverage conformation and is usually achieved at high coverage-density (Fig. 1-C), in the polymeric brushes regime [2, 35]. The optimal coverage-density is still a matter of debate as some studies showed protein repellency even at low coverage-density [36, 37]. Resistance to protein adsorption may also improve targeting capabilities by preventing blockade by steric hindrance of ligand recognition [38, 39]. The PEG layer on NP surface can also improve drug encapsulation by providing a physico-chemical barrier to drug escape and it could affect drug release pattern [40].
In addition to the abovementioned biological properties, it has been recently demonstrated that PEG surface coverage controls NP transport through biological matrices such as the gastrointestinal tract (GIT) mucus [41], the cervicovaginal mucus [42], the pulmonary mucus [43] and the tumor extracellular matrix [44]. Improving the ability of a NP to diffuse in a complex media can potentially greatly improve drug delivery efficacy, as electrostatic and steric hindrances prevent NP to cross mucosal barriers or to penetrate tissues beyond the perivascular region [45, 46]. Very dense coatings seem to be necessary (about 0.5-1 PEG/nm2 for 200 nm diameter particle) to achieve particle transport coefficients in mucus comparable to those in liquid medium [43].
Table 1. Main PEGylation strategies for polymeric particles
Advantages Drawbacks Interactions/bonding Pegylated molecule Ref.
Modification of preformed drug loaded particle surface Physisorption
(non-covalent)
PEG presence limited to the surface Simple and convenient technique
Instability of anchorage Additional purification steps
Hydrophobic interaction (hydrophobic surface)
Poloxamer®, Poloxamine®, Pluronic®, PS-b-PEG
[47] [24, 48] Coverage-density limited by steric hindrance Electrostatic interaction
(charged surface)
PLL-PEG; pASP-PEG [25, 49-51]
Grafting to-
(covalent)
Stability of the PEG layer Requires a control of surface reactive group number
COOH/NH2 coupling PEG-NH2 [27, 28, 52]
Additional purification steps
Coverage-density limited by steric hindrance Grafting on NH2
Click chemistry Thiol coupling PEG-succinimidyl ester-PA PEG-N3 PEG-SH [53] [30] [54, 55]
Inclusion & affinity complexes
No chemical reaction involved Steric limitation to coverage-density Complexes stability may be hampered by other potential biological guests
Cyclodextrine/Adamantane PEG-Adamantane [31, 56]
Avidin/biotin PEG-Biotin [57]
Segregation of PEG during the formation stage (emulsion & nanoprecipitation)
Pegylated matrix polymer High stability of the PEG layer Control of PEG segregation Covalent link Diblock polymer : PEG-PLA, PLGA; PACA; PEG-PIBCA;
[58-62]
High coverage-density acheivable Possible formation of microdomains Triblock and multiblocks:
PEG-PLA-PEG
[63, 64]
Single step fabrication process Comb copolymers: PEG-g-PLA [65, 66]
Amphiphilic emulsifiers Stability of the PEG layer by physical entanglement
Long term stability of the PEG layer Physical link by chain entanglement Diblock : PEG-Stearate DSPE-PEG SQ-PEG [67] [68-70] [71] [70]
Single step fabrication process Residual free polymer in solution Triblock : PEG-Distearate [72]
Emulsion/polymerization
Single step fabrication process Stability of encapsulated drug Additional purification steps
Covalent link PIBCA-PEG
PEG-acrylate PPhe-NH2-PEG PEG-HEMA/HEMA-PLA [37] [73] [74, 75]
Note : PLA; poly(lactic); PLGA: poly(lactic-co-glycolic); PLL: poly(L-Lysine); PS: poly(styrene); pASP-EPG: poly(asparctic acid)-PEG, SQ-PEG: Squalene-PEG; PACA: poly(alkylcyanoacrylate); PIBCA: poly(isobutylcyanoacrylate); PPhe-PEG: Poly(phenylalanine)-PEG; DSPE: 1,2-Distearoyl-sn-glycero-3-phosphoethanolamine; PEG-HEMA: 2-hydroxylethyl methacrylate-PEG
Target recognition and docking of ligand molecules located at the surface of a PEGylated particle are dependent on the density and thickness of the PEG layer and the positioning of the ligand [76-78]. It appears that long circulation time, low non-specific cellular uptake and active targeting have conflicting requirements in terms of NP surface properties which complicates the formulation process. Non-optimal properties of a NP layer can induce activation of the complement cascade and contribute to the “accelerated blood clearance” (ABC) associated to the production of antibodies directed to PEG, after repeated administered doses [79]. Noteworthy, the level of immunogenicity of PEG, as well as the biological effects of the immune response, are still a matter of debate [80].
Increase in PEG coating density or layer thickness seems to affect NP cellular uptake as well [81]. Low cellular uptake can be advantageous since it increases circulation time due to MPS avoidance. On the other hand, it may also decrease drug efficacy if the intended targeted cells are not internalizing efficiently the drug carriers. This step is critical for the efficacy of several types of drugs with intracellular target such as siRNA or drugs subjected to efflux pumps. This situation is referred as the “PEG dilemma” as addition of PEG is having simultaneously a positive impact on the biodistribution of the NP as well as a negative impact on the cellular uptake and endosomal escape of the NP [18, 82]. For example, conflicting results observed with nuclei acid carriers [83] could be explained by the lack of quantitative structural studies of these supra-molecular assemblies. More sophisticated approaches have been recently designed to overcome this “PEG dilemma” using sheddable PEG layer [84]. In this approach, surface grafted PEG chains are removed at the targeted site by enzymatic, hydrolytic or redox cleavage of chemical linkers [85-87]. Reported methods to assess PEGylation and de-PEGylation of the particles remain however largely qualitative at this point [51, 57].
In spite of the extensive use of PEG for three decades now, there is no general consensus on what is the optimum coverage-density, conformation and molecular weight (Mw) combination for
a given carrier and application. [2, 19]
1.3 Current challenges in PEG dosage
Correlating particle biological performance and PEG coverage-density is an arduous task due to the lack of standard quantification tests. Qualitative and batch-to-batch relative quantification are the most commonly used approaches of reporting PEG surface content.
Part of this issue originates from the lack of convenient and reliable analytic techniques to dose surface-bound PEG chains, particularly on polymeric particles. One of the challenges with PEG quantification resides in the fact that it is not detectable directly by spectroscopic techniques. Indeed, detection by UV (or fluorescence) spectroscopy requires the coupling of PEG chains to a chromophore, resulting in laborious and complex procedures.
Another issue is to distinguish between the PEG located at the surface from the total PEG present in the carrier, either trapped in the polymeric matrix, or loosely bound to the surface. Complete segregation of PEG chains at the surface of the NP is often assumed without providing direct evidence, which in some cases could be justified by the preparation method used, as in the case of addition of PEG on preformed particles [37, 88]. But in other cases it is not clearly justified and results in an overestimation of PEG coverage-density. Direct assessment of PEG on intact particles is sough and possible to some extend by NMR (as discussed later in section 4). According to the preparation methods used to add the PEG corona on the NP, quantification methods may have to be adapted in order to differentiate surface PEG from total PEG. If PEG is added by grafting or adsorption on preformed particles, one has to make sure that loosely- bound or free PEG is not inferring with the dosage.
Lastly, procedures involving a purification step to separate bound from free PEG may introduce several methodological bias. On the other hand, with nanoprecipitation or
emulsion-based preparation methods, it is clear that in most cases the total PEG content cannot simply be assumed to represent only surface PEG (Fig. 1).
1.4 PEG surface coverage parameters
The different PEG chains conformation at interfaces are presented in section S1.1. Calculation methods and error analysis regarding PEG coverage-density are presented in Supporting Information, sections S1.2 and S1.3 (available free of charge at http://www.sciencedirect.com). In what follows we provide some definitions of the commonly used parameters describing PEG coverage on a particle surface.
Weight coverage-density, is a PEG mass per surface unit, noted Γ ( Γ= ρt , where ρ is PEG
layer volumetric density and t, layer thickness in wet or dry state according the analytical method used). Surface chain coverage-density, is more generally expressed as PEG chain/nm2 [35, 36, 58, 88, 89]. This expression of PEG density will be used in this review. Surface coverage represents the PEG coating efficiency, i.e. the percentage of total PEG found on the surface of a NP. It is expressed as a percentage of NP surface covered by PEG. PEG coating efficiency is referred to the percentage of PEG present at the surface in regard of total PEG in the particle [22, 90]. PEG coating density is similar to the PEG coating efficiency but is expressed in terms of weight quantities, for instance, in mg of PEG at the surface for 100 mg of particle [22].
PEG footprint, FP, is the projected area of a single chain of PEG end-grafted on a NP surface.
It is also defined and expressed by the relation (in nm2/chain of PEG) which is the reciprocal of the coverage-density (in the brush regime only):
FP= APEG=1
σ= S
NPEG (nm2) (1-1)
The actual “occupied” area (i.e. the chain footprint) should be distinguished from area “available” to the chain (APEG). When D > 2RF the area occupied by a PEG chain is less than the available area (see Fig. 2A). When D < 2RF, the area occupied by a PEG chain is equal to the available space (Fig. 2B-C). Distance between chains (or grafting distance, D, in nm) can be calculated when the PEG chain footprint is a circular area in a close packed hexagonal arrangement. The expression for D under these assumptions is:
D=2
√
APEGπ (nm) (1-2)
It is important to stress that the number of PEG chains per particle is of limited usefulness as particle mean diameter may vary from batch to batch. It is more reliable for comparison purposes to use the surface coverage-density expressed as PEG/nm2.
2. Indirect assessment of surface PEGylation efficiency
To assess the presence of PEG on a particle surface, many comparative measurements based on the changes in the physical or chemical properties of the particles induced by the addition of PEG have been used. The most popular techniques by far are the monitoring of the particle hydrodynamic diameter (DH) or the zeta potential (ζ) upon PEGylation. Other indirect
measurements worth mentioning are surface the measurements of hydrophilicity or protein binding on PEGylated NPs.
2.1. Particle size
Several techniques are available to measure particle diameters. Amongst them, the most used on a routine basis in the nanometer range (2 to 1000 nm) is Dynamic Light Scattering (DLS) also named Photon correlation spectroscopy (PCS).
The particle size measured by DLS is referred to as a “hydrodynamic radius” (RH). The
measured size is not only dependent on the core size of the NP but also on any polymer or solvent/ion molecules attached or loosely bound to the particle surface (Fig. 2). DLS
measurements apply best to homogenous population, i.e. monomodal (single peak), spherical or near-spherical, monodisperse (narrow width of distribution) particle suspensions in the range of 2 nm to 2000 nm with a single refractive index.
Grafting of PEG on a NP surface results in an increase of the NP diameter equals to twice the thickness (L) of the PEG layer. As shown in the SI (SI-S1.1), L can be related to the coverage-density σ, in the brush regime. Measurement of NP hydrodynamic diameters before and after PEG grafting have shown, in several studies, a diameter increase compatible with the PEG layer thickness expected from the theory, particularly in the brush regime. For example, size measurements of silica NPs by DLS, before and after grafting of PEG 5kD showed differences in diameter consistent with the radius of gyration of PEG [91].
Figure 2. Hydrodynamic diameter and core diameter of naked vs. PEGylated NP. (A): “Naked”
particle; (B): PEGylated particle (mushroom regime); (C): PEGylated particle (brush regime). Similarly gold NPs of different sizes were functionalized with mixtures of PEG of different molecular weights. DLS size results were related to PEG layer composition, ratio of long and short PEG chains reacted to the gold surface [92].
Stolnik et al. adsorbed small diblock PLA-PEG2000, PLA-PEG5000 and Poloxamine 908® to poly(styrene) (PS) or poly(lactic-co-glycolic) (PLGA) preformed NPs to create an adsorbed coating of PEG coating. The authors reported a coating layer thickness of 2 to 10 nm, consistent with value of L for PEG chains lengths used [47]. Similarly, Redhead et al. prepared PLGA particles and incubated them with Poloxamine 908®. Results showed an increase in mean particle size upon physisorption but with lower values (4-6 nm layer thickness) [24].
It is clear that RH overestimates the core particle radius RC which is the key parameter to
estimate the total surface on which PEG is attached or anchored. It is however, very much in use and the most reported radius value is usually z-average value, even if it is strongly affected by the presence of a small number of large particles. For NP surface characterization, it is more recommended to retain the mean radius from particle size distribution in number. Moreover, it provides values more comparable to size values obtained by technique such as TEM.
DLS can also put in evidence the effect of steric stabilization of a PEG layer on particle in suspension. This can be achieved by monitoring the decrease in particle size as the concentration of PEG derivatives, used in the preparation method destined to be adsorbed on the particle surface, is increased in the medium [51]. In several studies, PEG surface coverage has been correlated to aggregation kinetics (assess by DLS) at different salts concentration of the medium [31, 32].
The technique has limitations both as an analytical tool and in the type of particle that can be characterized. Firstly as mentioned above, only uniform (non-structured) spherical NPs can be
analyzed. Measurements on NPs with other shapes (elliptical, rod) or structure (core-shell, vesicle) should be performed with other methods, such as microscopy. The sensitivity of DLS is limited, mainly by two factors. First the PEG layer thickness is dependent on both PEG Mw and
coverage-density and it usually varies between 1 and 10 nm. This small difference in the layer thickness may not be detected, or be considered as significant, when measuring particle size well above this range (> 100-200 nm). However, for smaller particles (<20 nm), this difference may be significant providing that the polydispersity index (PDI) is constant before and after grafting. Indeed, it is essential to compare batches with low and similar PDI, as pointed out by several authors [91, 93]. Molecular species interacting with the particles and/or altering the properties of the suspension stabilizer, can impact the measurements as well [94]. Viscosity, pH, salts concentrations changes, release of surfactants from particles surface, as well as temperature and NP concentration can strongly impact the measurements and should be controlled to maintain similar conditions [95]. Finally characterization of mixtures of NP populations of different sizes or sizes above 1 µm should be avoided due to the lack of precision of most standard equipment in resolving such complex systems [93].
Correlations between NP hydrodynamic diameter and PEG surface coverage are not always straightforward because particle size assessed by DLS is measured at the shear plane between the particle and the surrounding fluid. The position of this shear plane is a priori different from the unperturbed chain length (see Fig. 3). Moreover, the increase of DH is not always consistent with
the scaling theory prediction of a PEG layer thickness in all cases [96], other contributions, such as aggregation state might be considered.
Finally, assessment of PEG presence by DLS is recommended only in the case of a PEG layer added after the formation of the NP. Nanoprecipitation or emulsion-based processes will generate very different NP sizes in presence or absence of PEGylated polymers that can act as surfactants.
Other sizing techniques are available to obtain hydrodynamic diameters (from particles suspended in liquid medium), such as Laser light diffraction, more adapted to multi-modal particle populations sizes up to 2000 µm in size. Nonetheless, this technique is limited to particle populations whose diameters is above 20 nm and to requires large sample volumes. Several other sizing techniques based on individual particles analysis, such as Particle Tracking Analysis (PTA) [97], Tunable Resistive Pulse Sensor (TRPS) or Scanning Ion Occlusion Sensing (SIOS) [98, 99] are still under evaluation to quantify PEG surface coverage.
Microscopy and related imaging techniques are rather limited for the characterization of PEG layer thickness measurement using particle size. Scanning electronic microscopy (SEM) and transmission electronic microscopy (TEM) allow to measure particle size (Fig. 3), with a resolution between 1 and 5 nm, if enough NP are analyzed to reach statistical significance [100]. Soft polymeric layers on NPs are not easily visible by TEM and SEM, even with positive and negative staining procedures such as the ones using heavy metals salts. Indeed, polymeric layers on NP are prone to collapse in vacuum and present low electronic density. Microscopy measurements are useful to assess the size of the core of the particles (see section S1.2 and S1.3 in SI about PEG coverage-density calculations). Similar issues are encountered when imaging with atomic force microscopy (AFM), as particles are usually imaged in the dry state [101, 102].
2.2. Surface hydrophilicity 2.2.1. Contact angle methods
Measures of changes in surface hydrophilicity are used on a routine basis to follow modifications of otherwise hydrophobic, flat substrates after grafting or derivatization with hydrophilic polymer such as PEG. Hydrophobicity of a surface is usually expressed by the three phase-contact angle value, of a liquid (usually water) droplet. In the case of micro- or nanoparticle it is a very difficult experiment, as the determination of contact angle is not usually possible at this
scale. Indirect methods have been proposed as surrogate measurements such as production of polymer and “particles” films, followed by measures of the static contact angle.
Films made from the same polymeric material (or material mix) as the particles can be studied for their surface properties. However, to be meaningful, the technique to produce the films should be representative of the NP preparation method. The general method used to obtain polymeric film is spin coating, although the surface properties created at the organic phase/air interface is not representative of the organic phase/water interface polymer organization found in emulsion-based or nanoprecipitation processes used to produce polymeric particles. A lower segregation of hydrophilic chains toward the air interface can be expected compared to the water interface.
Alternatively, it has been proposed to use “particle films” by spin coating a particle suspension on a glass substrate and to subsequently measure static contact angles with a goniometer. Using this approach several studies report correlations between contact angles with PEG surface density [90, 103]. However, contact angle is sensitive to surface energy/chemistry and roughness. Wetting will thus depend on particle size and state of aggregation of NP in the films as well as on the PEG content.
2.2.2. Chromatographic techniques
Chromatography has been used to assess the addition of a PEG layer on hydrophobic particles such as PLA or PS particle [47, 104, 105]. Hydrophobic interaction chromatography (HIC) allows separation of PLA and PEG-PLA NP on phenyl-agarose (high hydrophobicity scale) and butyl-agarose (low hydrophobicity scale) columns. The hydrophocity of NP samples was quantified by the percentage of particles retained on either of the column tested under phosphate buffer saline (PBS) elution conditions. PLA NP were found to be strongly retained on both type of support, while PEG-PLA were only slightly retained [105]. Hydrophilicity of PLGA particle modified with various amounts of PEG-PLA was also assessed by HIC [47] and similar results were obtained with PEGylated cyano-acrylates particles [37]. This technique provides evidence for the modification of the NP surface properties by PEG, but tend to give broad chromatographic peaks due to either the limited resolution of the column or/and particle surface heterogeneity.
2.3. Zeta potential
2.3.1. Principle of measurement
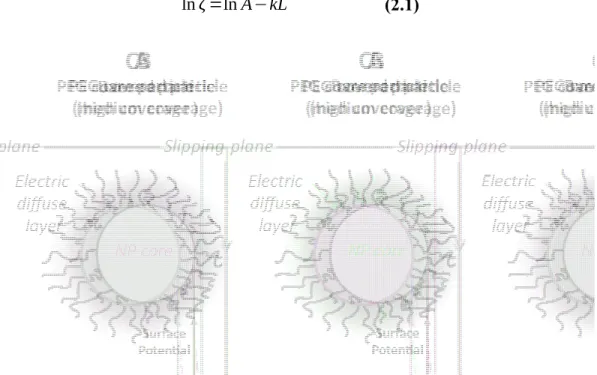
Surface charges present on the surface of a NP create at the close vicinity of the particle a diffuse layer of ions of opposite charge (see Fig. 3). Additionally, diffusing particles are “escorted” by a layer of solvent molecules strongly bound to their surface which increases effectively their hydrodynamic radius. The zeta potential (ζ) is the electrostatic potential of the NP measured at the interface between the strongly bound layer of solvent molecules and ions and the bulk liquid, also called the shear plane.
High ionic strength of the bulk liquid decreases the measured potential by effect of electrostatic screening. High ionic strength could also affect PEG conformation on the particle surface and alter the position of the shear plane [37]. Furthermore, ζ potential is not only dependant on salts concentration, but also on pH and the type of buffer [106]. Therefore all these parameters, ionic strength, pH and type of buffers have to be controlled to be able to compare adequately NP batches.
Several studies have reported a shift in the ζ potential upon adsorption of PEGylated macromolecules on different type of particles [24, 47] [51, 57]. Increasing the surface
coverage-density of PEG chains can cause an increase of the PEG layer thickness, which results in a further
decrease of ζ (Fig. 3 C) [27].
Similar results could be obtained with the increase of PEG chain lengths. Gref et al. showed that for PEG-PLA diblock polymeric NP, addition of 2 kD and 5 kD PEG never completely screened the ζ potential, even at high PEG weight percentage in the copolymer. On the other hand, 20 kD PEG have a stronger effect on ζ potential when PEG weight percentage is
increased in the copolymer, and could even result in a total screening of the surface charge [107]. Similarly, an addition of small PLA-PEG diblock on preformed PLGA particle results in a ζ potential correlated to PEG chain length increase [47]. Rahme et al. reported a non-linear relationship between PEG Mw and ζ potential of gold particles, with a plateau (a zeta potential
minimum) at around 20 kD PEG [108].
The variation of the zeta potential with the ionic strength has been indirectly related to PEG thickness in the case of liposomes [109, 110]. The “Fixed aqueous layer thickness” (or “FALT”), layer of water bound to the liposome surface and moving along with the particle can be calculated from the equation (2.1):
ln ζ =ln A−kL (2.1)
Figure 3. Effect of PEGylation on the position of the slipping plane and zeta potential. (A)
Bare negatively charged nanoparticle (ex. PLA NP); (B) Negatively charged NP after PEGylation (C) Negatively charged NP with a high surface density of PEG chains. Light grey area represents the electrostatic double layer moving along with the particle. The position of the slipping/shear plane is shifted outward from the particle surface as the length or the grafting density of the PEG chains is increased.
where L is the position of the shear plane (measured in nm from the particle surface); A is the surface potential and k is the inverse Debye length, which depends on the molality of electrolytes in solution. By measuring ζ at different ionic strength (different k), Sadzuka et al. were able to estimate the position of the shear plane L for different molecular weights of grafted PEG chains as well as for molecular weight mixture ratio for liposomal preparations [109, 110]. This approach was also used with poly(hexadecyl cyanoacrylates) (PHDCA) PEGylated nanoparticles [111].
2.3.2. Limitations of the method
The use of zeta potential measurement to assess PEG layer structure has several limitations. Zeta potential depends on pH, buffer type and salts concentration which may interfere with the effect of PEG layer [106]. It remains thus difficult to compare results acquired in different environments. For instance measurements PLA or PLGA nanoparticle PEGylation have been shown to weakly affect their zeta potential which stays strongly negative in spite of the addition of significant amount of PEG, even if the PEG amount on the surface is significant enough show a biological effect such as protein repellency and increased circulation time [105, 112].
Little evidences of quantitative correlations between PEG coverage-density and ζ have been reported so far, with the exception of the work of Meng et al. [27] describing PEG grafting onto PS particle. In this study a linear relationship was found between PEG surface concentration and ζ [27]. On the other hand, upon addition of PEG-PLA diblock on NP made of PLA, a plateau of the zeta potential value is reached rapidly at about 2% weight of PEG content [35]. In another study, polyplexes bearing cyclodextrins (CD) that were modified by PEG-Adamantane (PEG-AD) were reported to exhibited a maximal decrease in zeta potential up to a CD/PEG-AD ratio of 40% [31].
But unfortunately correlations between zeta potential and PEG grafting are not always evident. For example, grafting of PEG on gelatin nanoparticles was reported to have a modest effect on the zeta potential even if 90% of amino group available for grafting were coupled with PEG [96].
2.4. Protein binding
PEG coverage-density and conformation are known to control protein binding [2, 19]. Protein binding could thus be used as an indirect evidence for PEG layer presence on the particle surface.
Protein binding on the surface of NP increases the hydrodynamic diameter (and of PDI). Such increase has been reported to be more pronounced for bare PLA particles, particle without any PEG attached on the surface compared to particles exhibiting PEG on their surface [113]. However, such assay is not sensitive in PEG coverage-density or PEG chain length effect [35, 47]. Several studies showed a correlation between the quantity of bound proteins as detected by bicinchoninic acid assay (BCA dosage) and PEG surface-coverage and PEG chain length [114, 115].
Adsorption patterns of plasmatic proteins have been explored in 1D and 2D western blot and appeared to be well correlated to NP surface hydrophilicity [116]. Western blots also showed that the correlation is not valid for all proteins species [117]. Binding of proteins on NP surface have been related to surface properties by ITC microcalorimetry [36, 118].
PEG density and length have also been related to complement consumption activity in in vitro assays for PEG grafted on poly(isobutyl 2-cyanoacrylate) NP [2, 37] and for surface modified Poloxamine-PS NP [119]. Nitrogen content of particle surface quantified by X-rays photoelectrons spectroscopy (XPS) can be related to the concentration of adsorbed protein and therefore to efficacy of the PEG layer [120, 121]. More detailed information about XPS technique is presented in section 6.
One of the issues with proteins binding assay is the optimization of the separation method to isolate particle-proteins complexes. The method should be able to remove loosely bounded proteins while, maintaining biologically relevant interactions (even weak ones). If the conditions are too harsh, only the protein “hard corona” [122] will be evidenced. If the conditions are too mild, irrelevant protein interactions may be detected and quantified as well.
In a nutshell, although, indicative and useful on a routine basis to assess presence of PEG layer, indirect methods do not provide quantification of PEG and thus do not provide coverage-density, conformation and thickness data allowing comparison of different systems. They could be used as quality control of products but they are insufficient at the development stage of new particulate devices, where quantitative data are needed. They often provide poor correlation with PEG coverage, as evidenced in DLS, Zeta potential and protein adsorption data [35], particularly in the brush regime.
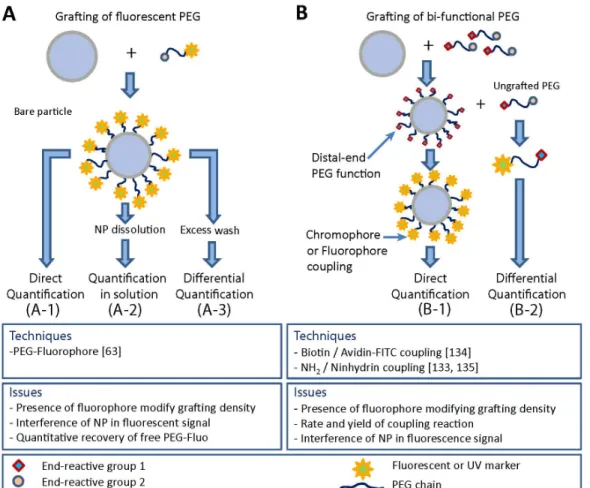
3. Direct assessment of surface PEGylation efficiency based on solution dosage
In term of methodology, PEG quantification can be performed by:
(1) Direct quantification on native particle (Fig. 4-A).
In this case, the method should allow a quantitative reaction (or detection) with tethered or grafted PEG chains and it should not be affected by the presence of the particle itself.
(2) Indirect quantification in solution, after the dissociation of PEG chains from the particle (Fig. 4-B).
The major limitation of this approach, considering that PEG can be also located in the particle core as well, is that only total PEG quantities are obtained rather than surface PEG quantities. The measurement method should work in a dissociation media (often an organic solvent) and additional preparation steps are needed to distinguish surface bound from total PEG.
(3) Differential quantification (Fig. 4-C).
In the case of a grafting reaction or adsorption on a bare particle, it is possible to quantify the initial concentration of PEG as well as the residual concentration after grafting and to deduce the amount grafted by difference.
3.1. PEG and PEG copolymer dosage by colorimetric methods
3.1.1. Detection of coordination complexes
Analytical methods to quantify PEG molecules or conjugates have been reviewed recently by Cheng et al. [123]. Iodine/potassium iodide colorimetric assay or Baleux’s assay involves the coordination reaction between Iodine and PEG yielding a blue compound which is quantified by spectrophotometry [124], In order to quantify PEG concentration at the surface and in the core of diblock PLA-PEG particles, Bazile et al. used an alkaline hydrolysis to degrade selectively the PLA and release the PEG from the NP. The authors found that all the PEG chains were quickly released from the NP confirming that the polymer was located mainly at the surface of the particle and not in the core [58]. The authors also proposed a calculation method to estimate PEG coverage-density from their dosage results (see further details in Supporting Information section). A similar method has been used to assess PEG content in poly(cyanoacrylate) NP [125], and in NP made of PEG-b-PLA to quantify methoxy-PEG amounts [126, 127].
The Baleux assay has been adapted by D’Addio et al. [128] to characterise and measure directly PEG surfactants (PEG attached to PS, PLA or PCL) deposition on latex NP (Fig. 5-A). The authors were able to correlate quantitative measurements of PEG coverage-density to NP clearance in vivo [128]. The same group characterized PEG coverage-density of PS-g-PEG adsorbed on latex particles and unbound surfactant in supernatants after centrifugation with the same assay [48].
Another colorimetric method worth mentioning for the extend of its use, is the aqueous ferro-thiocyanate assay. It is used for PEG conjugate or non-ionic PEGylated surfactant detection based on partition of PEG in an organic phase and forming a colored complex [123, 129, 130]. An optimized version of the test [130] has been used to follow the depletion of Poloxamine907® in the bulk solution upon absorption onto PS particles. Surface coverage-density and conformation can be then assessed at equilibrium from the adsorption isotherms [119, 131].
Limits of detection (LOD) of colorimetric methods are generally high. These methods often exhibit a limited sensitivity and a slow decay of absorbance over time. Great care has to be taken to get reliable data which requires fresh solutions and precise measurement time point [48]. Moreover, the described methods so far quantify PEG in solution only, which may require the degrafting of PEG from the NP surface.
3.1.2. Enzymatic detection
A special case of colorimetric detection by enzymatic reaction has been used to indirectly assess PEG surface coverage [132]. PLGA was blended with palmitate-avidin to obtain NP exhibiting avidin proteins on their surface. The affinity of avidin for biotin was used to “graft” PEG chains of the NP surface ligand-receptor interaction [132]. Attachment of PEG was studied by a two steps procedure, involving first the quantification of avidin present on the NP surface by protein assay. After “grafting”, a biotin-Horseradish peroxidase (HRP) conjugate was allowed to bind to still accessible avidin sites on the NP surface. The conversion of a chromogenic substrate by the enzyme was detected by spectrophotometry. The absorbance was inversely proportional to the number of biotin-PEG present on the surface [132].
Anti-PEG monoclonal antibodies, with specificity for methoxy terminal group or PEG monomer units, have been developed for PEG and PEG derivatives quantification [123]. The major advantage of antibody detection is the sensitivity of the assay usually in the picomolar range for free PEG or PEG small conjugate quantitation. Several modalities of colorimetric detection have been proposed either by direct detection or by competitive assays to yield quantifiable colored products [133-135]. For example, enzyme linked immuno-sorbent assay (ELISA) allows for the detection of PEG either in its free form or conjugated [135]. Reports of PEG quantification on intact particulate system are scarce. Cheng et al. reported quantitation of PEG on pegylated quantum dots and pegylated liposomes [133]. Although of interest because of the low limit of detection and the possibility to perform the assay in complex biological matrices, this approach has never been used to determine PEG surface coverage-density. It is unclear at this time if quantitative antibody binding can be obtained at high PEG chain coverage-density considering steric hindrance effects. A more suitableuse of this approach could be in the development of a more sensitive quantitation of dissociated PEG chains from NP surfaces.
3.2. Chromatographic quantification methods
Chromatographic detection of free and un-grafted PEG chains is usually done with refractive index (RI) or viscosimetric detectors rather than UV, as PEG is not quantifiable by UV detection.
Zillies et al. quantified grafted PEG chains on gelatin NP [136]. The author quantified unreacted PEG (non-attached to the gelatin NP) directly from the reaction mixture containing the gelatin NP and PEG (Fig. 4-C). Free PEG chains were separated from NP by asymetric flow field-flow fractionation (AF4) [137] and the effluents were analyzed by HPLC. Unreacted PEG was detected and quantified by GPC coupled to a refractive index (RI) detector. PEG grafting density was calculated by difference between the initial PEG quantity and the unreacted PEG quantified by HPLC [136].
Free PEG can also be detected and quantified by HPLC coupled with an evaporative light scattering detection (ELSD) as proposed by Zabaleta et al. [138]. Separation was provided by a size exclusion chromatography (SEC) column with a mobile phase gradient system suitable to separate PEG from other components [138]. ELSD detectors can detect and quantify non-volatile molecules without requiring any chromophore [139]. Similarly to the above mentioned strategy (Fig. 4- C), the amount of PEG grafted on NP was calculated as the difference between the initial PEG and PEG recovered in the supernatant of the suspension after washing. The results obtained by SEC-ELSD analysis were found to be quantitatively similar to 1H NMR analysis results (see section 5) [138].
Figure 4. Different PEG quantification strategies
Quantification methods of Poloxamer® (PEG derivatives) by ELSD and LC-MS detectors were found to have better sensitivity than RI and with less interference [140]. Indeed, RI detectors are very sensitive to contaminant and other environmental factor such as temperature and flow which results in low sensitivity, unstable baseline, high limit of detection and long equilibration time. As expected, ESI-MS method provided higher sensitivity. But, on the other hand, SEC-ELSD is easier and less expensive to operate than ESI-MS. It is also easier to transfer from a research environment to a manufacturing facility [140].
3.3. PEG quantification by UV and Fluorescence spectroscopy
UV and fluorescence quantification has been reported using different strategies by coupling of PEG with a chromophore or fluorophore. A critical point in the validation of the dosing procedure is to clearly identify the location of the dosed PEG (in solution or on the NP surface). In term of methodology and potential issues, the different situations could be summarized as follow (Fig. 5):
(1) UV/fluorescent PEG conjugates are attached on the particle surface (Fig. 5-A)
Quantification by UV/fluorescence can be done on purified NP preparation (Fig. 5-A1, Direct quantification), or on the un-grafted PEG (Fig. 5-A3, Differential quantification) or on dissolved particle as well (Fig. 5-A2, Quantification in solution). The potential problems common to all of these approaches arise from the modification of PEG physical-chemical properties caused by the UV/fluorescent tag, which could affect grafting yield, chain conformation and ultimately surface coverage.
Figure 5. Strategies of PEG quantification by fluorescence or UV spectroscopy. (A) Grafting of
fluorescently labeled PEG; (B) Labeling of grafted PEG chains
Direct quantification of grafted PEG chains using fluorescein-PEG 5 kD was recently reported on PRINT® NPs (hydrogel particle). [36] Bound PEG molecules were assessed by fluorescence spectroscopy using a calibration curve of serial dilution of free fluoroscein-PEG (Fig. 5-A1).
(1) Post-modification of grafted PEG (Fig. 5-B)
This approach requires the availability of a reactive group at the distal end of the PEG chain. Since reactive end groups may not be readily accessible for coupling, it is important point to make sure that the yield and rate of coupling are important enough to obtain quantitative measurements. End-functionalized PEGs are often used to attach fluorescent dye or specific ligand for active targeting. In the case of NH2 terminated PEG, amino groups can be quantify by the Kaiser test [141], a primary amine dosage test based on the reaction of NH2 with ninhydrin, resulting in a deep blue color (Fig. 5-B-2) [142]. The assay allows the quantification of bound PEG and hence coverage-density if the coupling reaction is complete. Trinitrobenzene sulfonic acid (TNBS) assay, another reactive for primary amine, was also proposed as an alternative to ninhydrin to dose unreacted diamino-PEG [27].
Coupling of a fluorescent marker to PEG chain end can be performed using a ligand receptor complexe such as biotin-avidin [143]. In such case, the avidin protein carries the fluorophore (usually FITC). If PEG grafting density is important, steric hindrance can between avidin proteins can impede binding and thus lead to an underestimate of PEG amounts.
Xia et al. reported the use of several complementary methods of PEG quantification using UV or fluorescence spectroscopies to determine PEG coverage-density on gold NP by dosing either PEG bound to the particle or free (unreacted) in solution [144]. In the study, the authors used bi-functional PEG (HS-PEG-NH2) covalently attached to a gold particle by their thiol end.
The coupling reaction yield was determined by reacting the remaining free PEG in solution via their primary amine with either fluorescamine (a marker becoming fluorescent upon coupling reaction with primary amine) or ninhydrin, the UV marker for the Kaiser test (“differential quantification” strategy illustrated in Fig. 5-B2). Using this approach, the authors were able to follow the decrease of free PEG concentration over time which was associated to the progress of PEG attachment to the NP. In another assay, fluorescein-isothiocyanate (FITC) was reacted with the available NH2 group on grafted PEG on gold NP [144].
After purification and dissolution of the particles, and measurement of the fluorescence signal, coverage-density was determined. The authors showed very large differences in PEG quantification between methods using free PEG quantification by fluorescamine coupling and direct reaction of FITC on surface tethered PEG chain. The authors attribute this difference to the insufficient reactivity of NH2 groups on PEG chains. It is however clear from these examples than even carefully controlled quantification method ought to be cautiously interpreted, and, complementary dosing methods are necessary to get a reliable value of the coverage-density.
To conclude, UV/florescence approaches are having the downsides to require preparation of specially labeled particles. These particles may not be completely representative of the “real” particles used in biological assays. The quantification method depends on the yield of the conjugation reaction and on the effect of interfacial properties of conjugated PEG. Availability of technique permitting a dosage without modification of the target (a label-free method) and in situ would be more advantageous. NMR and XPS analysis offer some of these advantages.
4. Direct assessment of surface PEGylation based on quantitative NMR
1H NMR is a quantitative analytical method, as the integrated peak surface is directly proportional to the number of proton being detected. Over the years, NMR has been refined with processing and instrument to the point it can be used to determine minute concentrations of metabolite and fine chemicals in biological samples. Practical considerations as well as specific parameters such as optimisation of signal, pulse sequences, gain, relaxation time, choice of internal standard, etc. are beyond the scope of this review and readers are referred to specialized literature on the subject [145, 146].
Three main approaches can be followed to quantify attached PEG chains: (i) the use of an internal standard whose signal does not interfere with PEG signal and soluble in the deuterated solvent; (ii) the electronic referencing by generation of an electronic calibrated signal avoiding contamination of the product (the signal is calibrated from previous product reference analysis, so it requires a two-steps calibration); (iii) use of an external standard. It is worth emphasizing the importance of having a clean and stable baseline (starting point of good peak integration) and to introduce relaxation delay (D1) long enough in the pulse program (usually five time the PEG T1) to
get quantitative results [147].
4.1. Total PEG dosage
Total PEG quantification by NMR is well described by Nance et al. [44]. The authors prepared PS particles and then modified their surface with PEG chains and later dissolved them completely in CDCl3. The quantification by NMR was performed using an internal standard added to the deuterated solvent [44]. Internal standards have also been used to determine total PEG in PEG/PLGA NP [106]. In this last study, the standard was a component of the particles, as the amount of PEG was calculated relatively to the amount of the PLGA polymer methylene proton. The molar ratio of the two species (PEG and PLGA) was well correlated to the theoretical PEG content allowing for the percentage of PEG incorporated in the NP to be established [106]. A similar approach was proposed with PEGylated PS particles, using PS signals as internal reference [52].
Lastly, NMR spectra of polypeptide-PEG NP dissolved in d-TFA–d-chloroform, acquired before and after PEG layer degrafting allowed to calculate the PEG coverage-density. The amount
of detached PEG was evaluated in reference to the polypeptide signals from the particle core [55]. The doped (“spiked”) sample method has been reported to estimate the total PEG-lipid content in NPs [112]. Known aliquots of PEG-lipid doped into the NP sample were yielding a linear increase of the protons PEG signal. The linear correlation was then used to determine the initial mass of PEG-lipid in the sample.
The use of external standards has also been reported to determine the total concentration of PEG in NPs by measuring the ratio of ethylene glycol protons signals (at δ=3.51 ppm) of NP completely dissolved in DMSO-d6 to the same signal for known amounts of free PEG analyzed in the same conditions [148]. By this technique, PEG grafted onto PS particle were quantified by the weight percentage using an external calibration curve with mixtures of known amounts of PEG and PS dissolved in CDCl3 [27].
It is important to note that after NP dissolution in a deuterated solvent, PEG chains from the core and from the surface become indistinguishable in the NMR spectrum. The signal obtained can represent the surface-bound PEG only if PEG is grafted or adsorbed exclusively on the surface.
4.2. Surface-bound PEG dosage
More interestingly, NMR can assess directly surface-bound PEG on intact particles suspended in D2O without any post-modification (Fig. 4-A). 1H NMR of NP suspended in D2O has been proposed for the first time by Hkrach et al. to qualitatively characterize NPs made of PEG-PLA diblock [149]. The authors demonstrated that only the anchored PEG could be seen in 1H NMR, with a similar signal compared to free PEG in deuterated water. The polymeric solid inner core mainly composed of hydrophobic PLA segments gave no NMR signals (Fig. 6). NMR confirmed that diblock PEG-PLA NP are structured around a hydrophobic core (mainly composed of PLA), surrounded by a hydrophilic layer of PEG [149-151]. Similar observations were made with lipid NPs containing PEG-stearate [67], or polymeric NP made of comb PEG-g-PLA [66, 152].
Surface PEG quantification methods based on 1H NMR have been developed relying on different calibration methods: (i) internal standard directly dissolved in deuterated water [22, 54, 67, 74], (ii) quantification referenced to a separated signal acquisition of a known quantity of PEG in the same conditions [148], (iii) external standard constituted by a narrow bore tube containing the reference placed coaxially within the tube containing the sample [150].
To determine PEG coating efficacy (% of total PEG found on the surface) of PLA-PEG NP, Sheng et al. calculated the ratio of surface PEG obtained in D2O analysis to the total PEG obtained from NP dissolved in CDCl3 [90].
Polymer mobility will vary from the anchoring point on the NP surface to its distal end in the bulk volume. This affects the relaxation time (T1) of the polymers along the chain resulting in peak
broadening which ultimately affects integration boundaries and quantification (Figure 7).
A potential problem associated with particle is the aggregation at the freeze-dried stage resulting in particle coalescence. To avoid such problem, addition of cryo-preservatives (usually carbohydrates) is commonly used but could interfere with PEG or internal standard NMR signals. PEGylated NP tendency to aggregate could result in a decrease of accessible surface to analysis and potentially to an underestimation of surface-bound PEG. This problem can be addressed by directly producing NP by emulsification-based method in D2O containing a hydrophilic internal standard [89].
Figure 6. 1H NMR spectra of PEG-PLA branched multiblock copolymer (PLA, M
n=71, 000
g/mol. attached to three blocks of PEG Mn=5,000 g/mol.) suspended in CDCl3; and 1H NMR spectra of nanoparticles prepared with the same polymer by emulsification-solvent evaporation and suspended in D2O. Figure adapted from [149].
5. Direct assessment of surface PEGylation by XPS
X-rays photoelectron spectroscopy (XPS) is an analytic technique to assess chemical composition of surfaces [153, 154]. This technique has been introduced to study polymeric NP by Brindley et al. investigating PS NP [73] and Shakesheff et al. working on PLA NP and associated surfactant [155].
5.1. Principles of XPS
In XPS, a monochromatic source of X-rays is directed toward the surface and inducts emission of photoelectron from the matter under investigation. The emitted photoelectrons from the core level orbitals are collected and identified for their energy and quantified by a detector. The detection is quantitative in atomic relative percentage, and those data can be converted to relative mass percentage of surface component. The error margin, in routine conditions is about 10 to 20% [156].
The thickness of the upper layer accessible to the XPS analysis depends on several factors such as the nature of the element (C, O), angle of emission, nature of the material and its density. As electrons have a limited ability to penetrate polymeric materials, the maximum sampling depth, accounting for 99% of the observed signal, is around 10 nm for carbon electrons and 8 nm for oxygen electrons [157]. Two types of surface analysis can be performed in XPS, (i) survey scan allowing elemental compositions analysis and (ii) high resolution scan allowing chemical bond identification and quantifications.
5.2. Survey scan and elemental analysis
Survey scan is a low resolution scan over à range of 1000 eV, aimed at identify elements present on the surface and quantify them by peak integration as relative percentage with a sensitivity of about 0.1 atomic %.
Kingshott et al. correlated PEG presence with O/C peak integration ratio obtained from the survey scans [120]. Quantification of relative presence of PEG based on elemental analysis is of a limited precision on polymeric NP as both PEG and polymeric segments of the copolymer have close carbon and oxygen compositions. Also, carbon contamination by environmental exposure of the samples during transfer can cause difficulties in the interpretation of the scans. Lastly, C1s and O1s sampling depth are different which can also increase discrepancies in results. On the other hand, if PEG has a functional group at the distal end or at the attachment point to the particle surface comprising heteroatom such as nitrogen (N) or sulfur (S) atoms, not present in any other particle components, the atoms can be identified and quantified.
Figure 7. (A) High resolution C1s (right) scans of PLGA-PEG nanocapsules with peaks
deconvolution and signal assignment (dashed line represents the acquired signal while solid lines represent deconvoluted signals). (B) SEM image of the nanocapsules analyzed. Adapted from [158].
5.3. High resolution spectra and chemical bonds quantification
High resolution scans are realized over a narrower range of electron energy (10eV), around signals of interest, usually carbon, oxygen and nitrogen. Deconvolution of the signals allows identification of the relative percentage of the different chemical states of an atom, and thus the chemical functionalities present at the NP surface (see in Fig. 7 an example of C1s spectra for PLGA-PEG nanocapsules). High resolution spectrum allows the calculation of the relative contributions of different chemical bonds and the quality of the data generated is dependent on the positioning of the peak of interest and the determination of the peak width. For example, if no other ether compounds are found in the particle, ether bond are specific to PEG (C-O-C peak) and the signal integration is correlated to PEG concentration [73].
XPS has been used to establish the presence of PEG at the surface of poly(cyano-acrylate) NP [159], diblock and multiblock NPs [160]; diblock PEG-PLA particles [161] or PEG-PLGA nanocapsules [158]. The presence of PEG derivatives such as Poloxamine® on NP made of PLGA was also reported using XPS [162]. Lacasse et al. prepared by spray-drying, 1-3 µm PLA microparticles (MP) in presence of a surface modifier, PEG distearate, a triblock polymer composed of stearate-PEG-stearate. The authors found that PEG segments were segregated at the surface and evidenced a correlation between the quantity of PEG distearate added during the preparation stage and PEG amounts determined by XPS on the MP surface [72]. Similarly, XPS data showed an enrichment of the surface in PEG compared to the bulk PEG-g-PLA polymer in the case of NP prepared by emulsion/solvent evaporation. This enrichment was correlated to the content of PEG copolymer [66, 113].
Likewise, additions of covalently linked amino-PEG 5 kD and 20 kD to core shell NP lead to an increase of the C-O-C signal in high resolution survey scan of C1s confirming presence of PEG
[163]. XPS also confirmed the successful grafting reaction of amino-PEG on the surface of polystyrene nanobeads [163]. End-functionalized amino PEG was quantified using the signal from 1s electron of the nitrogen at the binding energy expected for an amide bond.
XPS measurements only give access to a relative quantification of the different components detected at the NP surface [154]. By combining NMR and XPS analytical techniques, Ebbesen et
al. showed that it is possible to calculate the relative enrichment in PEG of the particle surface by
calculating of the ratio of total PEG determined by qNMR to surface PEG concentration, detected by XPS. The authors found a three to ten times higher concentration of PEG on the NP surface, depending on the nature of the PEGylated polymers added on PEG-PLGA particles [106].
5.4. Measurement of the PEG layer thickness by XPS
Core shell organization can be qualitatively estimated by recording XPS signal attenuation of specific core polymer signals by a a PEG corona of increasing chain length [74].
Furthermore, PEG coverage-density on NP surfaces can be calculated from XPS data by measuring the thickness of the PEG layer on the NP [50, 164, 165]. In the case of carbonaceous polymer particles, the attenuation of the carbon electron signal when covered by PEG can be related to the PEG layer thickness [164]. Knowing the thickness and volumetric-density of PEG (around 1.08 to 1.13g/cm3), the surface concentration (Γ: g/nm2) can be calculated as Γ= ρ L ; as well as the distance between grafted chain, D. This approach has been primarily developed for flat surfaces but was later extended to PEGylated MP such as Sephadex® MP [166]; Alginate/chitosan MP [167] or silica MP [168]. Its validity with NPs, which have a higher radius of curvature, is still to be demonstrated.
Quantification of PEG on particle surfaces by XPS has several limitations. The technique measures only surface PEG and the quantification is always relative not absolute. So far, XPS measurements are performed on a collapsed dehydrated PEG layer (in vacuum). The quantification of PEG can be extremely complicated with a multi-component surface especially when other ether compounds are present. Moreover, the effect of drying on PEG layer thickness and surface distribution is still unknown, but can have incidence on XPS results. Noteworthy, XPS is not strictly a surface analysis technique as the signal recorded is coming from the 8-10 nm upper layer of the particle. For a 100 nm diameter nanoparticle (50 nm radius), the volume accessible to XPS analysis represents about 48% of the volume of the particle.
6. Assessment of polydispersed PEG layer
PEG, as any polymeric material, has an intrinsic polydispersity. Formally, every PEG layers on a NP surface are composed of a mixture of different molecular weights. Small polydispersity has little consequences on quantification in most techniques. However, polydispersed PEG chains, such as mixed population of 2 kD and 5 kD PEG chains, are increasingly proposed to improve pegylated surface properties such as selectivity of active targeting [169].
Studies performed on flat surfaces exhibiting a short "underbrush" layer of 2kD PEG mixed with PEG 5kD, have shown a decrease in non-specific protein absorption [170-172] as well as an inhibition of endothelial cell outgrowth [173]. Similarly, it can be expected the same trend for nanocarriers surface, although it has not been intensively studied. Some studies on liposomes showed the benefits of this approach which induces an increase in circulation time [109, 110]. Colloidal stability of gold NP of different sizes has been improved using mixed molecular weights PEG layer as well [92]. Likewise, “hetero-brush” PEG surface (with 2 kD “underbrush” and 5 to 20 kD PEG chains) on peptidic nanospheres show greater protein resistance and stability in serum media compared to “homo-brush” PEG surface with either 2 kD or 5 kD chains [29, 54].
Direct quantification of mixed layers after grafting (PEG chains number and ratio) has yet to be reported. The simultaneous quantification of both PEG molecular weightsto ensure that the
optimal ratio is maintained throughout the preparation process is a real challenge. Finally assessment of the uniformity of the two chain populations on the entire surface of the particle [174] to avoid any possible phase separations or surface heterogeneity.
7. Perspectives and conclusions
Drug nanocarriers are not progressing to the clinical stage as fast as expected based on earlier promises [8, 175]. One of the main reasons for that failure can be attributed to the lack of complete surface characterization of these objects, the other major cause being the lack of knowledge about the biology of tissues and biological barriers [176, 177] governing the host-surface nanocarrier interactions at the nano-bio interface.
Combinatory approaches have been recently proposed to optimize drug carriers based on lipid NP [178] or diblock polymer particles [179] with high throughput screening. This approach is powerful but necessitates testing of hundreds of combinations. A complementary approach will be to build analytical tools to adequately report key properties and compare platform in order to build a knowledge-based framework for surface optimization.
Direct quantification of PEG on the surface of drug carriers is not trivial and the availability of convenient techniques for polymeric NP is still limited. Specific methods for PEG surface assessments are needed, and existing methods need to be validated and standardized for this purpose. Sources of error should be more exposed and discussed. This is not the case in most publications at the present time (see supporting information sections S1.2 and S1.3 for discussions on coverage-density calculation and error analysis). Two points are to be highlighted: firstly, rigorous care should be taken during NP size characterization, particularly for small particles (below 150 nm), secondly as mentioned in SI, section S1.3, the PEG coverage-density is mostly reported as a mean value, without any associated standard deviation, or interval.