This content has been downloaded from IOPscience. Please scroll down to see the full text.
Download details:
IP Address: 139.165.31.14
This content was downloaded on 11/08/2015 at 12:47
Please note that terms and conditions apply.
Detecting awareness in patients with disorders of consciousness using a hybrid
brain–computer interface
View the table of contents for this issue, or go to the journal homepage for more 2014 J. Neural Eng. 11 056007
(http://iopscience.iop.org/1741-2552/11/5/056007)
Detecting awareness in patients with
disorders of consciousness using a hybrid
brain
–computer interface
Jiahui Pan
1,5, Qiuyou Xie
2,5, Yanbin He
2, Fei Wang
1, Haibo Di
3,
Steven Laureys
4, Ronghao Yu
2,6and Yuanqing Li
1,61
Center for Brain Computer Interfaces and Brain Information Processing, South China University of Technology, Guangzhou 510640, Peopleʼs Republic of China
2
Coma Research Group, Centre for Hyperbaric Oxygen and Neurorehabilitation, Guangzhou General Hospital of Guangzhou Military Command, Guangzhou 510010, Peopleʼs Republic of China
3
International Vegetative State and Consciousness Science Institute, Hangzhou Normal University, Hangzhou 310036, Peopleʼs Republic of China
4
Coma Science Group, Cyclotron Research Centre and Neurology Department, University and University Hospital of Liĺĺge, B-4000 Liĺĺge, Belgium
E-mail:auyqli@scut.edu.cnandgesund@21cn.com
Received 10 June 2014, revised 19 June 2014 Accepted for publication 24 June 2014 Published 1 August 2014
Abstract
Objective. The bedside detection of potential awareness in patients with disorders of
consciousness (DOC) currently relies only on behavioral observations and tests; however, the misdiagnosis rates in this patient group are historically relatively high. In this study, we proposed a visual hybrid brain–computer interface (BCI) combining P300 and steady-state evoked potential (SSVEP) responses to detect awareness in severely brain injured patients. Approach. Four healthy subjects, seven DOC patients who were in a vegetative state (VS, n = 4) or minimally conscious state (MCS, n = 3), and one locked-in syndrome (LIS) patient attempted a command-following experiment. In each experimental trial, two photos were presented to each patient; one was the patientʼs own photo, and the other photo was unfamiliar. The patients were instructed to focus on their own or the unfamiliar photos. The BCI system determined which photo the patient focused on with both P300 and SSVEP detections. Main results. Four healthy subjects, one of the 4 VS, one of the 3 MCS, and the LIS patient were able to selectively attend to their own or the unfamiliar photos (classification accuracy, 66–100%). Two additional patients (one VS and one MCS) failed to attend the unfamiliar photo (50–52%) but achieved significant accuracies for their own photo (64–68%). All other patients failed to show any significant response to commands (46–55%). Significance. Through the hybrid BCI system, command following was detected in four healthy subjects, two of 7 DOC patients, and one LIS patient. We suggest that the hybrid BCI system could be used as a supportive bedside tool to detect awareness in patients with DOC.
Keywords: awareness detection, brain–computer interface, vegetative state, minimally conscious state, locked-in syndrome,
1. Introduction
Patients suffering from a severe brain injury may fall into a coma and develop a variety of different clinical awareness states. Some patients may progress to a vegetative state (VS), in which they may awaken but show no awareness of
J. Neural Eng. 11 (2014) 056007 (11pp) doi:10.1088/1741-2560/11/5/056007
5
These authors contributed equally to the manuscript.
6
Authors to whom any correspondence should be addressed.
Content from this work may be used under the terms of the
Creative Commons Attribution 3.0 licence. Any further distribution of this work must maintain attribution to the author(s) and the title of the work, journal citation and DOI.
themselves or their environment (Jennett and Plum 1972). Other patients may improve to a minimally conscious state (MCS), in which they demonstrate inconsistent but repro-ducible signs of awareness (Giacino et al 2002). Currently, the clinical diagnosis of patients with disorders of con-sciousness (DOC) such as VS and MCS is based only on behavioral observations. Misdiagnosis rates in VS and MCS patients are relatively high, ranging from 37 to 43% (Childs et al 1993, Andrews et al 1996, Schnakers et al 2009a). Detecting signs of awareness in these patients is particularly challenging.
In recent years, functional magnetic resonance imaging (fMRI) and electroencephalographic (EEG) techniques have been proposed to examine the residual brain function in some DOC patients (see Chatelle et al2012, Liberati and Birbau-mer2012, Noirhomme et al2013for review). These studies aimed to detect command-specific changes in fMRI or EEG signals and to provide motor-independent evidence of awareness. Using fMRI, several studies have objectively quantified patients’ cerebral processing during the visual presentation of familiar faces to VS patients (Owen et al 2002) and during auditory presentation of the patients’ own name to MCS patients (Laureys et al 2004, Di et al2007). In one case study (Owen et al2006), a VS patient was instructed to ‘imagine playing tennis’ or to ‘imagine walking through her house’ during an fMRI experiment. This VS patient displayed motor imagery-related brain activations similar to healthy controls during both tasks. In a follow-up study (Monti et al2010), the potential of this paradigm was exploited to map imagery tasks to yes/no responses. Of 54 patients assessed (23 VS and 31 MCS patients),five (four VS and one MCS patients) were able to willfully modulate their brain activity. Unlike fMRI, EEG offers the potential for the development of a relatively inexpensive and portable system that can be used at the bedside (Naci et al2012). For instance, Schnakers et al tested 22 patients (eight VS and 14 MCS patients) who were instructed to count the instances of their own names presented within an auditory sequence mixed with other names (Schnakers et al2008). They found that five of the 14 MCS patients produced larger P300 responses to their own names during the actively counting condition than during the passively listening condition. Cruse et al instructed a group of 16 VS patients to imagine either squeezing their right hand or moving their toes. (Cruse et al2012a). Three of the sixteen VS patients were able to modulate their sensor-imotor rhythms, with cross-validated accuracies between 61–78%. However, the subsequent independent analysis illustrated the remaining challenges to propose reliable tech-nologies for clinical use in DOC patients (Goldfine et al2013).
Brain–computer interfaces (BCIs) are a relatively new technology that enable direct communication with an external device without the use of peripheral nerves and muscles (Wolpaw et al2002). The potential use of BCIs for awareness detection and online communication with DOC patients has recently been demonstrated in a few studies (Lulé et al2012, Muller-Putz et al 2012, Coyle et al 2012, Müller-Putz et al 2013). Lule et al tested a four-choice auditory
P300-based BCI with 13 MCS, three VS, and two locked-in syn-drome (LIS) patients (Lulé et al2012). One LIS patient had a significant correct response rate of 60%, but no other patients could communicate through the BCI system. Coyle et al used an MI-based BCI system to determine if real-time feedback enhanced the systemʼs ability to detect awareness in an MCS patient (Coyle et al 2012). The results indicated that the patient could perform the MI tasks using real-time feedback and achieved 80% online accuracy. Unlike fMRI and EEG-based ERP techniques, a key characteristic or advantage of BCIs in awareness detection is that the real-time detection result can be provided as a form of feedback. This real-time feedback has positive effects for the patients to use the BCI if they have awareness. However, the use of BCIs to detect awareness in DOC is still in its infancy, stronger BCIs are needed to improve brain activity detection.
For BCI-based awareness detection, an important issue is the modality of stimulation and feedback. To date, almost all of the existing studies focus on auditory stimuli due to the fact that most of the patients with DOC often suffer from gaze fixation impairment. However, it has been proven difficult to develop effective auditory BCIs that deliver promising per-formance (Kübler et al 2009, Halder et al 2010). This is because the brain signals evoked by the auditory stimuli are generally weaker than those evoked by the visual stimuli. Currently, the most robust BCIs enabling high accuracy in healthy subjects are based on visual stimuli and feedback (Sellers et al 2006, Bin et al2009). Furthermore, ones have developed several gaze-independent P300- or SSVEP-based BCIs based on visual stimuli although for healthy subjects (Brunner et al2010, Treder et al2011, Lesenfants et al2011). Another issue is the chose of stimuli and feedback. Among the emotionally laden visual stimuli, face is a pow-erful one to gain entry to awareness. Lavie et al suggested that faces are special stimuli for attention because of their parti-cular biological and social significance (Lavie et al 2003). It may be promising to use facial photos as visual stimuli to maximize our chances of awareness detection for the patients with DOC.
Recent studies have validated hybrid BCIs, which directly combine two or more different types of brain signals (Pfurtscheller et al2010a). The performance, e.g., classi fica-tion accuracy, of the BCIs could be improved by combining these brain signals (Allison et al 2010a, Pfurtscheller et al2010b, Long et al2012, Li et al2013). In our previous study (Li et al2013), a hybrid BCI combining the P300 and steady-state evoked potentials (SSVEPs) was developed for the detection of idle state in healthy subjects. We demon-strated that the performance of idle state detection was better for the hybrid BCI than for the P300- or SSVEP-based BCI. As an application, this method was used to produce a ‘go/ stop’ command in real-time control of a wheelchair.
Considering the above factors, we proposed a visual hybrid BCI combining P300 and SSVEP, a variant of our previously established system (Li et al 2013), for the detec-tion of awareness in DOC patients in this study. In the system, the visual stimuli and feedback were the patientʼs own facial photos, or unfamiliar facial photos. Specifically, through both
P300 and SSVEP detection, this system determined whether the patient focused on the instructed target, the patientʼs own facial photo, or an unfamiliar facial photo displayed on the graphical user interface (GUI). Using this system, the ability of the DOC patient to follow commands could be detected. Eight patients (four VS, three MCS, and one LIS patient) and four healthy subjects participated in our experiment; three patients (one VS, one MCS and one LIS patient) were able to follow commands using our hybrid BCI (classification accu-racy 70–78%). These results implied that the three patients possessed residual cognitive function and conscious aware-ness, which were detected by our BCI system.
The remaining part of this paper is organized as follows. The methodology including the patients, experimental design, and data processing are presented in section 2. The experi-mental results are presented in section3. Further discussions on the system and results are involved in section4.
2. Methodology
2.1. Subjects
This study was undertaken at the Liuhuaqiao Hospital, Guangzhou, China, between October 2012 and July 2013. Brain activity was detected only when patients were free of centrally acting sedative drugs. Eight severely brain-damaged Chinese patients participated in this experiment (four males; four VS, three MCS, and one LIS; mean age ± SD, 38 ± 19 years; see table 1). The study was approved by the Ethics Committee of Liuhuaqiao Hospital which complies with the Code of Ethics of the World Medical Association (Declara-tion of Helsinki). Written informed consent was obtained from each patientʼs legal surrogates. The VS and MCS clin-ical diagnoses were based on the JFK Coma Recovery Scale-Revised (CRS-R), which comprises six subscales that address auditory, visual, motor, oromotor, communication, and arousal functions (Giacino et al 2004). During the experi-ment, the eight patients underwent a CRS-R assessment every two weeks (thefirst CRS-R assessment happened within the week before the experiment). For each patient, the CRS-R scores presented in table 1 were based on his/her best responses of the repeated CRS-R assessments. No patient had a history of impaired visual acuity. In all eight patients, visual evoked potentials to flash stimulation showed preserved bilateral cortical responses. Additionally, four healthy sub-jects (HC1, HC2, HC3 and HC4) with no history of neuro-logical disease (three males; mean age ± SD, 29 ± 2 years) were included in our experiment as control group.
2.2. Experimental design
2.2.1. GUI and stimuli. The GUI used in this study is illustrated infigure1. Facial photos were used as stimuli to capture the attention of unresponsive patients. Two full-face, frontal-view photos, the subjectʼs own photo and an unfamiliar photo, were pseudo-randomly chosen from two sets of facial photos (ten photos of the subject and ten
luminance- and contrast-matched unfamiliar photos of individuals of the same gender as the subject) and randomly displayed at the left and right side of the GUI. None of the subjects had facial hair or wore glasses. All photos were cropped to remove extraneous background, but the outlines of faces, including hairstyles, were preserved. In addition, all of the photos were modified using Adobe Photoshop 7.0 (Adobe, San Jose, CA) to produce identical overall luminance and contrast on a white background. Each 6.6 cm × 9 cm facial photo was placed in the center of a white photo frame sized 8.6 cm × 11 cm with a margin width of 2 cm. The horizontal distance between the two photo frames was 4 cm in the GUI. The ratios of the photo sizes (areas), the photo frame, and the GUI were matched for all stimuli and set at 0.06:0.1:1.
The two photos on the left and the right sides of the GUI flickered from appearance to disappearance on a black background at frequencies of 6.0 Hz and 7.5 Hz, respectively. Meanwhile, the two photo framesflashed in a random order, with each appearance lasting 200 ms and with an 800 ms interval between two consecutive appearances. The subject was instructed to focus on one or the other type of photo (e.g., the subjectʼs own photo or the unfamiliar one) and to count the flashes of the corresponding photo frame. Using this hybrid BCI paradigm, SSVEP (i.e., stimulus frequency driven EEG responses (Allison et al2010b)) and P300 (i.e., stimulus ‘oddball’ or novelty driven EEG responses (Guger et al 2009)) responses were simultaneously elicited by the flickering target photo and the flashing target photo frame, respectively.
2.2.2. Experimental procedures. During the experiment, each subject was seated in a comfortable wheelchair approximately 0.5 m from a 22 inch LED monitor. A preliminary screening was conducted before the experiment to explain the experimental procedure to the subject. Figure 1.GUI of the hybrid BCI, in which a subjectʼs own facial
photo and an unfamiliar facial photo are randomly displayed on the left and right side in each trial. The left and right photosflickered from appearance to disappearance on a black background at frequencies of 6.0 Hz and 7.5 Hz, respectively. Meanwhile, the two photo frames alsoflashed from appearance to disappearance in a random order. In this way, the SSVEP and P300 responses could be simultaneously elicited by theflickering target photo and the flashing target photo frame, respectively.
Before the online experiment, each subject performed a calibration run of ten trials with the GUI in figure 1. Specifically, for each trial, the left and right photos flickered for 10 s at frequencies of 6.0 Hz and 7.5 Hz, respectively. Simultaneously, the two photo frames flashed in a random order, with each photo frameflashing five times. The subject was instructed to pay attention to his/her own photo and to count the number of times that the corresponding photo frame was highlighted/flashed. We trained an initial P300 classifica-tion model using the EEG data from the calibraclassifica-tion run. Furthermore, the P300 classification model was updated after each block of online evaluation based on the data from the calibration run and the collected online data. The rationale for training the P300 model in this manner was two-fold. First, because the patients were prone to be fatigue (inherent to DOC), the calibration procedure should be as short as possible, and a new calibration was not suitable before each evaluation block on a separate day. Second, due to the fluctuating level of consciousness in DOC patients, it was not appropriate to use afixed model during the experiment lasting several days to weeks.
In the online evaluation, three experimental runs were conducted. Figure 2 illustrates the online experimental paradigm. Each run contained five blocks, and each block was composed of ten trials. Different blocks were conducted on separate days because the patients were easily fatigued and have limited attention span. Each trial began with the visual and auditory presentation of the task instructions (in Chinese), which lasted 6 s. Meanwhile, the two photos, the subjectʼs own facial photo and an unfamiliar facial photo, were randomly displayed on the left and right sides of the GUI. The instruction for each trial of run 1 was‘focus on your own photo and count the number of times that your own photo frame is highlighted’; the instruction for each trial of run 2 was‘focus on the other personʼs photo and count the number of times that the other personʼs photo frame is highlighted’; the instruction for each trial of run 3 was the same as that of run 1 or 2. Specifically, the subject was instructed to focused on his/her own photo or the unfamiliar photo in a pseudo-random order in run 3. In each block of run 3, half of the trials corresponded to his/her own photos and the other half of the trials corresponded to the unfamiliar photos. After the instructions were presented, the two photos flickered while
the two corresponding photo frames flashed as in the calibration run. After 10 s, a feedback photo, determined by the BCI algorithm, appeared in the center of the GUI. If the result was correct, a positive audio feedback of applause was given for 4 s to encourage the subject. There was a short break of at least 10 s between two consecutive trials, depending on the subjectʼs level of fatigue. Note that the tasks of runs 1, 2, and 3 were getting more and more difficult for a patient. Only if a subject successfully performed the tasks in runs 1 and 2, he/she was asked to perform run 3.
During the experiment, the patient was carefully observed by the examiner to ensure task engagement and to avoid that the patient would show decreased arousal (i.e., close his/her eyes) or continuous body movements (e.g., resulted by cough) during a testing trial. In this case, the trial was discarded, and the next trial would start after the patient again showed prolonged periods of spontaneous eye-opening or reawakened. For each trial of the experiment, in addition to the presented instructions, the doctor and the patients’ relatives also told the patients to focus on the target photo.
2.3. Data processing
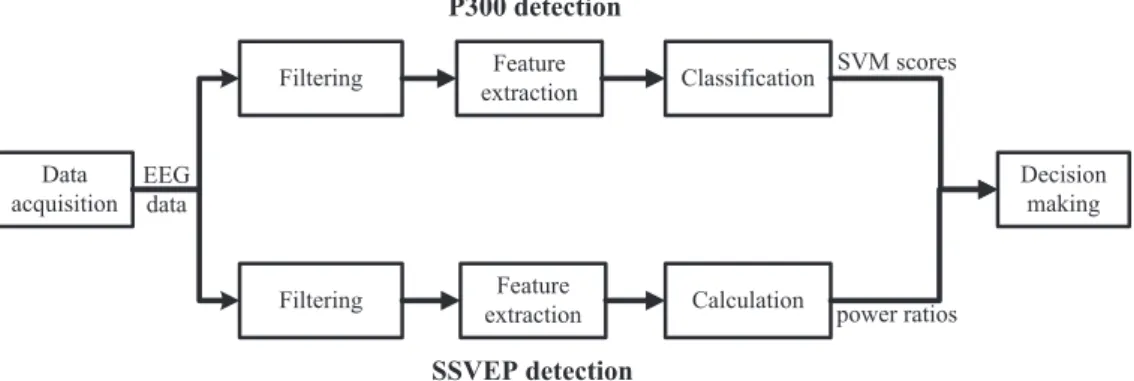
The procedures for the P300 and SSVEP detections have been described previously (Li et al 2013). Briefly, the P300 and SSVEP detectors were designed separately. The EEG data were copied and fed into the two detectors simultaneously. Figure3shows the data processing procedure for both P300 and SSVEP detections.
2.3.1. Data acquisition. A NuAmps device (Compumedics, Neuroscan, Abbotsford, Australia) was used to collect scalp EEG signals. Each subject wore an EEG cap (LT 37). The EEG signals were referenced to the right mastoid. Here we performed channel selection during data acquisition to keep the related neurological phenomenon intact as well as reduce the artifacts (Lan et al 2006). According to the standard 10–20 system (Jasper 1958), the EEG signals used for analysis were recorded from ten electrodes:‘Fz’, ‘Cz’, ‘P7’, ‘P3’, ‘Pz’, ‘P4’, ‘P8’, ‘O1’, ‘Oz’ and ‘O2’ (Li et al 2013, Guger et al2009, Friman et al2007). The impedances of all electrodes were kept below 5 k Ω. The EEG signals are digitized at a sampling rate of 250 Hz.
Table 1.Summary of patients’ clinical status. ABI, anoxic brain injury; CRS-R, coma recovery scale-revised; CVA, cerebrovascular accident; and TBI, traumatic brain injury. Note that the clinical diagnosis and the CRS-R score for each patient were based on the best response of the repeated CRS-R assessments during the experiment.
Patient Age Gender
Clinical
diagnosis Etiology
Time since onset (months)
Best CRS-R score (subscores: auditive–visual-motor–oromotor–communication–arousal) VS1 22 F VS ABI 6 6 (1-0-2-1-0-2) VS2 19 M VS TBI 5 7 (1-1-2-1-0-2) VS3 56 M VS CVA 7 5 (0-1-1-1-0-2) VS4 36 F VS ABI 1 4 (1-1-0-0-0-2) MCS1 47 M MCS TBI 18 10 (1-3-3-1-0-2) MCS2 16 F MCS ABI 3.5 12 (1-3-5-1-0-2) MCS3 36 F MCS TBI 4 10 (1-3-3-1-0-2) LIS1 70 M LIS CVA 37 14 (4-5-0-0-2-3)
2.3.2. P300 detection. Here, the EEG signals were filtered between 0.1 and 10 Hz. We extracted epochs (0–800 ms after a photo frameflash) of the EEG signal from each channel for each flash of a photo frame. This EEG epoch was downsampled by a rate of five to obtain a data vector consisting of 40 data points. We concatenated the vectors from all 10 channels to obtain a new data vector, which corresponded to a photo frameflash. Next, we constructed a feature vector for each photo frame by averaging the data vectors across the five flashes in a trial. Finally, a Support Vector Machine (SVM) classifier was applied to the two feature vectors corresponding to the two photos, and two SVM scores were obtained for each trial.
2.3.3. SSVEP detection. Here, the EEG signals werefiltered between 4 and 20 Hz. After stimulus onset, we extracted the segment of the EEG signals from eight channels,‘P7’, ‘P3’, ‘Pz’, ‘P4’, ‘P8’, ‘O1’, ‘Oz’ and ‘O2’, during a 10 s period (i.e., 2500 data points). Next, a weighted sum of the eight epochs was calculated by obtaining the weights through the application of the minimum energy combination method, which enhanced the EEG information and/or reduced the nuisance signals including EMG and EOG artifacts (Friman et al 2007). Using a discrete Fourier transformation, we
calculated the power density spectrum of this weighted signal. We calculated the power of this SSVEP response by integrating the power density spectrum of each flickering frequency and its second harmonic. The power ratio for each flickering photo was calculated as the ratio of the mean power in a narrow band (i.e., band width of 0.1 Hz) and in a wide band (i.e., band width of 1 Hz). In each trial, two power ratios were obtained for the two photos’ flickering frequencies.
2.3.4. Decision making algorithm and accuracy calculation. We summed the P300 detection SVM score and the SSVEP detection power ratio for each photo and determined the photo that corresponded to the maximum of the summed values as the trial feedback photo.
Accuracy was calculated as the ratio of the number of all correct responses (hits) among the total number of presented trials. To assess the accuracyʼs significance, we calculated statistics as described below (Kübler and Birbaumer 2008):
∑
χ = − =(
fo fe)
fe , (1) i k i i i 2 1 2where foi and fei are the observed and expected frequencies, respectively, of the ith class ( =i 1, 2 ,..., ). In this study, thek
Figure 2.The experimental paradigm. Each run was divided intofive blocks, and each block consisted of ten trials. Each trial began with the visual and auditory presentation of the task instructions. Then, two photos were randomly displayed on the left and right sides of the GUI. After the instruction, the two photosflickered, and the two corresponding photo frames were highlighted. After 10 s, an auditory (i.e., applause) and visual feedback (i.e., photo selected by the classification algorithm) was presented.
Figure 3.The data processing procedure for the P300 and SSVEP detections. In the hybrid BCI system, the EEG data were fed into two different data processing procedures simultaneously, one for P300 detection and the other for SSVEP detection. Next, the two detection outputs were merged to provide a weighted single decision.
observations fell into two classes (hit and miss). Specifically,
fo1 and fo2 were the observed numbers of hits and misses, respectively, and fe1 and fe2 represented the respective expected numbers of hits and misses. The degree of freedom was 1 for our two-choice BCI. For example, when 50 trials of a two-choice paradigm were available for each run, 25 hits and 25 misses could be expected by chance. Using a significance level of p = 0.05, we obtained a value of 3.84 for χ2 (with the degrees of freedom set at 1), which corresponded to 32 hits in 50 trials or an accuracy of 64%.
3. Results
Table 2 summarizes the experimental results obtained for each subject. In all the eight patients, accuracies for patients VS1, MCS1, and LIS1 were significant in runs 1 and 2. In run 1, five of the eight patients (patients VS1, VS2, MCS1, MCS2, and LIS1) achieved accuracies higher than chance level (i.e.,⩾64%; ranging from 64 to 78%). In run 2, three patients (patients VS1, MCS1, and LIS1) achieved accuracies
⩾64% (ranging from 70 to 72%). The accuracies for patients VS2 and MCS2 were significant in run 1 but not run 2. This result may have occurred because emotional value or high familiarity makes oneʼs own facial photo particularly likely to attract oneʼs attention (Signorino et al 1995, Kircher et al 2000,2001, Lavie et al2003, Bindemann et al2005),
similar to when a patientʼs own name is used as a stimulus (Perrin et al 2006). For patients VS3, VS4, and MCS3, the accuracies were not significant in either run 1 or run 2. The three patients VS1, MCS1, and LIS1 who successfully per-formed runs 1 and 2 still achieved accuracies higher than chance level in run 3 (i.e.,⩾64%); ranging from 66 to 76%). Furthermore, four healthy subjects (HC1, HC2, HC3, and HC4) achieved accuracies⩾64% (ranging from 82 to 100%) in runs 1, 2, and 3.
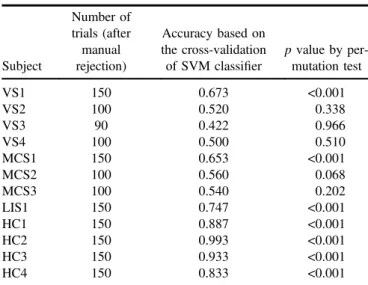
In this study, we used the chi-square test to determine statistical significance (i.e., p value) of the online accuracies. However, in chi-square statistics, the detection results are assumed to be independent (Lewis and Burke1949, Satorra and Bentler2001). This might not be suitable for our case. To account for independence among trials, we used a permuta-tion test to re-evaluate the data for each subject as below (Goldfine et al2012,2013).
First, we calculated the leave-one-out cross-validated accuracy using the data of this subject (runs 1 and 2 for VS2, VS3, VS4, MCS2, and MCS3; runs 1, 2, and 3 for VS1, MCS1, LIS1, HC1, HC2, HC3, and HC4). Specifically, in each fold, one trial of data were used for test, and the other data were used for training. An SVM classifier was first obtained based on the training data, and then applied to the test data. After the leave-one-out cross-validation procedure, we obtained the classification accuracy. Next, we performed 1000 permutations, in each of which we generated a surrogate Table 2.Online results for each subject. The results in the brackets are obtained based on the total number of trials (i.e. including the rejected trials). The accuracies significantly higher than the chance level (⩾64%, p ⩽ 0.05) are highlighted in bold. All subjects performed 50 trials in each of the three runs, with the exception of patient VS3.
Run 1 Run 2 Run 3
Subject
Number of
trials Accuracy p value
Number of
trials Accuracy p value
Number of
trials Accuracy p value VS1 50 76% <0.001 50 72% 0.002 50 68% 0.011 (57) (74%) (<0.001) (60) (70%) (0.002) (51) (67%) (0.017) VS2 50 64% 0.048 50 50% 1.000 (58) (62%) (0.066) (57) (49%) (0.895) VS3 50 48% 0.777 40 55% 0.527 (56) (48%) (0.789) (46) (54%) (0.555) VS4 50 52% 0.777 50 52% 0.777 (56) (52%) (0.789) (57) (51%) (0.895) MCS1 50 72% 0.002 50 70% 0.005 50 66% (0.017) (56) (70%) (0.003) (52) (69%) (0.006) (55) (64%) (0.043) MCS2 50 68% 0.011 50 52% 0.777 (55) (65%) (0.022) (55) (53%) (0.686) MCS3 50 46% 0.572 50 48% 0.777 (58) (47%) (0.599) (58) (48%) (0.793) LIS1 50 78% <0.001 50 72% 0.002 50 76% <0.001 (57) (74%) (<0.001) (55) (71%) (0.002) (56) (71%) (0.001) HC1 50 84% <0.001 50 82% <0.001 50 94% <0.001 (50) (84%) (<0.001) (50) (82%) (<0.001) (50) (94%) (<0.001) HC2 50 100% <0.001 50 100% <0.001 50 100% <0.001 (50) (100%) (<0.001) (50) (100%) (<0.001) (50) (100%) (<0.001) HC3 50 94% <0.001 50 100% <0.001 50 96% <0.001 (50) (94%) (<0.001) (50) (100%) (<0.001) (50) (96%) (<0.001) HC4 50 96% <0.001 50 96% <0.001 50 98% <0.001 (50) (96%) (<0.001) (50) (96%) (<0.001) (50) (98%) (<0.001)
dataset by randomly relabeling the trials, and then calculated the leave-one-out cross-validated accuracy using the surrogate dataset. The p value was then determined as the fraction of the accuracies obtained by the 1000 permutations which were higher than the real accuracy. Table 3 shows the permutation test results, from which we can see that the accuracies were significantly higher than the chance level for the three patients VS1, MCS1, LIS1 and the four healthy subjects (p⩽0.05). For the subjects VS1, MCS1, LIS1, and HC1, the ERP waveforms and power spectra were calculated using the data collected in the three experimental runs. Specifically, for each trial, the EEG epochs of each channel were extracted from 200 pre-stimulus to 1000 ms post-stimulus, and baseline corrected using 200 ms pre-stimulus. The ERP waveforms were obtained by averaging the EEG channel epochs across 50 trials in runs 1, 2 and 3. Figure4shows the average EEG signal amplitudes of the electrodes‘Fz’ and ‘Pz’ for subjects VS1, MCS1, LIS1, and HC1; the solid red and the dashed blue curves correspond to the target and the non-target photo frames, respectively. A P300-like component is apparent in each of the target curves.
For each run (run 1, 2 or 3) and each subject (VS1, MCS1, LIS1, or HC1), figure 5 shows two average power density spectrum curves of the EEG signals across the trials with the target photos appearing the left or right of the GUI. The power spectrum of each trial was calculated using 10 s of EEG signals from the eight selected channels (‘P7’, ‘P3’, ‘Pz’, ‘P4’, ‘P8’, ‘O1’, ‘Oz’ and ‘O2’), as in the SSVEP detection. Figure5shows that higher average spectral powers were obtained in the target photo frequencies for all four subjects.
4. Discussions
We here propose a hybrid P300- and SSVEP-based BCI to improve the detection of residual cognitive function and covert awareness in DOC patients. In this novel BCI para-digm, two flickering photos, the subjectʼs own facial photo
and an unfamiliar facial photo, were randomly displayed on the left and right of the GUI, and each photo was embedded in a flashing photo frame. The BCI system determined which photo the subjects focused on (i.e., responded to command) through both the P300 and SSVEP detections.
Using our hybrid P300- and SSVEP-based BCI, three experimental runs involving eight patients (five VS, three MCS, and one LIS) were conducted. In run 1, the patients were asked to focus on their own photo. Five of these patients (two VS, two MCS, and one LIS patients) achieved accura-cies of greater than 64% (64–78%), which were considered significant accuracies. However, a correct response to the patientʼs own photo is not unequivocal evidence that a person is consciously aware. It has been argued that a P300 response evoked by oneʼs own name does not necessarily reflect con-scious perception and cannot be used to differentiate VS and MCS patients (Perrin et al 2006). Furthermore, Signorino et al who showed that emotional (as compared to neutral) stimuli increase the likelihood of obtaining a P300 response in comatose patients (Signorino et al 1995). To address this question, in the second run, where patients were instructed to focus on the unfamiliar photos, three of thefive patients (i.e., patients VS1, MCS1, the LIS patient) achieved accuracies significantly higher than the chance level. Furthermore, in the third run, where patients were instructed to attend their own or the unfamiliar photos randomly, the three positive patients still achieved significant accuracies (66–76%), illustrating that the three patients were able to follow commands.
Among the eight patients involved in this study, one patient (VS1) who was clinically diagnosed as vegetative based on repeated behavioral standardized CRS-R assess-ments by trained and experienced clinicians was able to use the hybrid P300- and SSVEP-based BCI to choose the target photos. This result corroborates previous fMRI (e.g., Monti et al2010) and EEG (e.g., Cruse et al2012b) data that some patients who meet the behavioral criteria for VS might have residual cognitive function and even conscious awareness. The MCS patient (MCS1) who showed motor-independent BCI signs of command-following never showed any clinical motor sign of command-following for over a year prior to testing. The patient subsequently emerged from his condition and showed motor-dependent behavioral communication two months after the experiment-while patient VS1 remained clinically unchanged at follow-up.
It should be stressed that to perform the assessed experimental hybrid BCI tasks, many cognitive functions are needed, such as language comprehension (i.e., understanding the task instructions), object selection (i.e., attending to the left or right sided photo), working memory (i.e., remembering the instructions), and sustained attention (i.e., keeping atten-tional focus on the target photo). The absence of any of these cognitive functions could prevent success of performing the paradigm. Negative results can hence not be used as final evidence of a lack of awareness because false-negative find-ings in BCI studies are possible, even in healthy users (Allison et al 2010b, Guger et al2009) and in some of the assessed VS (3 out of 4) and MCS (2 out of 3) patients included in our small convenience sample. However, positive Table 3.Results of the permutation test.
Subject Number of trials (after manual rejection) Accuracy based on the cross-validation of SVM classifier p value by per-mutation test VS1 150 0.673 <0.001 VS2 100 0.520 0.338 VS3 90 0.422 0.966 VS4 100 0.500 0.510 MCS1 150 0.653 <0.001 MCS2 100 0.560 0.068 MCS3 100 0.540 0.202 LIS1 150 0.747 <0.001 HC1 150 0.887 <0.001 HC2 150 0.993 <0.001 HC3 150 0.933 <0.001 HC4 150 0.833 <0.001
results do indicate that all such cognitive functions exist in these patients, thus demonstrating their residual awareness.
Several previous studies examining P300 and SSVEP responses partially support our observations. The P300 response has been regarded as reflecting the cognitive potential that is dependent on attention and working memory (Linden 2005). Moreover, the modulation of the P300 response by manipulation of consciousness, such as in sti-mulus masking, attention manipulation, or anesthesia, high-light its possible usefulness as a marker of awareness (Naci et al2012). Although the specific underlying mechanisms of
the SSVEP response are still not fully understood, its dependency to cognitive variables, such as attention, stimulus classification, and memory, has been observed (Muller et al1998, Silberstein et al1995). Both the P300 and SSVEP responses involve sequential activations of cortical networks and rely on higher-order cognitive abilities (Comerchero and Polich1999, Pastor et al2003, Kotchoubey et al2005, Pastor et al 2007, Andersen et al 2011). In this study, the P300 (figure4) and SSVEP responses (figure5) were observed in 2/ 7 DOC patients who failed to show behavioral signs of command following. This observation suggests that these Figure 4.Grand-average P300 ERP waveforms of the‘Fz’ and ‘Pz’ electrodes from 200 pre-stimulus to 1000 ms post-stimulus in runs 1 (upper panels), 2 (middle panels) and 3 (lower panels) for four subjects VS1, MCS1, LIS1, and HC1. The solid red curves containing P300 responses and the dashed blue curves without P300 responses corresponded to the target and non-target photo frames respectively.
patients were able to voluntarily modulate their brain activ-ities, and the evidence provided by EEG led to the conclusion that they possessed residual cognitive function.
One could argue that patients with DOC often lose the ability tofixate their gaze, which is generally necessary for the use of BCIs based on visual P300 and SSVEP responses. However, several studies have described gaze-independent P300- or SSVEP-based BCIs (Brunner et al 2010, Treder et al2011, Lesenfants et al2011, Zhang et al2010), although the classification performances are typically lower for gaze-independent BCIs than for gaze-dependent ones. In the GUI used in this study, we used a few large visual elements instead of many small elements to ease the deployment of covert attention and to improve visual acuity in peripheral vision.
In our previous study (Li et al 2013), we proposed a hybrid BCI combining the P300 and SSVEP responses in healthy subjects. Our present experimental results demon-strate that the combined hybrid BCI achieved better classi fi-cation accuracy than the corresponding separate P300- or SSVEP-based classification. In this study, the hybrid BCI, which was a variant of our previous system (Li et al2013), was successfully used to detect awareness in two patients with DOC and a conscious LIS subject. This study is the first attempt to test a hybrid BCI in this challenging patient population. Our experimental results demonstrated that P300 and SSVEP responses could be elicited and recorded simul-taneously in a clinical setting. Future studies should include the development of a simple‘yes/no’ communication tool for patients with DOC or LIS based on the proposed hybrid BCI system.
Acknowledgments
This study was supported by the National Natural Science Foundation (Grant No. 91120305), National High-Tech R & D Program of China (863 Program, Program No. 2012AA011601), and Program for Changjiang Scholars of China, and High Level Talent Project of Guangdong Province, China, and funding of Science and Technology Department of Zhejiang Province, China (2008C14098).
References
Allison B Z, Brunner C, Kaiser V, Müller-Putz G R, Neuper C and Pfurtscheller G 2010a Toward a hybrid brain–computer interface based on imagined movement and visual attention J. Neural Eng.7 026007
Allison B, Luth T, Valbuena D, Teymourian A, Volosyak I and Graser A 2010b BCI demographics: How many (and what kinds of) people can use an SSVEP BCI? IEEE Trans. Neural Syst. Rehabil. Eng.18 107–16
Andersen S K, Fuchs S and Müller M M 2011 Effects of feature-selective and spatial attention at different stages of visual processing J. Cogn. Neurosci.23 238–46
Andrews K, Murphy L, Munday R and Littlewood C 1996 Misdiagnosis of the vegetative state: retrospective study in a rehabilitation unit Br. Med. J.313 13–16
Bin G, Gao X, Yan Z, Hong B and Gao S 2009 An online multi-channel SSVEP-based brain–computer interface using a canonical correlation analysis method J. Neural Eng.6 046002 Bindemann M, Burton A M, Hooge I T C, Jenkins R and
de Haan E H F 2005 Faces retain attention Psychonomic Bull. Rev.12 1048–53
Figure 5.The average power density spectra of the EEG signals from the eight selected electrodes (‘P7’, ‘P3’, ‘Pz’, ‘P4’, ‘P8’, ‘O1’, ‘Oz’ and
‘O2’) in runs 1 (upper panels), 2 (middle panels) and 3 (lower panels) for four subjects VS1, MCS1, LIS1, and HC1. The red points indicate theflickering frequency of the attended target photo, and the green points indicate the flickering frequency of the non-attended non-target photo. The target frequencies of 6 Hz and 7.5 Hz imply that the target photos appeared in the left and the right of the GUI, respectively.
Brunner P, Joshi S, Briskin S, Wolpaw J R, Bischof H and Schalk G 2010 Does the’P300ʼspeller depend on eye gaze? J. Neural Eng.7 056013
Chatelle C, Chennu S, Noirhomme Q, Cruse D, Owen A M and Laureys S 2012 Brain–computer interfacing in disorders of consciousness Brain Injury26 1510–22
Childs N L, Mercer W N and Childs H W 1993 Accuracy of diagnosis of persistent vegetative state Neurology43 1465 Comerchero M D and Polich J 1999 P3a and P3b from typical
auditory and visual stimuli Clin. Neurophysiol.110 24–30 Coyle D H, Carroll A, Stow J, McCann A, Ally A and McElligott J
2012 Enabling control in the minimally conscious state in a single session with a three channel BCI The 1st Int. DECODER Workshop pp 25–8
Cruse D, Chennu S, Chatelle C, Bekinschtein T A,
Fernández-Espejo D, Pickard J D, Laureys S and Owen A M 2012a Bedside detection of awareness in the vegetative state: a cohort study The Lancet378 2088–94
Cruse D, Chennu S, Fernández-Espejo D, Payne W L,
Young G B and Owen A M 2012b Detecting awareness in the vegetative state: electroencephalographic evidence for attempted movements to command PloS One7 e49933 Di H B, Yu S M, Weng X C, Laureys S, Yu D, Li J Q, Qin P M,
Zhu Y H, Zhang S Z and Chen Y Z 2007 Cerebral response to patientʼs own name in the vegetative and minimally conscious states Neurology68 895–9
Friman O, Volosyak I and Graser A 2007 Multiple channel detection of steady-state visual evoked potentials for brain–computer interfaces IEEE Trans. Biomed. Eng.54 742–50
Giacino J T et al 2002 The minimally conscious state Definition and diagnostic criteria Neurology58 349–53
Giacino J T, Kalmar K and Whyte J 2004 The JFK coma recovery scale-revised: measurement characteristics and diagnostic utility Arch. Phys. Med. Rehabil.85 2020–9
Goldfine A M, Bardin J C, Noirhomme Q, Fins J J, Schiff N D and Victor J D 2013 Reanalysis of“Bedside detection of awareness in the vegetative state: a cohort study” Lancet381 289 Goldfine A M, Victor J D, Conte M M, Bardin J C and Schiff N D
2012 Bedside detection of awareness in the vegetative state The Lancet379 1701–2
Guger C, Daban S, Sellers E, Holzner C, Krausz G, Carabalona R, Gramatica F and Edlinger G 2009 How many people are able to control a P300-based brain–computer interface (BCI)? Neurosci. Lett.462 94–98
Halder S, Rea M, Andreoni R, Nijboer F, Hammer E M, Kleih S C, Birbaumer N and Kübler A 2010 An auditory oddball brain–computer interface for binary choices Clin. Neurophysiol.121 516–23
Jasper H H 1958 The ten twenty electrode system of the international federation Electroencephalogr. Clin. Neurophysiol.10 371–5 Jennett B and Plum F 1972 Persistent vegetative state after brain
damage: a syndrome in search of a name The Lancet299
734–7
Kircher T T J, Senior C, Phillips M L, Benson P J, Bullmore E T, Brammer M, Simmons A, Williams S C R, Bartels M and David A S 2000 Towards a functional neuroanatomy of self processing: effects of faces and words Cogn. Brain Res.10
133–44
Kircher T T J, Senior C, Phillips M L, Rabe-Hesketh S, Benson P J, Bullmore E T, Brammer M, Simmons A, Bartels M and David A S 2001 Recognizing oneʼs own face Cognition78
1–15
Kotchoubey B, Lang S, Mezger G, Schmalohr D, Schneck M, Semmler A, Bostanov V and Birbaumer N 2005 Information processing in severe disorders of consciousness: vegetative state and minimally conscious state Clin. Neurophysiol.116
2441–53
Kübler A and Birbaumer N 2008 Brain–computer interfaces and communication in paralysis: extinction of goal directed
thinking in completely paralysed patients? Clinical Neurophysiol.119 2658–66
Kübler A, Furdea A, Halder S, Hammer E M, Nijboer F and Kotchoubey B 2009 A brain–computer interface controlled auditory event-related potential (P300) spelling system for locked-in patients Ann. New York Acad. Sci.1157 90–100 Lan T, Erdogmus D, Adami A, Pavel M and Mathan S 2006 Salient
EEG channel selection in brain–computer interfaces by mutual information maximization Engineering in Medicine and Biology Society (IEEE-EMBS 2005) 27th Annu. Int. Conf. IEEE pp 7064–7
Laureys S, Perrin F, Faymonville M-E, Schnakers C, Boly M, Bartsch V, Majerus S, Moonen G and Maquet P 2004 Cerebral processing in the minimally conscious state Neurology63
916–8
Lavie N, Ro T and Russell C 2003 The role of perceptual load in processing distractor faces Psychol. Sci.14 510–5
Lesenfants D, Partoune N, Soddu A, Lehembre R, Müller-Putz G, Laureys S and Noirhomme Q 2011 Design of a novel covert SSVEP-based BCI Proc. 5th Int. Brain–Computer Interface Conf. 2011 (Graz: University of Technology Publishing House) pp 1–4
Lewis D and Burke C J 1949 The use and misuse of the chi-square test Psychol. Bull.46 433
Li Y, Pan J, Wang F and Yu Z 2013 A hybrid BCI system combining P300 and SSVEP and its application to wheelchair control IEEE Trans. Biomed. Eng.60 3156–66
Liberati G and Birbaumer N 2012 Using brain–computer interfaces to overcome the extinction of goal-directed thinking in minimally conscious state patients Cogn. Process.13 239–41 Linden D E J 2005 The P300: where in the brain is it produced and
what does it tell us? The Neuroscientist11 563–76 Long J, Li Y, Yu T and Gu Z 2012 Target selection with hybrid
feature for BCI-based 2-D cursor control IEEE Trans. Biomed. Eng.59 132–40
Lulé D et al 2012 Probing command following in patients with disorders of consciousness using a brain–computer interface Clin. Neurophysiol.124 101–6
Monti M M, Vanhaudenhuyse A, Coleman M R, Boly M, Pickard J D, Tshibanda L, Owen A M and Laureys S 2010 Willful modulation of brain activity in disorders of consciousness New Engl. J. Med.362 579–89 Muller M M, Picton T W, Valdes-Sosa P, Riera J,
Teder-Salejarvi W A and Hillyard S A 1998 Effects of spatial selective attention on the steady-state visual evoked potential in the 20-28 Hz range Cogn. Brain Res.6 249–62
Muller-Putz G R, Klobassa D S, Pokorny C, Pichler G, Erlbeck H, Real R G L, Kubler A, Risetti M and Mattia D 2012 The auditory p300-based SSBCI: A door to minimally conscious patients? Engineering in Medicine and Biology Society (EMBC), 2012 Annu. Int. Conf. of the IEEE pp 4672–5 Müller-Putz G R, Pokorny C, Klobassa D S and Horki P 2013 A
single-switch BCI based on passive and imagined movements: toward restoring communication in minimally conscious patients Int. J. Neural Syst.23 1250037
Naci L, Monti M M, Cruse D, Kübler A, Sorger B, Goebel R, Kotchoubey B and Owen A M 2012 Brain–computer interfaces for communication with nonresponsive patients Ann. Neurol.
72 312–23
Noirhomme Q, Lesenfants D, Lehembre R, Lugo Z, Chatelle C, Vanhaudenhuyse A and Laureys S 2013 Detecting consciousness with a brain–computer interface Converging Clinical and Engineering Research on Neurorehabilitation (Berlin: Springer) pp 1261–4
Owen A M, Coleman M R, Boly M, Davis M H, Laureys S and Pickard J D 2006 Detecting awareness in the vegetative state Science313 1402
Owen A M, Menon D K, Johnsrude I S, Bor D, Scott S K, Manly T, Williams E J, Mummery C and Pickard J D 2002 Detecting
residual cognitive function in persistent vegetative state Neurocase8 394–403
Pastor M A, Artieda J, Arbizu J, Valencia M and Masdeu J C 2003 Human cerebral activation during steady-state visual-evoked responses J. Neurosci.23 11621–7
Pastor M A, Valencia M, Artieda J, Alegre M and Masdeu J C 2007 Topography of cortical activation differs for fundamental and harmonic frequencies of the steady-state visual-evoked responses. An EEG and PET H215O study Cerebral Cortex17
1899–905
Perrin F et al 2006 Brain response to oneʼs own name in vegetative state, minimally conscious state, and locked-in syndrome Arch. Neurol.63 562–9
Pfurtscheller G, Allison B Z, Brunner C, Bauernfeind G, Solis-Escalante T, Scherer R, Zander T O, Müller-Putz G, Neuper C and Birbaumer N 2010a The hybrid BCI Front. Neurosci.4 1–11
Pfurtscheller G, Solis-Escalante T, Ortner R, Linortner P and Muller-Putz G R 2010b Self-paced operation of an SSVEP-based orthosis with and without an imagery-SSVEP-based“brain switch” a feasibility study towards a hybrid BCI IEEE Trans. Neural Syst. Rehabil. Eng.18 409–14
Satorra A and Bentler P M 2001 A scaled difference chi-square test statistic for moment structure analysis Psychometrika66
507–14
Schnakers C et al 2008 Voluntary brain processing in disorders of consciousness Neurology71 1614–20
Schnakers C, Vanhaudenhuyse A, Giacino J, Ventura M, Boly M, Majerus S, Moonen G and Laureys S 2009 Diagnostic accuracy of the vegetative and minimally conscious state: clinical consensus versus standardized neurobehavioral assessment BMC Neurol.9 35
Sellers E W, Kubler A and Donchin E 2006 Brain–computer interface research at the University of South Florida Cognitive Psychophysiology Laboratory: the P300 speller IEEE Trans. Neural Syst. Rehabil. Eng.14 221–4
Signorino M, D’Acunto S, Angeleri F and Pietropaoli P 1995 Eliciting P300 in comatose patients The Lancet345 255–6 Silberstein R B et al 1995 Steady-state visually evoked potential
topography during the Wisconsin card sorting test Electroencephalogr. Clin. Neurophysiol.96 24–35
Treder M S, Schmidt N M and Blankertz B 2011 Gaze-independent brain–computer interfaces based on covert attention and feature attention J. Neural Eng.8 066003
Wolpaw J R, Birbaumer N, McFarland D J, Pfurtscheller G and Vaughan T M 2002 Brain–computer interfaces for
communication and control Clin. Neurophysiol.113 767–91 Zhang D, Maye A, Gao X, Hong B, Engel A K and Gao S 2010 An
independent brain–computer interface using covert non-spatial visual selective attention J. Neural Eng.7 016010