INTRODUCTION
Sarcopenia is a progressive and generalized loss of muscle mass and function with advancing age.1,2)
This geriatric syndrome is now considered an increasing public health issue worldwide.3) Sar-copenia is associated with adverse health outcomes such as physi-cal impairment, mobility limitations, increased fall risk, hospital-ization, and mortality.4)
In the last decade, several sarcopenia defi-nitions and proposals for diagnostic criteria have been published. Among these, the revised consensus criteria of the European
Working Group on Sarcopenia in Older People (EWGSOP2) ap-pear to be the most promising. The EWGSOP2 considers sarco-penia to be present when a person presents with both low muscle strength and low muscle mass. Additionally, people with low phys-ical performance are categorized as severely sarcopenic.3)
This condition can also impact patient quality of life. Since this aspect is not straightforward for clinical evaluation, the issue is less studied so far. The existing quality of life questionnaires, such as the Short Form 36 (SF-36) and EuroQoL 5-dimension (EQ-5D), are designed for use in a broad swath of health conditions and
pa-Copyright© 2020 by The Korean Geriatrics Society
This is an open access article distributed under the terms of the Creative Commons Attribution Non-Commercial License (http://creativecommons.org/licenses/by-nc/4.0/) which
Background: The SarQoL, a quality-of-life questionnaire specific to sarcopenia, was developed in 2015 and has since been translated into a number of other languages. The main reason to intro-duce this new Ukrainian version of the questionnaire was to measure sarcopenic individuals’ per-ceptions regarding their positions in life in the context of their culture and value systems. Meth-ods: The questionnaire was translated using a forward-backward approach with a pre-test. A to-tal of 49 participants were recruited for the validation study. Sarcopenia was diagnosed accord-ing to the Ishii test. The validation analyses included discriminative power, internal consistency, floor and ceiling effects, construct validity, and test-retest reliability. We compared the SarQoL questionnaire to the Short-Form 36 and the EuroQoL-5 Dimensions. Results: A total of 28 partic-ipants out of 49 were categorized as probably sarcopenic. They had a significantly lower quality of life (overall score 58.43±17.13 vs. 69.89±13.31; p=0.014). The internal consistency was excel-lent (α=0.898), with none of the domains showing a disproportionate influence on the homoge-neity of the questionnaire. Convergent construct validity was also confirmed. The results indicat-ed a near-perfect degree of test-retest reliability. Conclusions: The first Ukrainian version of the questionnaire is equivalent to the available original English version.
Key Words: Sarcopenia, Quality of life, Translations, Validation study
Cross-sectional Evaluation of the Sarcopenia Quality of Life (SarQoL)
Questionnaire: Translation and Validation of its Psychometric Properties
Marta Dzhus1, Maria Dzhus1, Marta Masnyi2, Myroslava Kulyk1, Halyna Mostbauer1, Oleksiy Ivashkivsky3, Yaryna Boyko4, Kateryna Cherchenko5, Anton Geerinck6,7, Jean-Yves Reginster6,7, Olivier Bruyere6,7, Charlotte Beaudart6,71Department of Internal Medicine, O. Bogomolets National Medical University, Kyiv, Ukraine 2Toronto Catholic District School Board, Toronto, Canada
3Oleksandrivsky Clinical Hospital, Kyiv, Ukraine
4Department of Pediatric, Lviv Regional Specialized Children’s Hospital, Lviv, Ukraine 5Kyiv Clinical Hospital, Kyiv, Ukraine
6Division of Public Health, Epidemiology and Health Economics, University of Liege, Liege, Belgium
7World Health Organization Collaborating Center for Public Health Aspects of Musculoskeletal Health and Aging, University of Liege, Liege, Belgium
pISSN 2508-4798 eISSN 2508-4909 Ann Geriatr Med Res 2020;24(2):139-147 https://doi.org/10.4235/agmr.20.0020
Corresponding Author: Marta Dzhus, PhD, MD Department of Internal Medicine, O. Bogomolets National Medical University, Kyiv, Ukraine E-mail: dzhusm@yahoo.co.uk ORCID: https://orcid.org/0000-0002-7500-8520 Received: April 2, 2020 Revised: April 30, 2020 Accepted: May 13, 2020
tient populations and, thus, do not cover all physical dysfunctions associated with sarcopenia. Consequently, it would be useful to have a specific questionnaire to assess the impact of sarcopenia on quality of life.
The SarQoL questionnaire is the first multidimensional dis-ease-specific questionnaire designed for community-dwelling sar-copenic subjects aged 65 years and older. It comprises 22 questions rated on a 3-, 4-, or 5-point Likert scale. Items are categorized into the following sevens domains of dysfunction: physical and mental health, locomotion, body composition, functionality, activities of daily living, leisure activities, and fears. The questionnaire was ini-tially developed and validated in French in 20155,6) and was later translated and validated into English, Dutch, Romanian, Polish, Hungarian, Russian, and Greek.7-13)
To provide the Ukrainian nation with a qualitative and reliable questionnaire to measure the quality of life of sarcopenic patients, we have created the Ukrainian version of the SarQoL question-naire. The process of translation and validation followed the proto-col for translation provided by the authors of the SarQoL ques-tionnaire, which were based on the recommendations of Beaton et al.14) This protocol included translation, cross-cultural adaptation, and validation of psychometric properties of the questionnaire. This process ensures standardization of the translated versions and makes them valid instruments for clinical purposes.
The objectives of this study were to translate the SarQoL ques-tionnaire from English into Ukrainian and to assess its main psy-chometric properties.
MATERIALS AND METHODS
Ukrainian Translation
The translation was performed by a group of experts to exclude any cultural divergence and ensure the usefulness of the question-naire in different populations. The process of translation from En-glish to Ukrainian and cross-cultural adaptation was performed ac-cording to specific guidelines14) and included five phases: (1) inde-pendent forward translation by two bilingual translators (one of whom had a medical background; the other was a novice regarding the topic of questionnaire), both native Ukrainian speakers; (2) synthesis of the initial translations providing a single “Version 1”; (3) independent backward translations of “Version 1” from Ukrainian to English by two bilingual translators who were native English speakers, had no medical background, and were blind to the original version of the SarQoL questionnaire; (4) comparison of the Version 1 and backward translations by an expert commit-tee, resulting in a pre-final version of the Ukrainian SarQoL ques-tionnaire and a full written report of the issues encountered at each
step; and (5) a test of the pre-final version on 10 sarcopenic sub-jects to ensure understanding of the purpose and meaning of each question, which led to the final version of the SarQoL-UA.
The translation was performed with the permission of the rights holder of the SarQoL questionnaire (SarQoL sprl, Brussel, Bel-gium); the original developers also provided assistance and advice during the translation and validation process. The original devel-opers of the questionnaire (OB and CB) were kept informed of the major choices made during the translation process and the results of the pre-test of the questionnaire and confirmed the equivalence between the English and Ukrainian versions.
Validation
Participants and protocol
A total of 49 patients aged 65 years and older were recruited in Oleksandrivska Clinical Hospital in Kyiv, Ukraine, where large proportions of older and geriatric patients are treated.
All patients were informed about the objective and form of sub-sequent questions and tests before providing their informed con-sent. Patients with severe exacerbations of chronic illnesses, de-compensations of heart failure and diabetes, physical malforma-tions, or traumas associated with decreased mobility, amputamalforma-tions, malignant diseases, and also mental illnesses that prevented under-standing and correct response to the questions were not included in the investigation. The study was approved by the Ethics Com-mittee of Oleksandrivska Clinical Hospital (No. 22/2016). We collected clinical and demographic variables such as age, sex, body mass, height, waist, hip and thigh circumference, muscle strength, and gait speed using standard methods by trained examiners. Due to limited access to dual-energy X-ray absorptiometry (DEXA) equipment, the probability of sarcopenia was determined using the Ishii screening test.15)
The objective of this test is to identify older adults at a high risk of sarcopenia; the test relies on a combination of age, grip strength, and calf circumference. The exact formulas are as follows:
Score in men = 0.62×(age 64 y) – 3.09×(grip strength 50 kg) – 4.64×(calf circumference 42 cm)
Score in women = 0.80×(age 64 y) – 5.09×(grip strength 34 kg) – 3.28×(calf circumference 42 cm)
The established cutoff values that maximize the sum of sensitivi-ty and specificisensitivi-ty are ≥ 105 for men and ≥ 120 for women,3)
with higher scores indicating an increased probability of sarcopenia.
Muscle strength was evaluated based on handgrip strength mea-sured using a manual spring dynamometer (DRP-90, GOST 22224-76, Russia) with a cutoff value of < 20 kg for women and < 30 kg for men. The measurements were performed on both the
patients’ dominant and non-dominant hands, with the highest value recorded. To evaluate physical performance, we used gait speed in the form of the 3-minute timed walk test. The patients were asked to walk at their standard speed and the mean of the meters walked was converted to speed in meters per second (m/s) for analysis. Values < 0.8 m/s indicated poor physical performance.16)
Procedures
Psychometric validation of the Ukrainian version of the SarQoL
Validation of the psychometric properties of the SarQoL-UA con-sisted of an assessment of its discriminative power, internal consis-tency, potential floor and ceiling effects, construct validity, and test-retest reliability, all of which were performed according to the recommendations of Terwee et al.17)
(1) Discriminative power, also called known-groups validity, was evaluated by comparing the QoL scores between participants who were categorized as probably having sarcopenia by the Ishii test and those categorized as probably not having sarcopenia. Ad-ditionally, we examined two components of sarcopenia, grip strength and gait speed, by comparing subjects with low and nor-mal values. The sample was dichotomized using the EWGSOP2 cutoffs (< 27 kg for men and < 16 kg for women for grip strength and ≤ 0.8 m/s for gait speed).3) To assess the discriminative power of the questionnaire, we assumed that the QoL scores should be higher (indicating better QoL) in population categorized as proba-bly non-sarcopenic, or with normal grip strength or gait speed, compared to those categorized as probably sarcopenic or with low grip strength or gait speed.
(2) Internal consistency. To measure internal consistency, un-derstood as an estimation of the questionnaire’s homogeneity, we calculated the Cronbach’s alpha coefficient.18) A coefficient value between 0.7 and 0.9 indicates a high level of internal consistency. By deleting one domain at a time, we also considered the impact of each domain on internal consistency. The correlation of each do-main with the total SarQoL-UA score was also assessed by correla-tion analysis. We defined excellent correlacorrela-tion as r > 0.81, very good correlation as r between 0.61 and 0.80, and good correlation as r between 0.41 and 0.60.
(3) Floor and ceiling effects are present when a high percent-age of the population has the lowest or the highest scores, respec-tively. We considered significant floor and ceiling effects when higher than 15%.
(4) Construct validity. The construct validity of the question-naire indicates whether the questionquestion-naire measures the construct it claims to measures. This was investigated by measuring the con-vergent and dicon-vergent validity; i.e., the level of agreement between
the SarQoL questionnaire and domains of other questionnaires that are theorized to be similar or different. Every patient complet-ed, at the same time as the SarQoL-UA questionnaire, the SF-36v2 and the EQ-5D, two generic QoL questionnaires. The generic SF-36 questionnaire (SF-SF-36v2)19) contains 36 items in eight health domains. Two components of the health survey were calculated: the physical component summary (PCS) and the mental compo-nent summary (MCS), providing reliable and valid summaries of a patient’s physical and mental status. The total raw score computed for each health domain scale was calculated, in which 0 and 100 points indicated the worst and best QoL, respectively.20)
For the evaluation of overall self-rated health status, we used the EQ-5D questionnaire,21) which includes five domains: mobility, usual activities, self-care, pain/discomfort, and anxiety/depression, as well as the EQ Visual Analogue Scale (EQ-VAS).22)
Each of the five dimensions comprising the EQ-5D was divided into five levels of perceived impairment, from level 1 (no problem) to level 5 (ex-treme problems). A unique health state was defined by combining the reported level from each of the five dimensions and referring the result to a five-digit code that was subsequently converted to a single index value (EQ-5D index value).23)
For convergent construct validity, we hypothesized strong cor-relations between the overall QoL SarQoL score and the mobility and usual activities questions of the EQ-5D, as well as with the SF-36 PCS and the EQ-VAS. For divergent construct validity, we ex-pected to find weak or non-existent correlations between the over-all QoL SarQoL score and the self-care, pain/discomfort, and anx-iety/depression questions of the EQ-5D, as well as the SF-36 MCS.
(5) Test-retest reliability. The test-retest reliability of the ques-tionnaire, defined as the degree to which the questionnaire pro-duces the same results in identical circumstances over time, was evaluated by intra-class correlation coefficient (ICC). To analyze the test-retest stability of our Ukrainian version of the SarQoL, participants who did not report any significant health change over a 2-week period were asked to complete the questionnaire again after a 2-week interval. The reliability was considered acceptable for ICC> 0.7.
Statistical Analysis
The distribution of quantitative variables was assessed using Shap-iro-Wilk tests. Quantitative variables with a normal distribution are expressed as mean± standard deviation, and quantitative variables with non-normal distributions are expressed as medians (P25– P75) and categorical variables are reported as absolute (n) and rel-ative frequencies (%). Results were considered statistically signifi-cant at the 5% critical level (p< 0.05).
Differences in characteristics between groups were tested using the parametric Student t-test or the non-parametric Mann-Whit-ney U-test for quantitative variables and chi-square tests for nomi-nal variables. For internomi-nal consistency, the Cronbach's alpha coeffi-cient was calculated. The correlation of each domain with the total score of the SarQoL-UA was determined using Pearson or Spear-man correlations based on the distribution of the variables. The evaluation of the construct validity also used Pearson or Spearman correlations. The test-retest reliability was assessed using ICC (two-way mixed-absolute agreement). All of the analyses were per-formed using IBM SPPS Statistics version 25.0.0.0 for Windows (IBM, Armonk, NY, USA).
RESULTS
Translation
No major conceptual discrepancies were observed between trans-lations and all differences were resolved by consensus. We reached out to CB and OB for clarification on the content of certain ques-tions, to make sure that the translated questions were conceptually equivalent to the questions in English. The 22 questions of the SarQoL questionnaire were translated without any major difficul-ties. Certain adaptions were made to optimize the questionnaire for the cultural context of Ukraine, such as discussion regarding the forward translation of the words “light” (in question 3) and “moderate” (in question 4), “frail” (in question 16) and “do it your-self (DIY)” (in question 3), which were solved in the initial transla-tors’ meeting. A pretest in the third and prefinal version was per-formed on 20 participants.
The pre-test did not reveal problems in the comprehensibility of the questions in the questionnaire or the language used therein.
Sample Characteristics
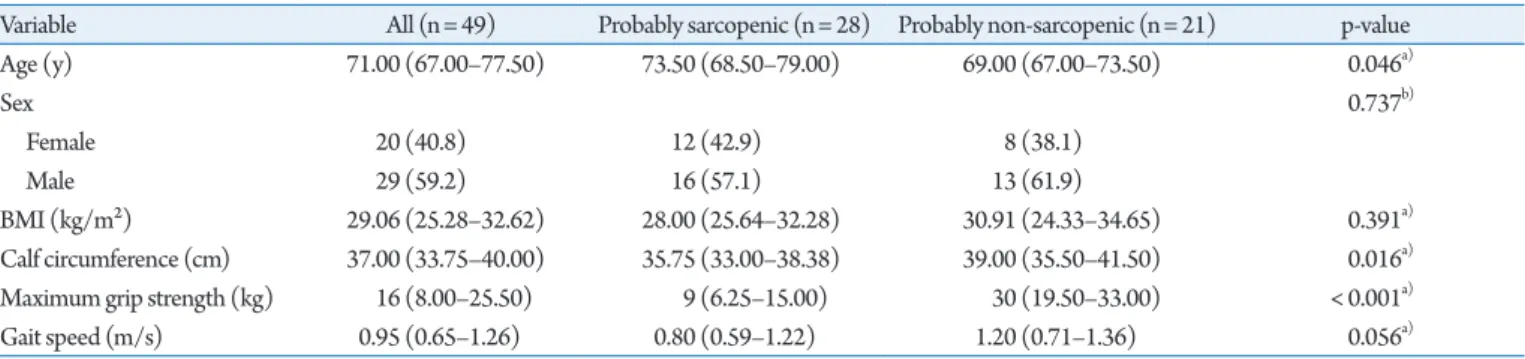
In the study population, median age was 71 years (range, 67.0-75.5 years) (Table 1), including 29 (59.2%) men and 20 (40.8%) wom-en. The study population were overweight, with a median body mass index of 29.06 kg/m2 (range, 25.28–32.62 kg/m2).
We observed that both male and female participants had low grip strength, as evidenced by the fact that 70% of the female sub-jects and 65.5% of male subsub-jects had low maximum grip strengths according to the EWGSOP2 cutoffs. For physical performance, represented by gait speed, we observed a mean value of 0.95± 0.37 m/s, well above the ≥ 0.8 m/s threshold used by the EWGSOP2 to indicate low gait speed.
We divided the patients into two groups according to the proba-ble presence or absence of sarcopenia, as indicated by Ishii test re-sults. A total of 28 and 21 people were probably sarcopenic and probably non-sarcopenic, respectively. As expected, age, grip strength, and calf circumference differed between the two groups. Although the median gait speed was considerably higher is the probably non-sarcopenic group (1.2 vs. 0.8 m/s), the difference was not significant (p= 0.056).
Validation Analyses
Discriminative power
The discriminative power was examined by comparing the quality of life scores between the people classified as probably and proba-bly non-sarcopenic according to the Ishii screening test (Table 2).
Additionally, a discriminative power analysis was also performed by dichotomizing the people by grip strength (men < 27 kg; wom-en < 16 kg) and gait speed (≥ 0.8 m/s).
Categorization of the patients into probably and probably non-sarcopenic according to the Ishii test showed significantly
Table 1. Clinical characteristics of the patients
Variable All (n= 49) Probably sarcopenic (n= 28) Probably non-sarcopenic (n= 21) p-value Age (y) 71.00 (67.00–77.50) 73.50 (68.50–79.00) 69.00 (67.00–73.50) 0.046a) Sex 0.737b) Female 20 (40.8) 12 (42.9) 8 (38.1) Male 29 (59.2) 16 (57.1) 13 (61.9) BMI (kg/m²) 29.06 (25.28–32.62) 28.00 (25.64–32.28) 30.91 (24.33–34.65) 0.391a) Calf circumference (cm) 37.00 (33.75–40.00) 35.75 (33.00–38.38) 39.00 (35.50–41.50) 0.016a)
Maximum grip strength (kg) 16 (8.00–25.50) 9 (6.25–15.00) 30 (19.50–33.00) < 0.001a)
Gait speed (m/s) 0.95 (0.65–1.26) 0.80 (0.59–1.22) 1.20 (0.71–1.36) 0.056a)
Values are presented as median (25th percentile–75th percentile) or number (%). BMI, body mass index.
a)Mann–Whitney U-test. b)Chi-square test.
lower quality of life scores for five of the seven of the domain scores, as well as the overall QoL sscore (58.43 ± 17.13 vs. 69.89± 13.31 points; p= 0.014).
In contrast, no significant differences were found for the SF-36 PCS and MCS summary scores, as well as for the EQ-VAS. Exam-ination of the individual questions of the EQ-5D showed that par-ticipants in the probably sarcopenic group scored higher on the pain/discomfort item, indicating more pain/discomfort and thus worse QoL—3 (2–3) vs. 2 (1–3); p= 0.032. The other EQ-5D items did not differ significantly between the two groups.
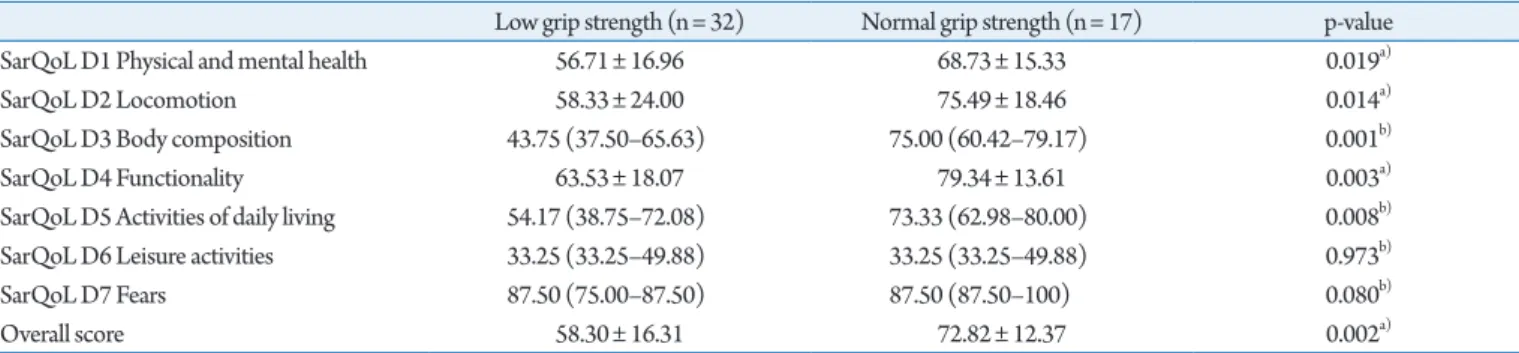
We observed that people with low grip strength or low gait speed generally showed lower quality of life scores on the SarQoL
ques-tionnaire, except for domains 6 and 7. Crucially, the overall QoL score was significantly lower for people with low grip strength (56.71±16.96 vs. 68.73±15.33 points; p=0.0169) and people with low gait speed (49.93±12.23 vs. 73.40±11.29; p<0.001). The re-sults for all domains are reported in Tables 3 and 4.
Internal Consistency
Cronbach’s alpha coefficient
The complete questionnaire showed an alpha of 0.898; the value within the 0.7–0.9 threshold indicated adequate internal consis-tency with a low risk of redundancy in the questionnaire. Deletions
Table 2. Quality of life characteristics
Variable All (N= 49) Probably sarcopenic (n= 28) Probably non-sarcopenic (n= 21) p-value SarQoL D1 Physical and mental health 59.97 (47.20–72.75) 56.72± 16.63 66.43± 16.85 0.050a)
SarQoL D2 Locomotion 66.67 (47.22–86.11) 56.95 (33.34–87.50) 72.22 (58.33–87.50) 0.069b)
SarQoL D3 Body composition 58.33 (41.67–75.00) 43.75 (37.50–66.67) 66.67 (56.25–75.00) 0.010b)
SarQoL D4 Functionality 71.15 (49.04–85.17) 62.85± 18.61 77.24± 14.18 0.005a)
SarQoL D5 Activities of daily living 61.67 (43.10–76.67) 55.15± 19.84 66.18± 16.14 0.043a)
SarQoL D6 Leisure activities 33.25 (33.25–49.88) 41.57 (33.25–49.88) 33.25 (33.25–49.88) 0.366b)
SarQoL D7 Fears 87.50 (75.00–100) 87.50 (75.00–87.50) 87.50 (87.50–100) 0.016b)
SarQoL Overall QoL 63.72 (45.96–79.24) 58.43± 17.13 69.89± 13.31 0.014a)
SF-36 PCS 36.00 (27.00–43.50) 34.14± 10.85 38.19± 8.94 0.171a)
SF-36 MCS 47.40 (39.93–53.78) 48.17± 10.28 44.36± 9.67 0.194a)
EQ-5D Mobility 2 (1–3) 2 (1.25–3) 2 (1–2) 0.092b)
EQ-5D Self-care 1 (1–2) 1 (1–2) 1 (1–1) 0.211b)
EQ-5D Usual activities 2 (1–3) 2 (1–3) 1 (1–2) 0.137b)
EQ-5D Pain/discomfort 2 (2–3) 3 (2–3) 2 (1–3) 0.032b)
EQ-5D Anxiety/depression 2 (1–2) 2 (1–2) 1 (1–3) 0.870b)
EQ-VAS 50 (50.00–65.00) 50 (46.25–65.00) 55 (50.00–65.00) 0.592b)
Values are presented as median (25th percentile–75th percentile) or mean±standard deviation.
EQ-5D, EuroQoL 5-dimension; PCS, physical component summary; MCS, mental component summary; VAS, visual analog scale.
a)Student t-test. b)Mann–Whitney U-test.
Table 3. Discriminative power for grip strength
Low grip strength (n= 32) Normal grip strength (n= 17) p-value SarQoL D1 Physical and mental health 56.71± 16.96 68.73± 15.33 0.019a)
SarQoL D2 Locomotion 58.33± 24.00 75.49± 18.46 0.014a)
SarQoL D3 Body composition 43.75 (37.50–65.63) 75.00 (60.42–79.17) 0.001b)
SarQoL D4 Functionality 63.53± 18.07 79.34± 13.61 0.003a)
SarQoL D5 Activities of daily living 54.17 (38.75–72.08) 73.33 (62.98–80.00) 0.008b)
SarQoL D6 Leisure activities 33.25 (33.25–49.88) 33.25 (33.25–49.88) 0.973b)
SarQoL D7 Fears 87.50 (75.00–87.50) 87.50 (87.50–100) 0.080b)
Overall score 58.30± 16.31 72.82± 12.37 0.002a)
Values are presented as mean±standard deviation or median (25th percentile–75th percentile).
a)Student t-test for independent samples. b)Mann–Whitney U-test.
of single domains showed Cronbach’s alpha values ranging from 0.861 to 0.912, indicating that no domain had a disproportionate influence on the homogeneity of the questionnaire (Table 5).
Correlations between overall and individual domain scores
The correlations between each domain and the total score of the SarQoL questionnaire were also assessed using Spearman coeffi-cients. All domains showed a strong significant positive correlation with the overall score of the SarQoL, except for domain 6 (Table 5).
Floor and Ceiling Effects
No participants (n= 49) presented with the lowest score to the questionnaire (0 points) or the maximal score (100 points) on the Overall QoL score. A ceiling effect was present for domain 7, where 14 people (28.6%) scored 100 points.
Construct Validity
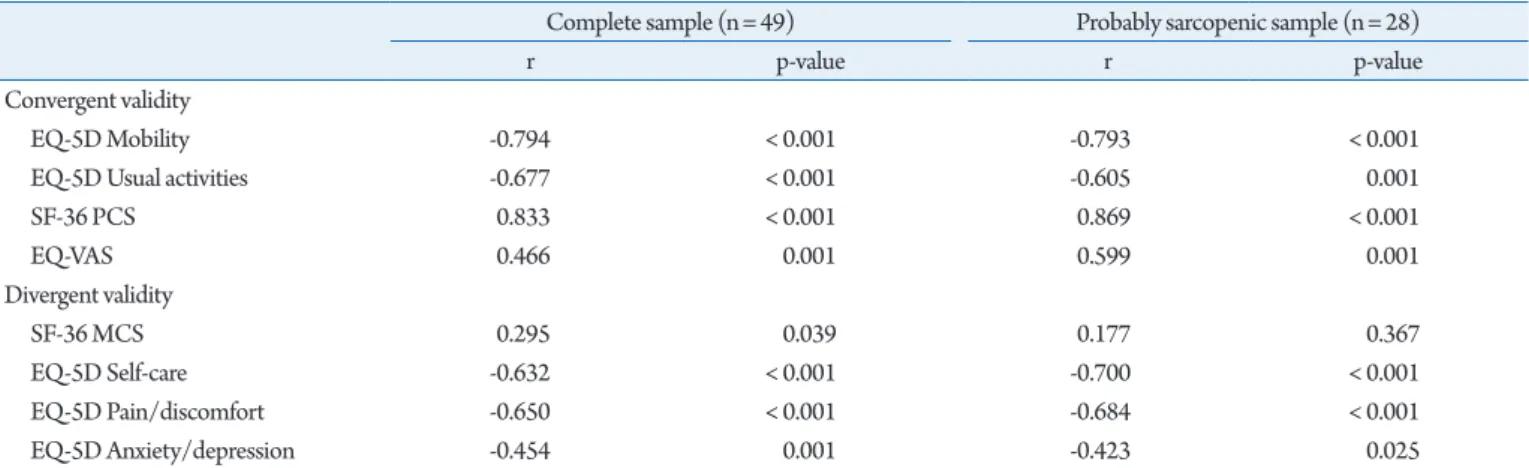
Assessment of the convergent validity in the complete sample showed three strong and significant and one moderate and signifi-cant correlation, confirming the convergent validity of the Ukrainian SarQoL questionnaire (Table 6). Assessment of the di-vergent validity showed two strong and one moderate correlation (Table 6).
Analysis of the 28 participants categorized as probably sarcope-nic showed good convergent validity, with four strong correlations but inadequate divergent construct validity.
Test-Retest Reliability
The test-retest reliability indicated near-perfect results (Table 7), with an ICCs of 0.997 (0.994–0.998) for the overall quality of life score of the SarQoL questionnaire in the complete sample and 0.998 (0.995–0.999) in the probably-sarcopenic group. The low-est ICC was observed in the analysis of the probably-sarcopenic
sample, in which domain 6 showed an ICC of 0.912 (0.821– 0.958), still considered to be an excellent degree of test-retest reli-ability.
The rest-retest reliabilities of the SF36 PCS and MCS scores were of the same order as that of the SarQoL (ICC > 0.9) and slightly lower in the EQ-VAS (ICC= 0.829 for the complete sam-ple and 0.876 in the probably-sarcopenic samsam-ple). However, the test-retest reliability of the EQ-VAS in this sample was still consid-ered acceptable, as it was above the cutoff of 0.7.
DISCUSSION
The results of our study showed that the Ukrainian version of the original SarQoL is a valid and discriminant questionnaire that is useful to determine the quality of life of patients with sarcopenia. The SarQoL is the first quality of life questionnaire specific to sar-copenia available in the Ukrainian language. The population of Ukraine is 43 million, of whom 6.9 million (15.32%) are aged over 65 years;24)
thus, the SarQoL-UA questionnaire can be a reliable, and cost-effective tool for assessing QoL among older Ukrainian patients possibly affected by sarcopenia.
Because of the cost and complexity of measuring muscle mass using a DEXA instrument, we used the Ishii screening test16)
to screen patients for sarcopenia, which is much easier, faster, and cheaper and does require a specific apparatus. The Ishii test has ex-cellent sensitivity and specificity compared with to other diagnos-tic definitions of sarcopenia such as the two-step algorithm of the EWGSOP, the SARC-F questionnaire, the screening grid, and the anthropometric prediction equation.15) We observed that people with low grip strength or gait speed generally showed lower quality of life scores on the SarQoL questionnaire (except for domains 6 and 7), which might be because these domains have low numbers of items (and thus less precision) in combination with a relatively
Table 4. Discriminative power for gait speed
Low gait speed (n= 21) Normal gait speed (n= 28) p-value SarQoL D1 Physical and mental health 51.04± 12.18 68.27± 16.94 < 0.001a)
SarQoL D2 Locomotion 44.44 (27.78–62.50) 79.17 (63.89–94.44) < 0.001b)
SarQoL D3 Body composition 41.67 (35.42–54.17) 72.92 (58.33–83.33) < 0.001b)
SarQoL D4 Functionality 56.07± 16.25 78.72± 12.80 < 0.001a)
SarQoL D5 Activities of daily living 43.33 (35.42–54.17) 75.00 (65.00–80.00) < 0.001b)
SarQoL D6 Leisure activities 33.25 (24.94–49.88) 41.57 (33.25–49.88) 0.081b)
SarQoL D7 Fears 87.50 (75.00–87.50) 87.50 (78.13–100) 0.084b)
Overall score 49.93± 12.23 73.40± 11.29 < 0.001a)
Values are presented as mean±standard deviation or median (25th percentile–75th percentile).
a)Student t-test for independent samples. b)Mann–Whitney U-test.
Table 5. Correlations between overall and domain scores and Cronbach’s alpha
Correlations between overall and domain scores (n= 48) Cronbach’s alpha if domain
deleted (n= 49) Overall Cronbach’s alpha
r p-value
SarQoL D1 Physical and mental health 0.848 < 0.001 0.872 0.898
SarQoL D2 Locomotion 0.911 < 0.001 0.874
SarQoL D3 Body composition 0.779 < 0.001 0.874
SarQoL D4 Functionality 0.915 < 0.001 0.861
SarQoL D5 Activities of daily living 0.880 < 0.001 0.875
SarQoL D6 Leisure activities 0.389 0.006 0.912
SarQoL D7 Fears 0.587 < 0.001 0.901
All values are Spearman correlation coefficients.
Table 6. Convergent and divergent construct validity, and correlation with overall SarQoL score
Complete sample (n= 49) Probably sarcopenic sample (n= 28)
r p-value r p-value
Convergent validity
EQ-5D Mobility -0.794 < 0.001 -0.793 < 0.001
EQ-5D Usual activities -0.677 < 0.001 -0.605 0.001
SF-36 PCS 0.833 < 0.001 0.869 < 0.001 EQ-VAS 0.466 0.001 0.599 0.001 Divergent validity SF-36 MCS 0.295 0.039 0.177 0.367 EQ-5D Self-care -0.632 < 0.001 -0.700 < 0.001 EQ-5D Pain/discomfort -0.650 < 0.001 -0.684 < 0.001 EQ-5D Anxiety/depression -0.454 0.001 -0.423 0.025
All correlation coefficients obtained using Spearman method.
EQ-5D, EuroQoL 5-dimension; PCS, physical component summary; MCS, mental component summary; VAS, visual analog scale.
Table 7. Test-retest reliability in the complete sample
Complete sample (n= 50) Probably sarcopenic sample (n= 28)
ICC 95% CI ICC 95% CI
SarQoL D1 Physical and mental
health 0.992 0.985–0.995 0.991 0.980–0.996
SarQoL D2 Locomotion 0.995 0.990–0.997 0.994 0.988–0.997
SarQoL D3 Body composition 0.990 0.982–0.994 0.996 0.991–0.998
SarQoL D4 Functionality 0.986 0.976–0.992 0.994 0.988–0.997
SarQoL D5 Activities of daily living 0.995 0.991–0.997 0.995 0.990–0.998
SarQoL D6 Leisure activities 0.950 0.913–0.971 0.912 0.821–0.958
SarQoL D7 Fears 0.933 0.884–0.961 0.897 0.791–0.951
SarQol Overall score 0.997 0.994–0.998 0.998 0.995–0.999
SF-36 PCS 0.966 0.940–0.980 0.970 0.937–0.986
SF-36 MCS 0.905 0.838–0.945 0.940 0.876–0.972
EQ-VAS 0.829 0.714–0.948 0.876 0.749–0.941
ICC, intra-class correlation coefficient; CI, confidence interval; PCS, physical component summary; MCS, mental component summary; VAS, visual analog scale.
low number of study population.
Similar publications of validations of the SarQoL are available for the English, French, Dutch, Romanian, Polish, Lithuanian, Greek, and other language versions,7-10,13,25) with similar results in terms of the reliability and validity of the SarQoL questionnaire.
The Cronbach’s alpha of the Ukrainian version of the SarQoL was 0.898. The recommended values are 0.7–0.9, with an upper limit of 0.95.17,26) The Cronbach’s alpha value in our study is similar to those reported for the French, English, and Dutch versions (0.87, 0.88, and 0.883, respectively).5,7,8)
The alpha value in our study was lower than those in the Greek, Lithuanian, Romanian, and Polish validation studies (0.960, 0.950, 0.946, and 0.920, re-spectively) suggesting that some questions in the SarQoL may be redundant.9,10,13,25)
However, although the internal consistency of the Ukrainian was excellent, this does not mean that cross-cultural effects are, therefore, excluded. Although we paid particular atten-tion to cross-cultural equivalence, Ukrainian participants may have responded differently to certain questions. We hope that the data from this study and future data collected with the SarQoL-UA can be used in combination with data from other countries to analyze the questionnaire with Item Response Theory to detect any differ-ential item functioning effects.
Test-retest reliability was excellent in our study and the same as reported in French, English, Dutch, Polish, Greek and Lithuanian studies.6-8,10,13,25)
The validation of the Romanian version did not perform test-retest reliability because of the limited number of sar-copenic subjects (n= 13). Overall, the results have indicated that the SarQoL questionnaire is a reliable instrument.25)
The construct validity of the SarQoL-UA was examined with eight hypotheses on the correlation between the domains of the SF-36 and EQ-5D questionnaires that were theorized to measure a similar (convergent) or dissimilar (divergent) construct from that of the SarQoL-UA. The results showed that the questionnaire possessed good convergent validity; however, the results of the di-vergent validity were not as expected. It may be that the constructs represented in the SF-36 MCS and the self-care and pain/discom-fort items of the EQ-5D are more closely aligned with the overall quality of life, the construct measured by the SarQoL-UA.
The major limitation of our study was related to the absence of a muscle mass assessment because we were not able to determine appendicular muscle mass using DEXA. In our study group, sarco-penia status was estimated using the Ishii equation (described above). However, anthropometric measurements are prone to er-rors and may produce pitfalls; thus, they are not recommended for routine use according to the EWGSOP.3)
Nevertheless, the equa-tion provided by Ishii et al. for the estimaequa-tion of sarcopenia was previously validated and showed a high level of corresponding
sen-sitivity, specificity, positive and negative predictive values, and pos-itive and negative likelihood ratios (84.9%, 88.2%, 54.4% and 97.2%, and 7.19 and 0.17 for men and 75.5%, 92.0%, 72.8% and 93.0%, and 9.44 and 0.27 for women, respectively).16) A second possible limitation was the low number of participants. Although there are no fixed requirements for minimum sample size in valida-tion studies, a commonly used benchmark is a sample of 100 par-ticipants, of whom 50 should have the condition in question.17) The present study included a total of 49 participants, 28 of whom were probably sarcopenic based on the Ishii test; however, because of the relative precision of the obtained values (i.e., small standard deviations or 95% confidence intervals), we obtained statistically significant results in most if not all of our analyses. While this study falls short of the arbitrary sample size of 100 participants, the re-sults should not be discounted given the significant p-values ob-tained throughout.
In summary, this first Ukrainian version of the SarQoL ques-tionnaire is equivalent to the available original version. Thus, this tool may be used for clinical and research purposes. This question-naire had higher sensitivity than that of other standard QoL ques-tionnaires. The availability of the SarQoL questionnaire to the Ukrainian scientific community gives physicians speaking this lan-guage the chance to better follow and monitor sarcopenic patients in Ukraine. Thus, the Ukrainian version of SarQol may be poten-tially incorporated in the routine geriatric curriculum designated for the assessment of sarcopenic Ukrainian-speaking individuals.
ACKNOWLEDGEMENTS
We thank Pr. JY Reginster, Pr. O Bruyère, and Pr. C Beaudart for their permission to adapt the questionnaire to a Ukrainian setting and for their help and advice during this process.
CONFLICT OF INTEREST
OB, JYR, and CB are shareholders of SarQoL sprl. The authors declare no conflict of interest. The study was conducted in the ab-sence of any financial or other relationships that could be con-strued as a potential conflict of interest.
AUTHOR CONTRIBUTIONS
Conceptualization, JYR; Methodology, MD, CB, OB; Validation, MD-Jr, KCh, MK, MM, and HM; Formal analysis, MB, AG; In-vestigation, ET, LM, MD; Resources: OB, JYR; Data curation: MD-Jr, KG; Writing-original draft, MD; Writing-review and edit-ing, MD, CB; Supervision, OB, JYR, CB.
REFERENCES
1. Cooper C, Dere W, Evans W, Kanis JA, Rizzoli R, Sayer AA, et al. Frailty and sarcopenia: definitions and outcome parameters. Osteoporos Int 2012;23:1839-48.
2. Baumgartner RN, Koehler KM, Gallagher D, Romero L, Heymsfield SB, Ross RR, et al. Epidemiology of sarcopenia among the elderly in New Mexico. Am J Epidemiol 1998;147: 755-63.
3. Cruz-Jentoft AJ, Bahat G, Bauer J, Boirie Y, Bruyere O, Ceder-holm T, et al. Sarcopenia: revised European consensus on defini-tion and diagnosis. Age Ageing 2019;48:16-31.
4. Janssen I. Influence of sarcopenia on the development of physi-cal disability: the cardiovascular health study. J Am Geriatr Soc 2006;54:56-62.
5. Beaudart C, Biver E, Reginster JY, Rizzoli R, Rolland Y, Baut-mans I, et al. Development of a self-administrated quality of life questionnaire for sarcopenia in elderly subjects: the SarQoL. Age Ageing 2015;44:960-6.
6. Beaudart C, Biver E, Reginster JY, Rizzoli R, Rolland Y, Baut-mans I, et al. Validation of the SarQoL, a specific health-related quality of life questionnaire for Sarcopenia. J Cachexia Sarcope-nia Muscle 2017;8:238-44.
7. Beaudart C, Edwards M, Moss C, Reginster JY, Moon R, Par-sons C, et al. English translation and validation of the SarQoL, a quality of life questionnaire specific for sarcopenia. Age Ageing 2017;46:271-6.
8. Geerinck A, Scheppers A, Beaudart C, Bruyere O, Vanden-bussche W, Bautmans R, et al. Translation and validation of the Dutch SarQoL, a quality of life questionnaire specific to sarcope-nia. J Musculoskelet Neuronal Interact 2018;18:463-72.
9. Gasparik AI, Mihai G, Beaudart C, Bruyere O, Pop RM, Regin-ster JY, et al. Psychometric performance of the Romanian ver-sion of the SarQoL®, a health-related quality of life questionnaire for sarcopenia. Arch Osteoporos 2017;12:103.
10. Konstantynowicz J, Abramowicz P, Glinkowski W, Taranta E, Marcinowicz L, Dymitrowicz M, Reginster JY, Bruyere O, Beaudart C. Polish Validation of the SarQoL, a Quality of Life Questionnaire Specific to Sarcopenia. J Clin Med 2018;7:323.
11. Hodinka L, Vereckei E, Gasparik AI. Sarcopenia and quality of life: the validated Hungarian translation of the Sarcopenia Quali-ty of Life (SarQoL) questionnaire. Orv Hetil 2018;159:1483-6.
12. Safonova YA, Lesnyak OM, Baranova IA, Suleimanova AK, Zot-kin EG. Russian translation and validation of SarQoL – quality of life questionnaire for patients with sarcopenia. Rheumatol Sci Pract 2019;57:38-45.
13. Tsekoura M, Billis E, Gliatis J, Tsepis E, Matzaroglou C, Sakkas
GK, et al. Cross cultural adaptation of the Greek sarcopenia quality of life (SarQoL) questionnaire. Disabil Rehabil 2020;42:1006-12.
14. Beaton DE, Bombardier C, Guillemin F, Ferraz MB. Guidelines for the process of cross-cultural adaptation of self-report mea-sures. Spine (Phila Pa 1976) 2000;25:3186-91.
15. Locquet M, Beaudart C, Reginster JY, Petermans J, Bruyere O. Comparison of the performance of five screening methods for sarcopenia. Clin Epidemiol 2017;10:71-82.
16. Ishii S, Tanaka T, Shibasaki K, Ouchi Y, Kikutani T, Higashiguchi T, et al. Development of a simple screening test for sarcopenia in older adults. Geriatr Gerontol Int 2014;14 Suppl 1:93-101.
17. Terwee CB, Bot SD, de Boer MR, van der Windt DA, Knol DL, Dekker J, et al. Quality criteria were proposed for measurement properties of health status questionnaires. J Clin Epidemiol 2007;60:34-42.
18. Cronbach LJ. Coefficient alpha and the internal structure of tests. Psychometrika 1951;16:297-334.
19. Syddall HE, Martin HJ, Harwood RH, Cooper C, Aihie Sayer A. The SF-36: a simple, effective measure of mobility-disability for epidemiological studies. J Nutr Health Aging 2009;13:57-62.
20. Feshchenko YI, Mostovoy YM, Babiychuk YV. The procedure of adaptation of international quality of life questionnaire MOS SF-36 in Ukraine: the experience of administration in asthma pa-tients. Ukrainian Pulm Mag 2002;3:9-11.
21. Rabin R, de Charro F. EQ-5D: a measure of health status from the EuroQol Group. Ann Med 2001;33:337-43.
22. Herdman M, Gudex C, Lloyd A, Janssen M, Kind P, Parkin D, et al. Development and preliminary testing of the new five-level version of EQ-5D (EQ-5D-5L). Qual Life Res 2011;20:1727-36.
23. EuroQol Group. EQ-5D-5L: Ukrainian version for Ukraine [In-ternet]. Rotterdam, The Netherlands: EuroQol Group; c2010 [cited 2020 May 23]. Available from: https://cumming.ucalgary. ca/sites/default/files/teams/122/research/ESCAPE-NA1/ pdf_ukraine-ukrainian-eq-5d-5l-paper-self-complete-v1.0.pdf. 24. State Statistics Service of Ukraine. Population statistics of
Ukraine [Internet]. Kyiv, Ukraine: State Statistics Service of Ukraine; c2019 [cited 2020 May 23]. Available from: http://da- tabase.ukrcensus.gov.ua/Mult/Database/Population/database-tree_uk.asp.
25. Alekna V, Kilaite J, Tamulaitiene M, Geerinck A, Mastaviciute A, Bruyere O, et al. Validation of the Lithuanian version of sarcope-nia-specific quality of life questionnaire (SarQoL). Eur Geriatr Med 2019;10:761-7.
26. Tavakol M, Dennick R. Making sense of Cronbach's alpha. Int J Med Educ 2011;2:53-5.