HAL Id: hal-01760283
https://hal.archives-ouvertes.fr/hal-01760283
Submitted on 5 Mar 2019
HAL is a multi-disciplinary open access
archive for the deposit and dissemination of
sci-entific research documents, whether they are
pub-lished or not. The documents may come from
teaching and research institutions in France or
abroad, or from public or private research centers.
L’archive ouverte pluridisciplinaire HAL, est
destinée au dépôt et à la diffusion de documents
scientifiques de niveau recherche, publiés ou non,
émanant des établissements d’enseignement et de
recherche français ou étrangers, des laboratoires
publics ou privés.
A ray tracing method to simulate the infrared heating of
semi-transparent thermoplastics
Maxime Bordival, Fabrice Schmidt, Yannick Le Maoult, Benoît Cosson, B.
Plantamura
To cite this version:
Maxime Bordival, Fabrice Schmidt, Yannick Le Maoult, Benoît Cosson, B. Plantamura. A ray tracing
method to simulate the infrared heating of semi-transparent thermoplastics. ESAFORM 2010 -13th
International ESAFORM conference on material forming, Apr 2010, Brescia, Italy. 4 p. �hal-01760283�
____________________
* M. Bordival: ICA/ALBI, Campus Jarlard 81000 Albi – France, +33-563493085, Fax: +33-563493242, bordival@mines-albi.fr
A RAY TRACING METHOD TO SIMULATE THE INFRARED HEATING
OF SEMI-TRANSPARENT THERMOPLASTICS
M. Bordival
1,2*, F.M. Schmidt
1,2, Y. Le Maoult
1,2, B. Cosson
31
Université de Toulouse ; INSA, UPS, Mines Albi, ISAE ; ICA (Institut
Clément Ader) ; F-81013 Albi cedex 09, France – bordival@mines-albi.fr
2
Ecole Mines Albi ; Campus Jarlard, F-81013 Albi, France
3
Ecole des Mines de Douai – France – cosson@ensm-douai.fr
ABSTRACT: This paper focuses on describing RAYHEAT, a software based on the ray tracing method, developed in
order to simulate the InfraRed (IR) heating of semi-transparent polymers. In this study, RAYHEAT is used to simulate the IR heating step of a PET preform for the Injection Stretch-Blow Moulding (ISBM) process. The general principle of the method is to discretize, into a set of rays, the radiative heat flux emitted by halogen lamps, then to follow these rays inside the oven while they are not fully absorbed. The ray tracer computes the optical path of each ray - accounting for specular or diffuse reflections, refractions, etc… - from its emission point, and throughout the preform thickness. PET is assumed to behave like a non-scattering cold medium. Thus, the radiative heat flux absorption inside the preform is computed according to the Beer-Lambert law. Finally, the distribution of the radiative source term is calculated in the preform. In a second step, the radiative source term is applied as an input data in the commercial finite element software ABAQUS®, in order to calculate the 3D temperature distribution in the preform. The source term is assumed to be time dependent in order to account for the preform movement throughout the IR oven. This method provides relatively small computation times, while keeping the memory requirements down to a minimum. Numerical results have been compared with temperature measurements performed on an in-lab IR oven. The model simulates suitably the infrared heating stage, and provides accurate predictions of the temperature distribution in the preform. The relative error between the temperature calculated by RAYHEAT, and the measured temperature, is less than 5%.
KEYWORDS: Ray Tracing, Heat transfer modelling, Injection stretch blow moulding, Infrared heating, PET
1
INTRODUCTION
A large part of bottles intended to beverage market is manufactured using one-step Injection Stretch-Blow Moulding (ISBM) process. ISBM involves an InfraRed (IR) heating stage to condition the PET preform to the appropriate temperature distribution (around 100°C). Then, the preform is stretched-blown inside a mould to get the final bottle. The heating conditions, which control the preform temperature distribution, strongly affect the final properties of the bottle (mechanical, optical and barrier properties).
Within the last ten years, significant researches have been carried out on the simulation of the IR heating stage. A recent literature review on this subject has been presented by Bordival et al. [1]. PET behaves like a semi-transparent body over the IR spectral range, resulting in major challenges with regard to radiative heat transfers modelling. Different approaches are presented in the literature in order to compute the radiative absorption through the preform thickness. The most classical is the view factors method [2,3,4]. This method consists in calculating the radiation on the
preform outside surface, and then to assume that the radiative heat flux is unidirectional through the preform thickness. More recent works investigated the efficiency of the zone method [5] or the ray tracing method [6]. The last one presents the advantage to account for a while variety of optical effects, such as specular reflection or refraction. In addition, ray tracing enables to take into account most of constitutive elements of an IR oven like multiple lamps (various geometries) and reflectors (ceramic or metallic made).
In this work, we propose a numerical modelling of the IR heating stage. The temperature distribution of the preform is calculated using a two-steps simulation. First, in-lab software, called RAYHEAT, is used in order to compute the absorption of the radiative heat flux inside the preform. Then, the results are applied as an input data in the finite elements commercial package ABAQUS®. The method is applied in order simulate the IR heating stage of a rotating preform using the in-lab blowing machine set-up. A numerical validation is performed using temperature measurements. Following sections focus on presenting the governing equations of the model.
2
HEAT TRANSFER MODELLING
2.1 HEAT BALANCE EQUATIONThe evolution versus time of the preform temperature is governed by the transient heat balance equation:
(
)
r p t k T q T c =∇⋅ ∇ −∇⋅ ∂ ∂ρ
(1)where T = temperature, t = time, ρ = density, cp =
specific heat, k = thermal conductivity, qr = radiative
heat flux density. The inside surface of the preform is assumed to be adiabatic, while the following boundary condition is applied to the outside surface:
(
)
(
4 4)
∞ ∞ + − − = ∂ ∂ − h T T T T n T k c P PET P Pσ
ε
(2)where hc = convection heat transfer coefficient, εPET =
PET’s mean emissivity, σ = Stefan-Boltzman constant,
TP = outside surface temperature, T∞ = air temperature
inside the oven. The boundary condition given by Equation (2) accounts for two types of heat transfer. The first one is due to the cooling by natural convection, the second one to the preform own emission. These heat losses have a critical effect, especially throughout the cooling stage.
2.2 RADIATIVE SOURCE TERM
Over the spectral range corresponding to the emission of IR lamps (0.35–8 µm), PET behaves like a semitransparent body. This involves that the radiative heat flux is absorbed inside the wall thickness of the preform, and cannot be simply applied as a boundary condition. The radiation absorption must be taken into account through the divergence of the radiative heat flux (Equation 1), also called “radiative source term”. The radiative heat flux is required to compute the radiative source term. Per definition, the radiative heat flux density is given by:
( )
=∫ ∫
∞(
Ω)
Ω Ω 0 4 , π λ s d dλ
I s qr (3)where Iλ = spectral intensity at the point s, along the
direction Ω. The variation of the spectral intensity is governed by the Radiative Transfer Equation (RTC), given for a non-scattering medium by [7]:
[
( ( )) ( , )]
) , ( Ω − = Ω s I s T I ds s dI λ λ λ λκ
o (4) where I°λ = Planck’s spectral intensity at the preformtemperature T, ds = optical path, κλ = PET spectral
absorption coefficient. Equation (4) has got an exact solution, given by [8]:
(
)
(
)
(
( )
)
( ) 4 4 4 4 8 4 4 4 4 7 6 4 48 4 47 6 o 2 ' 0 ' ' 1 ' , 0 ,∫
= = − − + Ω = Ω s s s s s s ds e s T I e I s I λ κλ λ λ κ λ λκ
(5)In Equation (5), the first term of the right member represents the fraction of the incident intensity (emitted
by the IR oven) which is absorbed by PET. The second term represents the fraction of the intensity, emitted by PET, which is absorbed by PET (due to the own emission).
Throughout the heating stage, the preform temperature (approximately 400 K at the end of heating) is very low compared to the IR heater temperature (typically around 2400 K). In this case, the second term of Equation (5) can be neglected. This assumption leads to:
(
)
(
)
s e I s I κλ λ λ − Ω = Ω 0, , (6)Equation (6) is called Beer-Lambert law [7]. Then, by assuming that lamps emission is Lambertian, the radiative source term is given by [9]:
( )
∫
∞ − − = ⋅ ∇ 0 . ) 0 (λ
κ
κλ λ λM e d s qr s (7)where Mλ(0) = incident spectral emissive power. The
radiative source term distribution is assumed to be temperature-independent. Therefore, it can be computed and then applied as an input data in the finite element software ABAQUS® in order to solve the heat balance equation.
2.3 RAY TRACING METHOD
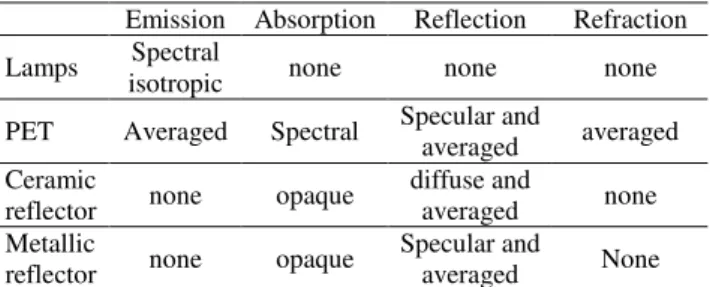
Ray tracing is widely acknowledged as one of the most accurate method used to simulate radiative heat transfers in semi-transparent media. The general principle of the method is to discretize, into a set of rays, the radiative heat flux emitted by halogen lamps. Then, each ray is followed inside the oven, from its emission point and throughout the preform thickness. The ray tracer computes the optical path of each ray, accounting for specular or diffuse reflections, refractions, etc… In our ray tracing software, assumptions are made for the different optical properties of lamps, reflectors and preforms. Those assumptions are referenced in table 1 for the following properties: emission, absorption, reflection and refraction. Reflection and refraction are averaged in order to reduce the number of ray stored in each calculation. In fact, for one ray that comes from the lamp and contained all the spectral information, if spectral reflection (or refraction) is computed, one ray by spectral band (an infinity for an exact model) has to be created for each air-PET interface crossing.
Table 1: Assumptions on optical properties
Emission Absorption Reflection Refraction Lamps Spectral
isotropic none none none PET Averaged Spectral Specular and
averaged averaged Ceramic
reflector none opaque
diffuse and
averaged none Metallic
reflector none opaque
Specular and
averaged None
Only the lamp filament is taken into account. Filaments are modelled by equivalent cylinders, the spiral form is
neglected. Tungsten filaments are assumed to be Lambertian grey bodies. This assumption provides the definition of ray direction vectors (Figure 1) for rays coming from the filament.
Figure 1: Ray definition for ray tracing
The direction vector is defined by two parameters: θ and φ, respectively defined in the ranges [0, π/2] and [0, 2π]. Notations are illustrated on Figure 2. The computation of θ and φ has a strong effect on the ray tracing accuracy. Determinist discretization of the emission space could lead to errors due to the ray effect [10]. To avoid that, we have chosen to compute θ and φ according to stochastic variables: 2 1) ; 2 ( arcsin R
ϕ
π
Rθ
= = (8)where R1 and R2 are independent uniform stochastic
variables in the range [0; 1].
The direction change of a ray that cross a PET-air interface is given by the Snell-Descartes law:
air air PET
PET n
n sin
θ
= sinθ
(9)where nair (= 1) is the refractive index of air. Notations
are illustrated on Figure 2.
Figure 2: Ray refraction at air-PET interface crossing
3
NUMERICAL VALIDATION
3.1 EXPERIMENTAL DEVICEIn order to validate numerical simulations, IR heating trials have been performed on an in-lab IR oven. The oven is composed of five halogen lamps (2 kW nominal power), with ceramic and back aluminium reflectors (see Figure 3). Percentages of nominal power of each lamp are reported in Table 2. After 25 s heating, the preform is cooled down by natural convection during 10 s. No
ventilation system is used. The natural convection coefficient was calculated using the empirical correlation of Churchill and Chu [11]. Its value was estimated to be 7 .5 W.m-2.K-1.
Figure 3: In-lab infrared oven
Table 2: Lamps setting for IR heating trials
L1 L2 L3 L4 L5
Power (%) 100 100 20 5 60 The preform used is 27 g weight, 3.85 mm thickness. Its rotational speed is equal to 1.1 lap/s. The grade of polymer is PET INVISTA 1101 (IV = 0.8).
Temperature measurements have been performed using an AGEMA 880 LW IR camera, functioning within the long wave spectral range 8–12 µm. Over this spectral band, PET behaves like an opaque body [12]. Thus, the camera measures a surface temperature.
3.2 PET THERMAL/RADIATIVE PROPERTIES
PET radiative properties were measured according to the protocols defined by Monteix et al. [12]. Measurements were performed on PET INVISTA 1101 samples using a Perkin Elmer FTIR spectrometer over the range 2.5–25 mm. PET thermal properties are assumed to be temperature-dependent, which is particularly true for the heat capacity that sharply increases above the glass transition temperature.
3.3 NUMERICAL PARAMETERS
The preform is meshed into 5220 rectangular linear elements (6000 nodes), with ten nodes in the thickness direction. For each lamp, 1.5 million rays are followed, for a total of 7.5 millions rays for the entire oven. The computational time of the source term is equal to 90 min CPU (T9500 2.6 GHz 3Go RAM).
Temperature calculation was performed using ABAQUS® standard 6.7, with a fixed time increment equal to 0.25 s. The computation time is equal to 12 min CPU.
3.4 RESULTS AND DISCUSSION
Figure 4 illustrates the radiative source term distribution versus time. We can observe that the source term has been defined as a function of time in order to account for the preform rotation. Figure 5 illustrates the external
temperature distribution along the preform height, at the end of the cooling step. We can observe a good agreement between simulations and measurements, since the mean relative error is equal to 1.7 %. Figure 6 illustrates the variation of external temperature versus time on a single point, located at 40 mm from the neck of the preform (middle-height). The agreement is fair, especially during the cooling stage, which indicates the convection heat transfer coefficient is well estimated.
Figure 4: Source term distribution versus time
0 10 20 30 40 50 60 70 80 60 70 80 90 100 110 120 Preform length(mm) T e m p e ra tu re ( °C ) Measured Calculated Preform neck
Figure 5: Temperature profile along the preform height
0 5 10 15 20 25 30 35 20 40 60 80 100 120 Time (s) T e m p e ra tu re ( °C ) Measured Calculated End of heating: Relative error = 1.2% 0 5 10 15 20 25 30 35 20 40 60 80 100 120 Time (s) T e m p e ra tu re ( °C ) Measured Calculated End of heating: Relative error = 1.2%
Figure 6: External temperature versus time (mid-height)
4
CONCLUSIONS
We have proposed in this work a modelling of the IR heating stage for the ISBM process. The ray tracing software RAYHEAT provides accurate predictions of the 3D radiative source term distribution in the preform. The coupling between RAYHEAT and ABAQUS® allows the computation of the preform temperature, accounting for the preform movement throughout the oven. A numerical validation has shown the efficiency of
the method, since the relative error between simulations and experiments is less than 2%. Future work will aim to further improve the ray tracer in order to decrease the computation times.
ACKNOWLEDGEMENT
Special thanks to SIDEL company (http://www.sidel.com) for manufacturing the preforms and for their collaboration. Authors also thank Mr Plantamura for his contribution to this work.
REFERENCES
[1] Bordival M., Schmidt F.M., Le Maoult Y., Velay V.: Optimization of Preform Temperature Distribution for the Stretch-Blow Molding of PET Bottles: Infrared Heating and Blowing Modeling.
Polym. Eng. Sci. 49:783-793, 2009.
[2] Monteix S., Schmidt F., Le Maoult Y., Yedder R.B., Diraddo R.W., Laroche D.: Experimental study and numerical simulation of preform sheet exposed to infrared radiative heating. J. Mater. Proc. Tech., 119: 90-97, 2001.
[3] Huang H.-X., Deng Y.-H., Huang Y.-F.: Temperature profiles within reheated preform in stretch blow molding. ANTEC’05 (Boston, Massachusetts), May 2005.
[4] Yousefi A., Diraddo R., Bendada A.: Simulation of the mobile preform reheat in injection stretch blow molding process, In PPS-17, The Polymer
Processing Society, p. 134-146, 2001.
[5] Michaeli W., Papst W.: FE-Analysis of the Two-Step Stretch Blow Molding Process. In SPE ANTEC
Technical Papers 30, Chicago, USA, 2004.
[6] Champin C., Bellet M., Schmidt F.M., Agassant J.-F., Le Maoult Y.: 3D Finite Element Modeling of the Blow Molding Process. In 8th ESAFORM
Conference on Material Forming, p. 905, 2005. [7] Modest M.F.: Radiative heat Transfer. McGraw-Hill
Inc, 1993.
[8] Viskanta R., Anderson E.E.: Heat Transfer in Semitransparent Solids. Advances in Heat Transfer, 11:317-441, 1975.
[9] Erchiqui F., Hamani I., Charette A.: Modlisation par éléments finis du chauffage infrarouge des membranes thermoplastiques semi-transparentes.
International Journal of Thermal Sciences 48:73-84, 2009.
[10] Li B.-W., Tao W.-Q., Liu R.-X.: Ray effect in ray tracing method for radiative heat transfer. Int. J.
Heat Mass Transfer, 40:3419-3426, 1997.
[11] Churchill S.W., Chu H.S.: Correlating Equations for Laminar and Turbulent Free Convection from a Vertical Plate. Int. J. Heat Mass Transfer, 18:1323-1329, 1975.
[12] Monteix S., Le Maoult Y., Schmidt F.M.: Quantitative infrared thermography applied to blow moulding process : measurement of a heat transfer coefficient. QUIRT Journal, 1(2):133-150, 2004.