HAL Id: hal-02165300
https://hal-lara.archives-ouvertes.fr/hal-02165300
Submitted on 25 Jun 2019HAL is a multi-disciplinary open access
archive for the deposit and dissemination of sci-entific research documents, whether they are pub-lished or not. The documents may come from teaching and research institutions in France or abroad, or from public or private research centers.
L’archive ouverte pluridisciplinaire HAL, est destinée au dépôt et à la diffusion de documents scientifiques de niveau recherche, publiés ou non, émanant des établissements d’enseignement et de recherche français ou étrangers, des laboratoires publics ou privés.
Behaviour laws of households in term of location and
consumtion of their dwelling
L. Clément, V. Lainez
To cite this version:
L. Clément, V. Lainez. Behaviour laws of households in term of location and consumtion of their dwelling. [Research Report] Centre d’études sur les réseaux, les transports, l’urbanisme et les con-structions publiques (CERTU). 1997, 59 p., figures, tableaux. �hal-02165300�
report
Behaviour laws
of households
in term
of location and
consumption
of their dwelling
november 1997
Centre d'études sur les réseaux, les transports,
l'urbanisme et les constructions publiques
© CERTU / MOBILITY DEPARTMENT
Organism : CERTU Title :
BEHAVIOUR LAWS OF HOUSEHOLDS IN TERM OF LOCATION AND CONSUMPTION OF THEIR DWELLING
Sub-tittle : Language :
English
Author : Date of
publication
November 1997 L. CLEMENT (Certu, Département Mobilité)
Assisted by :
V. LAINEZ (Certu / Université Lyon II)
Primilary remark :
This report was made by the CERTU, which is working in the land-use transport field in relation with an european project called ESTEEM, program JOULE, directed by the DGXII.
Abstract :
The aim of this report is to give some explanation about the behaviour laws of the households in term of location and consumption of their dwelling, in an urban area (city of Lyon, France) . The location is considered here in relation with the choice of removing and the choice of the dwelling . We try to valid the
assertions we present by data collected in different surveys . The work is based on a revealed
preferences survey, carried out in
1997, concerning 752 households. Key words :
Residential location, urban location, choice of dwelling, choice of location
Diffusion : Free
Number of pages : Price : Confidentiality : Bibliography :
© CERTU / MOBILITY DEPARTMENT
TABLE OF CONTENTS
INTRODUCTION
I . THE SURVEY AND THE STUDY AREA 6
1 .1 . THE SURVEY 6
1 .2 . THE STUDY AREA 6
II. PROBLEMATIC, OBJECTIVE, METHODOLOGY AND POPULATION
SURVEYED 9
III . MODELLING THE CHOICE OF ZONES 11
IV . STATISTICAL STUDY OF THE RP SURVEY 12
IV.1. CHOICE OF REMOVAL 12
IV.2. CHOICE OF DWELLING 27
V . A CRITERION APPROACH TO ASSESS BEHAVIOUR LAWS 38
V .I . REASONS FOR CHANGING RESIDENCE 38
V .2 . CRITERION PRESENTS IN THE CHOICE OF HOUSING 40
VI . MODELLING THE CONSUMPTION OF THE DWELLING 41
VI.1. RESULTS FOR EACH ZONE 42
VI.2. RESULTS FOR OWNERSHIP AND RENTER 44
CONCLUSION 45
ANNEXES 46
ANNEX 1 : QUESTIONNAIRE OF THE RP SURVEY 47
ANNEX 2 : ZONES DEFINED FOR THE TRANUS SYSTEM 55
© CERTU / MOBILITY DEPARTMENT
INTRODUCTION
The aim of this report is to give some explanation about the behaviour laws of the households in term of location and consumption of their dwelling, in an urban area (city of Lyon, France) . The location is considered here in relation with the choice of removing and the choice of the dwelling . We try to valid the assertions we present by data collected in different surveys . The work is based into a revealed preferences survey, carried out in
1997, concerning 752 households.
In a first point, we present the RP survey and the study area, followed by aspects concerning the problematic, the objective and the methodology of the work, and the presentation of the population surveyed . In a third point, we try to put in advance the characteristics of the households which could be present in the choice of the zone's location
(discrete choice modelling) . After this, a more detailed analysis is realised in a statistical point of view, followed by a three pages synthesis of the results . For the end, we try to explain the consumption of the household's dwelling by few others variables (with regression techniques) .
© CERTU / MOBILITY DEPARTMENT
I . The survey and the study area
1.1 . The surveyBetween February and April 1997, the Certu and the Town Planning Agency of Lyon, made a survey about the location of the households in the agglomeration of Lyon . Two parts was considered : the first consists in a revealed survey (RP), the second consists in a stated preferences survey (SP) . So, two questionnaires were defined . The first was sent at 8 015 households (RP) of the study area, and the second at 752 households (SP) . These 752 people were those who gave a response to the RP survey.
The first questionnaire allows to make the distinction between two types of households : - households expressing an intention of relocating.
- households not expressing any intention of relocating
Note that the second questionnaire was only sent to people of the first type. This report concerns the analysis of the revealed survey only.
L2 . The study area
The study area is formed by 99 districts (1 250 000 inhabitants, 490 000 households, 600 000 employment (census of 1990)) . The same area is used in the modelling approach made with the TRANUS system by the Certu, but at a more global
level (63 zones).
Study area : the 63 internal zones used for the TRANUS system
© CERTU / MOBILITY DEPARTMENT
To have a better understanding of the location behaviour laws, who decided to make a typology of the zones of the study area 2 . For this, we used factorial analysis . Six discriminates variables, uncorrelated, were selected for each zone :
- density of buildings only (DENN)
- proportion of the land used by residential collective dwellings (RECD) - proportion of the land used by activities (ACTI)
- proportion of white collars in the population of the zone (CADR)
- number of public equipment of sport, leisure and education, for 1 000 households (LIEU)
- distance to a highway (AUTO)
Eleven variables were used to complete the analysis. The main results of this report are3
Typology of the zones of the study area (The two north-east external zones were not
considered : due to a lack ofdata)
2
BOUIS (S .), PASQUIER (E .), sous la direction de M .A . BUISSON et L . CLEMENT, Typologie des zones consitutives du découpage de l'agglomération de Lyon . Le cas du logiciel TRANUS, Université Lyon 2, Maîtrise MASS, Mai 1997, non paginé.
© CERTU / MOBILITY DEPARTMENT
The characteristics of the7type of zones which are defined are :
Type 1 :
" Central Business District of the agglomeration. A lot of services and commercial places (little places) . A lot of white collars households . "
zones for Tranus, '
n° 1, 2, 7, 9, 11, 22, 56, 59 and zone 3 Level of variables :
DENN high AUTO very close
RECO medium LIEU low
CADR many ACTI medium
Type 2 :
" Near the CBD. Residential boroughs with collective buildings with more than 20
dwellings, few proportion of activities"
* • zones for Tranus, * Level of variables :
n° 6, 14, 17, 20, 24, 26, 30, 31, 54, 58
DENN medium AUTO very close
RECO medium LIEU low
CADR normal ACTI medium-low
Type 3 :
"Area of employment, near the CBD, blue collar and employees, with a low level of income. A lotofforeign people and collective buildings ." "
* zones for Tranus * Level of variables :
n°4, 13, 29, 33, 66, 75
DENN high AUTO close
RECO low LIEU medium
CADR not present ACTI very important
Type 4 :
"Industrial area, with a lot of blue collars and employees, with a low level of income . A lot of important collective buildings "
* zones for Tranus * Level of variables :
n°15, 16, 21, 23, 28, 35, 61, 62, 65
DENN medium AUTO very close
RECO high-medium LIEU low
CADR medium ACTI not very important
© CERTU / MOBILITY DEPARTMENT
Type 5 :
" Residential borough, single family homes . A lot of white collars, with many children . A lot of green spaces and few activities"
* zones for Tranus * Level of variables
n°18, 38, 47, 48, 49, 51, 84, 85
DENN low AUTO not close
RECO very low LIEU medium
CADR very important ACTI low
Type 6 :
" Households with medium level of income, a lot of single family homes, few employment" zones for Tranus
no 79, 82, 95, and zones 41, 42, 46 * Level of variables
DENN low AUTO very far
RECO very low LIEU high
CADR medium ACTI important
Type 7 :
"Zones far from the CBD, inhabitants with low income, no employment and activities " Zones for Tranus
n°80, 81, 83, 86, 87, 88, 89, 90, 91, 93, 96, and zone 39 * Level of variables
DENN very low AUTO far
RECO very low LIEU very high
CADR normal ACTI very low
To have a good statistical representation of the data, zones 3 and 4, and zones 6 and 7 were put together (5 zones were kept).
II . Problematic, objective, methodology and population surveyed
The problematic consists in two questions :
1. What are the variables which have an action on the residential location choice of the households ?
2. What are the variables which defined the "quantity" of dwelling consumed by the households (in square meters) ?
The objective was to quantify the behaviour of the households, with utility functions for the first question, and regression techniques for the second. So, their are two cases : modelling discrete choices, and modelling indiscreet choices . For this, we used the software's Hielow and Excel .
© CERTU / MOBILITY DEPARTMENT
The methodology elaborated was the following :
Building of the data base (based on the RP survey). Selection of the interesting variables for the models; Study of correlation's
Variables put at the same scale Calibration of models
Analysis
The results we obtained, conducted us to develop an other approach between phase 1 and phase 2 . This one concerns a statistical analysis of the data base.
Population: About the type of households :
As precise below, two types of households must be considered .:
1. Households expressing an intention of relocating in the next two years (INTD) : they could have clear ideas about their future situation . . We keep for the analysis, this representation of the removal lie to the future : why I would, (or I will), like to remove from my zone of location ?
2. Households who are not expressing any intention of relocating (NINTD) : in this case, we have only kept those who have moved from their dwelling since the first of January of 1991, because they probably still have clear ideas about their recent situation. For this sub-population, we keep the relation with the past.
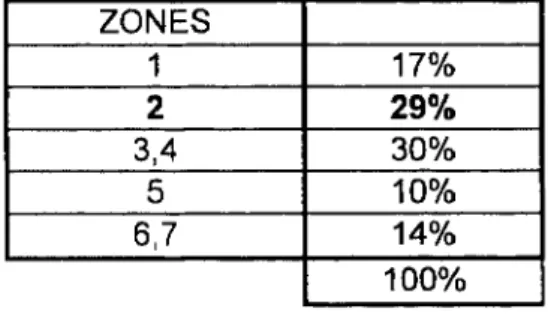
Population ZONES Number of households in the questionnaire Responses INTD , available for INTD N INTD Responses available for N INTD 1 155 72 69 83 72 2 178 91 75 87 77 3,4 173 91 75 82 74 5 111 46 56 65 58 6,7 135 55 74 80 73 752 355 348 397 354 In percentage
ZONES intd non intd
1 46% 54%
2 51% 49%
3,4 53% 47%
5 41% 59%
© CERTU / MOBILITY DEPARTMENT
Note that the structure of the RP survey (distinction ownership-renter, apartment-single house, and by social category of the head of family, is appropriate with the data coming from exhaustive survey existing in Lyon).
Ill . Modelling the choice of zones
We present, here, the modelling of the choice of zones for the first kind of households (355 people) 5 . The variables present in the RP survey and used to elaborate models of location are the folllowing.
Variables of choice: the 5 zones (5 choices possible, see page 8)
Variables concerning the household and which can çxplai a part of the choice : live in a single family home or in a block of flats,
property owners or not
number of adults in the household
number of people working in the household number of people in the household
average income of the household age of the first person in the household
We try to calibrate utility function has :
U it
= ext
+ Eit With .Ui , =utilityofzone ifor householdt A =parameters to be calibrate
X, =variables concerning the household s ;,= random partofthe utility
So, the modelling approach concerns only the relation between the location and the characteristics of the households . 6
All the results are not good in a statistical point of view . This is not due to the RP survey, which is good ', but to the fact that these quantitative variables don't play any role in the location choice process of the households.
These results show that to live in a single family home, or not, is not a reason which lead people to change for an other zone, as to be home ownership or not . The number of adults, of people working, or of people in the households have also no importance . It's easy to understand : household can find large dwellings in all the zones, even if it is easy to find ones in certain zones rather than in others . The income has no action too . We think that is because the income is not a good variable : we can make the same analysis that the
5 Models were also made for the type 2, and also forotherdiscretchoices as : live in asinglefamilyhome or inablockofflats, to be ownership or renter . The results weren't better.
6 Others characteristics are considered in the modelling of the SP survey.
© CERTU / MOBILITY DEPARTMENT
previous one, and we can say that the income doesn't give a good idea of the patrimony of a household . The age has also no action : a young household can buy a dwelling as well as a old one, but the characteristics of this dwelling will certainly be different.
Lessons to keep :
- the quantitative approach (with the variables we have) seems not to be the good one to explain the behaviour of the households in their location process.
- the choice of this kind of variables for a SP survey is certainly not the better.
Thus, we decided to show if qualitative factors are able to explain the behaviour of the households ..
IV. Statistical study of the RP survey
A statistical study of the RP survey was made to give a response to our first problematic question . It consists of a treatment of the questions about the qualitative reasons concerning the removal of the household :
why have you, or why will you, remove (IV .I .) ?
why have you, or why will you, choose this dwelling (IV .2) ? See questions 22 and 23 of the questionnaire.
Three choices were offered among eleven possibilities for the first question and among nine possibilities for the second . The analysis we made, concerns the first choice made by households . Each time we made the distinction between the zones in competition.
IV.1. Choice of removal
Eleven possibilities were proposed at each household. List of the criterion
1- Size of the dwelling : to have a more important one 2- Comfort : to improve comfort (ex : to have a lift. ..) 3- Price : because the price of my dwelling
4- Family reasons : change in the situation (child, divorce ...)
5- Place of work : because a change of my place of work, to be closer to my place of work 6- To become home-ownership
7- Enjoy to live in a single family home (SFH) 8- To leave my borough
9- To live in the country 10- To live in the CBD 11- Other
© CERTU / MOBILITY DEPARTMENT
We can group the previous criterion
Criterion not concerning the zone but the dwelling : 1. Criterion not concerning the zone nor the dwelling : 4 ; 6 ; 7 Criterion concerning the zone and the dwelling : 3 ; (2) Criterion concerning the zone, not the dwelling : 5 ; 8 ; 9; 10
IV.1 .1 . Global results
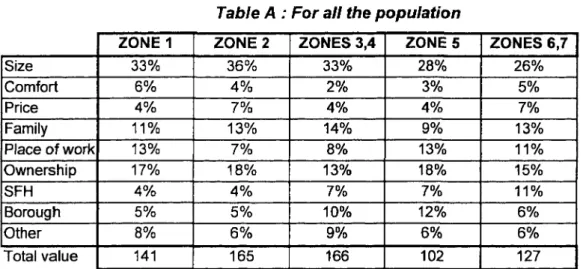
Table A : For all the population
ZONE 1 ZONE 2 ZONES 3,4 ZONE 5 ZONES 6,7
33% 36% 33% 28% 26% 6% 4% 2% 3% 5% 4% 7% 4% 4% 7% 11% 13% 14% 9% 13% 13% 7% 8% 13% 11% 17% 18% 13% 18% 15% 4% 4% 7% 7% 11% 5% 5% 10% 12% 6% 8% 6% 9% 6% 6% 141 165 166 102 127
The first criteria concerns the size of the dwelling . After, to become home ownership, family reasons and place of work are present . These 4 criterion concern 70% of the reasons of the removal.
Table B : Households expressing an intention of relocating (INTD)
ZONE 1 ZONE 2 ZONES 3,4 ZONE 5 ZONES 6,7
Size 33% 37% 34% 37% 26% Comfort 7% 7% 1% 0% 9% Price 6% 7% 3% 4% 9% Family 17% 11% 10% 7% 11% Place of work 8% 8% 7% 11% 11% Ownership 18% 13% 14% 15% 9% SFH 1% 6% 8% 4% 9% Borough 6% 8% 14% 17% 9% Other 4% 4% 9% 4% 6% Total value 72 90 91 46 54
As for the general appraisal, the size of the dwelling is the more important criteria .. We show, also, the role of the need to become home ownership and of the family reasons . The borough is also an important criteria . The place of work has not an important role.
Ownership Other Comfort SFH Size Family Place of work Borough Price Total value
© CERTU I MOBILITY DEPARTMENT
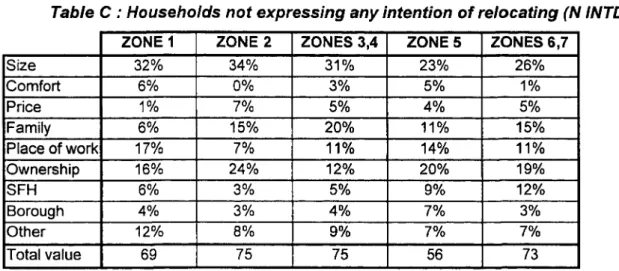
Table C : Households not expressing any intention of relocating (N INTD) ZONE 1 ZONE 2 ZONES 3,4 ZONE 5 ZONES 6,7
Size 32% 34% 31% 23% 26% Comfort 6% 0% 3% 5% 1 % Price 1% 7% 5% 4% 5% Family 6% 15% 20% 11% 15% Place of work 17% 7% 11 % 14% 11% Ownership 16% 24% 12% 20% 19% SFH 6% 3% 5% 9% 12% Borough 4% 3% 4% 7% 3% Other 12% 8% 9% 7% 7% Total value 69 75 75 56 73
The more important criteria stay : size of the dwelling, to become home ownership, family reasons, and place of work . Nevertheless, situations are very different between the zones.
IV.1 .2. Results and analysis, zone by zone
Zones of the centre of the agglomeration (1,2) :
Zone 1 : " Central Business District of the agglomeration . A lot of services and commercial places (little places) . A lot of white collars households. " Zone 2 : " Near the CBD . Residential boroughs with collective buildings with more than 20 dwellings, few proportion of activities"
We find again previous aspects . The reasons of the households to remove in centre's zones are very close . The difference concerns the place of the work in zone 1 (see table A, above) . Among the 155 households inquired in zone 1, 72 would like to remove (46%), and 83 wouldn't. In zone 2, among 178 households inquired, 91 would like to remove (51%).
Households expressing an intention of relocating
Other Borough SFH Ow nership Race of W Family Price Comfort Size
Criterion about removal, zone 1
0% 10% 20% 30% 40%
© CERTU / MOBILITY DEPARTMENT
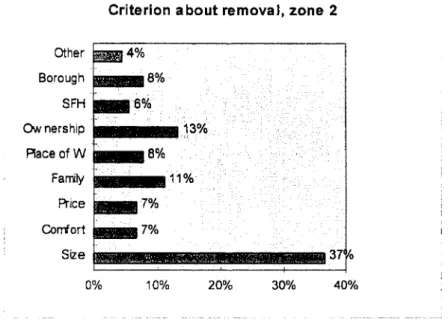
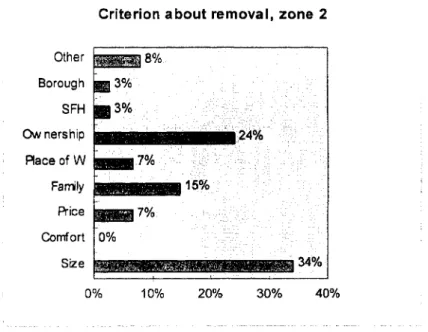
Criterion about removal, zone 2
Other Borough SFH Ow nership Place of W Family Price Cordort Size «: 37'o 0% 10% 20% 30% 40%
We can see the role of the criterion which are lied to the zone . The three more important criterion are : size of the dwelling, to become home ownership and family reasons . We think that this is due in great part to the characteristics of the households who live in these zones. They are young households with one or two people, who try to remove from their dwelling when there is a change in their social situation, to have a more functional and big dwelling 8 . The need to become home ownership could be explain by the quantity of
dwellings to be rented : it's certainly more easy to buy a dwelling zone's far from the CBD than in the CBD (see table 1) . The price of the dwellings can also put the households to remove from zone 1 to another, to become home ownership (see table 2).
Table 1 . : Percentage of renters and properties in each zones
ZONES Properties Renters
1 33% 67% 2 38% 62% 3,4 35% 65% 5 58% 42% 6,7 67% 33% Source : RGP 90 (INSEE)
Table 2 : Rent for 100 m 2 and price of the m2
ZONES for 100m2 price of the m2
1 4498 10000
2 4247 7053
3,4 4063 7727
5 4575 8584
6, 7 3672 7580
Source : Notariat, service action foncière du Grand Lyon, 1995
8
More than 55% of interviewed people (head family) have more than 18 years old and under 35 years old for zone 1 (near 35% for "externals" zones 5 and 6-7).
© CERTU / MOBILITY DEPARTMENT
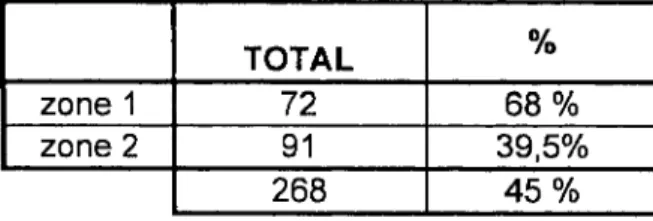
We see, also, that the need to have a single family home is more important in zone 2 . This variable take-over the gap between the two zones . Otherwise, inhabitants of zone 1 seem to be right city dwellers, because 68% of those who want to remove have the intention to stay in this zone, which is not the case for the zone 2 (40%) . We think, that these people like the historical centre of the town (see table 3).
Table 3 : Percentage of households who want to stay in CBD among households who want to remove TOTAL % zone 1 72 68 % zone 2 91 39,5% 268 45 % Source : enquête RP
Households not expressing any intention of relocating
As for previous people, households went in these zones because the size of their dwelling. Nevertheless, family reasons and the need to become home ownership haven't the same role than for households expressing an intention of relocating.
Criterion about removal, zone 1
Other Borough SFH Ownership Race of W Family Rice Comfort Size 32% 0% 10% 20% 30% 40%
© CERTU / MOBILITY DEPARTMENT
Criterion about removal, zone 2
Other Borough SFH Ownership Place of W Family Price Comfort 8% 2,1"D,3;1=2 3% 3% 24% 7% 15% 7% 0% Size ~`iä K~~~`~ .~~:;~ï` 34% 0% 10% 20% 30% 40%
For these two zones, people have different logics . "To be closer to its place of work" is an important reason for the removal, rather than family reasons . For those who came in zone I : there are a lot of employments in basic and induced services (respectively 33% and 31% of the employment of the agglomeration), and in small shops (29%) . See table 4.
Table 4 : Induced and basic services, and small shops, of the agglomeration, shared by zones
ZONES Basic
Services
Induced
Services Small shops
1 33% 31 % 29% 2 18% 18% 18% 3,4 27% 26% 26% 5 8% 9% 9% 6,7 14% 17% 17% 100% 100% 100% Source : RGP 1990(INSEE)
Otherwise, people is certainly interested by the equipment present in these zones, notably in the health field . (the percentage of old people is very important in these zones : see table 5 and 6) .
Table 5 : Number of general practitioner for Table 6 : Percentage of people who 1 000 household
have more than 60 years in each zone ZONES 1 14.33 2 9 .45 3,4 7 .50 5 8.46 6,7 7 .93
Source:Enquête équipements INSEE 1994
ZONES 1 23% 2 20% 3,4 15% 5 18% 6,7 13% Source : RGP90 (INSEE)
© CERTU / MOBILITY DEPARTMENT
In zone 2, the logic is close than for previous people, but the criteria "family reasons" and "to become home ownership" are more important . The criteria "to become home ownership" has a right impact on the removal decision (for 24% of households) . It seems that the opportunity to become home ownership are more important in zone 2, than in zones 1, and 3-4, at a good price (see table 2) . Otherwise, always in zone 2, "family reasons" plays a more important role than the criteria "place of work" . It is the opposite in zone 1 . Zone 2, has a good level in services for people, especially in education, it is also near the CBD.
Table 7 : Employment in education of the agglomeration, shared by zone ZONES 1 17% 2 29% 3,4 30% 5 10% 6,7 14% 100% Source : RGP 1990 (INSEE)
Zones near the centre of the agglomeration (3,4) :
"Area of employment, near the CBD, blue collar and employees, with a low level of income. A lot of foreign people and collective buildings." "
These zones find their position in the framework of the general comments . Nevertheless, the "place of work" doesn't play an important role at the difference of the "borough". Among the 173 households inquired, 91 would like to remove (53%).
Households expressing an intention of relocating
Criterion about removal, zone 3,4
Other Borough SFH Ow nership Place of W Family Price Comfort Size 0% 10% 20% 30% 40%
© CERTU / MOBILITY DEPARTMENT
We can note :
- the importance of a criteria which not concerning the zone nor the dwelling : "to become home ownership" . As in zone 1, the quantity of dwelling to be rent is high. So, the capability to buy a dwelling in these zones is lower than for those which are far from the centre (5 and 6-7 ; see table 1).
- the importance of a criteria concerning the zones : the borough . In these zones, there are certainly problems due to the neighbourhood and the security . We can also explain this by problems lie to the welfare : there are a lot of industries in these zones, with a lot of factories (Gerland, St Fons, . . .). So negative effects are important (noise, pollution, .. .), and boroughs not very nice (see table 8).
Table°8 : Employment in heavy basic industry of the agglomeration, shared by zone
ZONES 1 11% 2 14% 3,4 38% 5 6% 6,7 32% 100% Source : RGP 90 (INSEE)
The public equipment can be considered as a good one . It doesn't occur in the removing decision (see table 9).
Table°9 : public equipment perceived by household in each zones
ZONE 1 ZONE 2 ZONE 3,4 ZONE 5 ZONE 6,7 Very good equipment 93 % 70 % 60 % 53% 38 0/0 Good equipment 4 % 28 % 35 % 32 % 25 % Bad equipment 3% 2% 5% 12% 19%
Rural (very bad) 0 .00% 0 .00% 0.00% 3 % 18 0/0
100 % 100 % 100 % 100 % 100 %
Source : RP survey, 1997
The place of work has no importance in these zones . As they are the place of employment of the agglomeration, households are near their place of work . These zones are also near to highways entrances .
© CERTU / MOBILITY DEPARTMENT
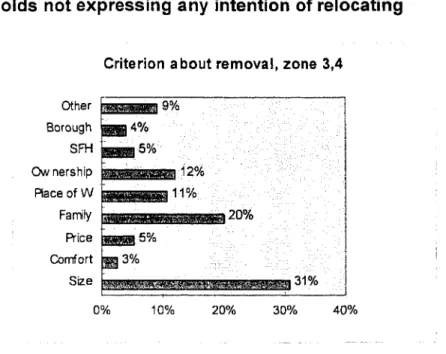
Households not expressing any intention of relocating
Criterion about removal, zone 3,4
Other 9% Borough 4% SFH 5% Ow nership Place of W Family ~°._~ ..~ z~~.. ,~~ 20% Price Comfort Size 31% 0% 10% 20% 30% 40% 3% 5% 12% 11%
Sensitivity of these people is very different from those who want to remove, even if the first criteria stay the size of the dwelling . "Family reasons", "to become home ownership" and "the place of work" are the main criterion . The criteria "borough" is not an important one . We can explain the position of the criteria "family reasons" by the number of collective dwellings in these zones (arround 40% of buildings of the agglomeration, with more than 20 dwellings are concentrated here), with a lot of HLM (habitations à loyer modéré) . These dwellings allow households with low income to live in dwelling offering a good price (see table 10 and 11).
Table 10 : Rent for 100 m2 and price of the mz (in FRF) ZONES rent price of m2
1 4498 10 000
2 4247 7053
3,4 4063 7727
5 4575 8584
6,7 3672 7580
Source : Notariat, service action foncière du GrandLyon, 1995
Table°11 : percentage of type of buildings with ....
ZONES 1 dwelling 2 dwellings 3 to 9 10 to 19 more than 2 1 2% 9% 26% 26% 16% 2 7% 23% 26% 25% 32% 3,4 17% 21% 22% 31% 38% 5 18% 17% 11% 11% 9% 6,7 56% 30% 15% 8% 5% 100% 100% 100% 100% 100% Source : RGP90
© CERTU / MOBILITY DEPARTMENT
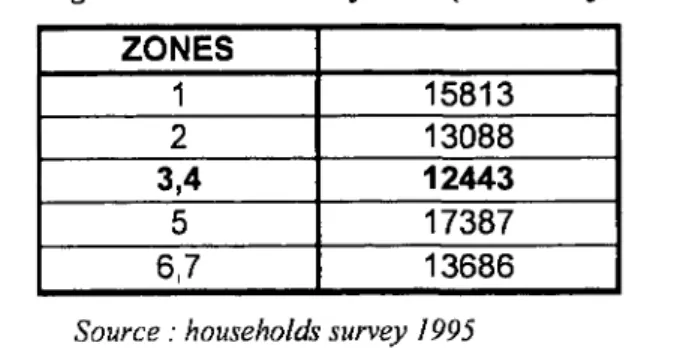
We think that to become home ownership is not an important criteria in these zones because the lowest level (see table 12) of incomes 9, and because the important part of people unemployed (see table 13 . In zone 1 and 2 there are a lot of retired people, taking
into account in these data).
Table°12 : average level of income by zone (inFRFby month)
ZONES 1 15813 2 13088 3,4 12443 5 17387 6, 7 13686
Source : households survey 1995
Table 13 : inactive people of the agglomeration shared by zone ZONES 1 35% 2 20% 3,4 28% 5 9% 6,7 9% 100% Source : RGP 90 (INSEE)
Finally, for people who have moved, the need of the place of work is certainly lie to the importance of employment in these zones (see tables 7 and 8).
Zones of residential's boroughs of the west agglomeration (5) :
" Residential borough, single family homes . A lot of white collars, with many children . A lot of green spaces and few activities"
The criteria "size of the dwelling" is more important in the others zones than here . But the criteria "to become property owner" plays an important role, as to be close to its place of work. We can see, also, that the "borough" is present, as "family reason", but at a lower level.
Among the 111 households ask in this zone, 46 want to remove (41%), and 65 don't want.
© CERTU / MOBILITY DEPARTMENT
Households expressing an intention of relocating
Criterion aboutremoval, zone 5
Other Borough SFH Ow nership Place of W Family Price Comfort Size 4% 17% 4% 0% 3 % 0% 10% 20% 30% 40%
We find again the general hierarchy, but not for the criteria "borough", which is at the same level as the criteria "to become home ownership".
Here, we can put in advance criterion concerning the zone, not the dwelling The "borough" is the second choice, and to be close to is place of work is a discriminate one . Family reasons haven't a good place (we think that is due to a more important social and economic
stability of the household who live in this zone).
The place of the criteria "borough" is certainly due to the disadvantages concerning the organisation of the life of the household in this "periurban" zone very spread, with a low density : the car is obligatory not only for home-work trips but also for the children's
leisure . So it implies constraints for the heads of the family and it cost money (the number of person by household is high (see table 14) . Problems due to the public equipment can also explain this reality : only 53% of households living in zone 5, think that the level of equipment is very good, for 93% in zone 1, 70% in zone 2 and 60% in zone 3-4 (see table 9) .
Table°14 : average number of person by household in each zone ZONES 1 2 .08 2 2 .53 3,4 2 .66 5 2 .81 6,7 3 .10
Source : households survey 1995
About the criteria "to become home ownership", phenomenon lie to the style of life, plays certainly a role . Thus, an important part of households living in this zone is dwelling's ownership (previous stability) . May be this situation has an impact into households who
© CERTU / MOBILITY DEPARTMENT
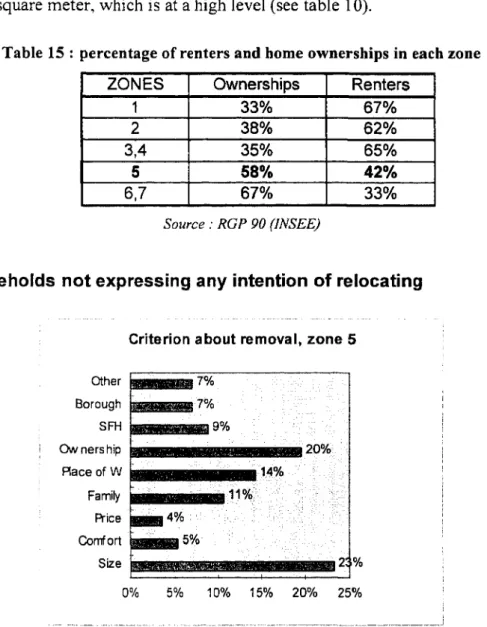
are renters, and who would like to become property-owner, but who are not able to pay the price of the square meter, which is at a high level (see table 10).
Table 15 : percentage of renters and home ownerships in each zone
ZONES Ownerships Renters
1 33% 67% 2 38% 62% 3,4 35% 65% 5 58% 42% 6,7 67% 33% Source : RGP 90(INSEE)
Households not expressing any intention of relocating
Criterion about removal, zone 5
Other Borough SFH Ow ners hip Place of W Family Price Comfort Size
mum
7% 7% 9% 20% 14% ® 11%-sm
4%mimi 5%
23% 0% 5% 10% 15% 20% 25%At the difference of the others zones, the size of the dwelling has a lower importance, but we find again the criterion "to become home ownership", "the place of work", "family reasons" and the "need of a house" . We think that a phenomenon of "social link" has lead some households to came in zone 5, because they are white collars (see table 16) . It explain certainly that many criterion have a lower importance in this zone as in others (as size of the dwelling or family reasons).
Table°16 : percentage of white collars for each zone
ZONES 1 33% 2 22% 3,4 15% 5 38% 6,7 17% Source : RGP 90(INSEE)
© CERTU / MOBILITY DEPARTMENT
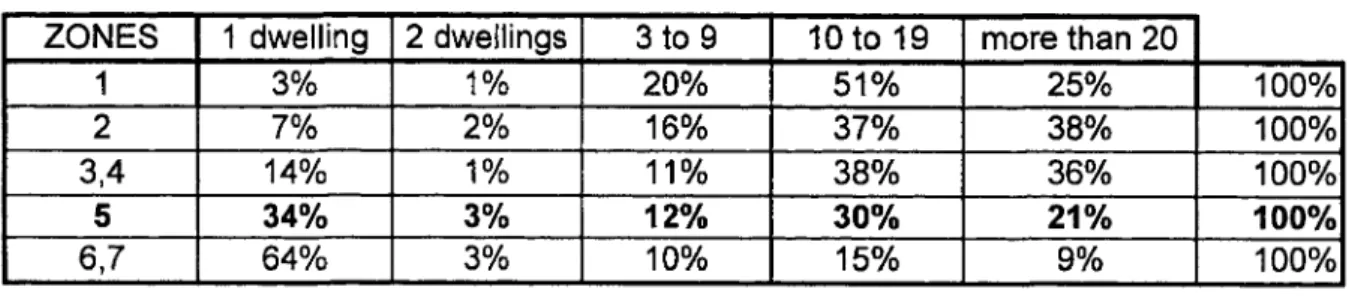
About the criteria "to become home ownership", we can explain it by the high number of home ownership : may be opportunities are more important. Thus, has we said before, there are a lot of white collars and, also a lot of single family home in zone 5 (see table 17). Others buildings are nice and the quality of environment is good.
Table 17 : percentage of building of. ..for each zone
ZONES 1 dwelling 2 dwellings 3 to 9 10 to 19 more than 20
1 3% 1% 20% 51% 25% 100% 2 7% 2% 16% 37% 38% 100% 3,4 14% 1 % 11 % 38% 36% 100% 5 34% 3% 12% 30% 21% _ 100% 6,7 64% 3% 10% 15% 9% 100% Source : RGP 90(INSEE)
As in zone 1, we find many households interested by the proximity of the place of work. Zone 5 is near the CBD and many "high-tech" society are located here . The criteria "need a single family home" (SFH), can be lies with previous remarks : there are a lot of single family homes and unused land is important..
Zones very far of the CBD (6,7) :
Zone 6 : " Households with medium level of income, a lot of single family homes, few employment"
Zone 7 : " Zones far from the CBD, inhabitants with low income, no employment and activities "
As in zone 5, the size of the dwelling has a lower weight than for others zones . For others criterion we are in relation with the global results, but we can see that the criteria concerning a need of a single family home is an important one (SFH) . Among the 135 households ask, 55 want to remove (41%), and 80 don't want.
Households expressing an intention of relocating
Criterion about removal, zones 6,7
Other Borough SFH Ownership Race of W Family Rice Comfort Size 0% 10% 20% 30%
© CERTU / MOBILITY DEPARTMENT
All the criterion are equally represented, even if the size of the dwelling is at the first place, but a lower level than in others zones . We can note the place of the criteria "place of work" . As in zone 5, we could explain the level of the criteria "size of the dwelling" by the average area of the dwelling which is high : so, people give a lower importance on it (see table 18 10 )
Table°18 : average area of dwellings by zone, in m2
ZONES dwellings rented
dwellings of property owners 1 73 104 2 66 88 3,4 68 94 5 76 109 6, 7 77 107
Source : Notariat, service action foncière du Grand Lyon
These zone are very far from the CBD, there have few employments only, and not a good level of public equipment : so there are trips constraints for households (see table 9) . Thus, households need to have cars . The lack of public transport in this part of the agglomeration, not easy to serve, reinforce this fact. Expenditures are high : work-trips, cars ownership, children's leisure, . . . . So, the need to be close to he work and the family reasons play a role
in the decision of the households who want to remove.
Table°19 : percentage of household which have 1 car and 2 cars or more by zone
ZONES one car 2 or more
1 48% 14% 2 52% 18% 3,4 53% 20% 5 48% 37% 6,7 46% 41% Source : EM 1995
10 Be careful, the data for the zone 5 must be compared with those of zones 3,4 . Zones 1 and 2 are zones of the centre of the agglomeration .
CERTU / MOBILITY DEPARTMENT
Households not expressing any intention of relocating
Criterion about removal, zone 6,7
Other Borough SFH Ow nership Race of W Family Price Comfort Size 0% 10% 20% 30%
We find the same hierarchy as in zone 5, with a bigger importance in the family reasons and the need of a house . In these zones, there are a lot of houses, and a lot of land which can be used to build single family home . The rents and price of the m 2 for purchase are interested . So, its seems logic to have an important percentage of households who came here, because they wanted to have a single family home (see table 20 and 21).
Table 20 :percentage of individual and collective dwellings for each zone
ZONES Individual Collective
1 3% 98% 100% 2 7% 93% 100% 3,4 14% 86% 100% 5 34% 66% 100% 6, 7 64% 36% 100% Source : RGP 90(INSEE)
Table°21 : percentage of residual part in the land-use of each zone
ZONES 1 48% 2 41% 3,4 58% 5 55% 6,7 79%
Source : Town agency of Lyon (1996)
The same analysis as the previous one, can be made for the criteria "to become home ownership" (see also table 10) .
© CERTU / MOBILITY DEPARTMENT
About "family reasons", we certainly find here, people who came in these zones when the household grows up (more children), to become property-owner of a house and for the quality of the environment (see table 14 : 3 .10 people in average by household) . So, everything seems correlated : size of the household (place in the cycle of life), good price of dwelling, big area of dwelling, . . . . Other explanation can be advanced (see par V of this report).
1V.2. Choice of dwelling
Seven criterion were proposed at the households : List of the criterion :
- good quality of environment (calm, green spaces, . ..) - good public transports
- comfortable dwelling - need to be lonely
- need to be close to is place of work
- equipment : school, public equipment, shops, ... - others
IV .2 .1 . Global results
Table D : For all the population
ZONE 1 ZONE 2 ZONES 3,4 ZONE 5 ZONES 6,7
36% 44% 38% 62% 51% 13% 6% 9% 5% 6% 24% 25% 21% 13% 14% 1% 3% 5% 3% 4% 9% 5% 8% 6% 8% 11% 12% 8% 10% 7% 6% 5% 10% 2% 9% 144 165 165 103 127
The quality of the environment is always the first criteria, the comfort of the dwelling is the second one . We can note opposition for zones 1,2 and 3-4 and for zones 5 and 6-7, on these two aspects . Other criterion are more distributed
Environment Public Transport Comfort of dwelling To be lonely Place of work Equipment Others Total value
© CERTU / MOBILITY DEPARTMENT
Table E : Households expressing an intention of relocating ( INTD)
ZONE 1 ZONE 2 ZONES 3,4 ZONE 5 ZONES 6,7
Environment 38% 40% 40% 55% 52% Public Transport 15% 8% 9% 6% 7% Comfort of dwelling 24% 26% 22% 8% 7% To be lonely 0% 3% 7% 4% 6% Place of work 7% 7% 9% 4% 13% Equipment 11 % 14% 9% 8% 9% Others 6% 2% 5% 17% 6% Total value 72 88 91 53 54
As for all the population, the quality of the environment is always the first criteria . It is more important in external zones . In external zones (5 and 6-7), the comfort of the dwelling is really at a lower level, which is not the case in "central" zones ..
Table F : Households not expressing any intention of relocating (N INTD)
ZONE 1 ZONE 2 ZONES 3,4 ZONE 5 ZONES 6,7
Environment 35% 51% 36% 49% 51% Public Transport 11% 4% 10% 3% 6% Comfort of dwelling 24% 25% 21% 13% 19% To be lonely 3% 3% 4% 1% 3% Place of work 11% 3% 8% 6% 4% Equipment 11% Il % 7% 8% 6% Others 6% 10% 15% 1% 13% Total value 72 77 74 58 73
The results are the same than the previous.
IV.2.2. Results and analysis, zone by zone
Zones of the centre of the agglomeration (1,2) :
Zone 1 : " Central Business District of the agglomeration . A lot of services and commercial places (little places) . A lot of white collars households . " Zone 2 : " Near the CBD . Residential boroughs with collective buildings with
more than 20 dwellings, few proportion of activities"
Criterion considered by the households are very close from those previously identified. We can note that the criteria "environment" is at the same level in zones 1 and 2 . The criteria public transport supply PT is more important in zone 1.
© CERTU / MOBILITY DEPARTMENT
Households expressing an intention of relocating
Criterion about the choice of dwelling, zone 1 Others Equipment Work Lonely Comfort PT supply Environment
Criterion about the choice of dwelling, zone 2 Others 02% Equipment Work - 7% Lonely - 3% Comfort PT supply Environment 0% 10% 20% 30% 40%
The quality of environment is the first criteria : we understand that households expressing an intention of relocating and who live in these zones tend to favour a better quality of the environment for their dwelling : for example in term of calm, of green spaces, . . .This aspect concerns certainly people who are sensitive to traffic noise, pollution, . . .problems perceived
in a more accurate form when there are children in the household.
These households want to improve the comfort of their dwelling . In these zones of the centre of the agglomeration, many households are face to difficulties lie to the age of the buildings : no lift, no park, soundproofing, . . . So, they want to have a more comfortable and more functional dwelling.
The supply in term of equipment plays also a role . Households who live here, will certainly remove in zones where their dwelling will be close to public and household-life equipment, because they are accustomed to them .
14%
26%
© CERTU / MOBILITY DEPARTMENT
We can note the place of the PT supply in zone 1 . Households who live in this zone are close to a very good PT supply : subway, buses, . ..which have very good frequencies, with a good network in term of density, connexions, ... So, they use it for their home-work trips, for their leisure and those of their children . Because a good PT supply, and the demographic structure of this zone, households don't have a lot of cars (see table 22) . So, for the future they want to keep the advantage of the PT supply . These two last aspects explain certainly in great part why households expressing an intention of relocating from these zones to another will choice a dwelling always in zones of the centre of the agglomeration or very close to the centre (see table 23 ) . Thus, about 70% of households who live in zone I would like to live in central borough of the agglomeration (Lyon and Villeurbanne) . This choice concerns only 41% of the households who live in zone 2 . 23% want to go in zone 3 which concerns boroughs of the west side of the agglomeration (Ecully, Tassin, Ste-Foy, . . .), and which are close to the centre.
Table°22 : percentage of households who have 1 car and 2 cars or more by zone
ZONES one car 2 or more
1 48% 14% 2 52% 18% 3,4 53% 20% 5 48% 37% 6,7 46% 41% Source : EM 1995
Table°23 : choice of future zone for households who live in zone 1
zones % of households 01 69% 02 1 % 03 11% 04 4% 05 7% 06 1% 08 1% 10 4%
Table°24 : choice of future zone for households who live in zone 2
zones % of households 01 41% 02 2% 03 23% 04 2% 05 6% 06 8% 08 5% 09 1% 10 13% Source : RP survey
© CERTU / MOBILITY DEPARTMENT
Zone number :
zone 01 : Lyon, Villeurbanne
zone 02 : east of Lyon (de Rillieux à St-fons) zone 03 : west of Lyon (de Caluire A Pierre Bénite) zone 04 : east of the agglomeration (de Jonage à St-priest) zone 05 : south-west of the agglomeration
zone 06 : borough of the west, very far from the centre zone 07 et 08 : borough very close the Ain
zone 09 : south-east of the agglomeration zone 10 : others zones
Households not expressing any intention of relocating
Criterion about the choice of dwelling, zone 1 Others Equipment Work Lonely Comfort Fr supply Environment 11.0 6%° n 3% 24% 35% 11% 11% 0% 10% 20% 30% 40%
Criterion about the choice of dwelling, zone 2 Others Equipment Work Lonely Comfort PT supply Environment 10%0 11% n4% 51% 25% 0% 10% 20% 30% 40% 50% 60%
The criteria "quality of environment" is always the first. It is more important in zone 2, than in zone 1 . As households think about their choice based on the past, those who came in zone 1 didn't make their choice to have green spaces, no noise, . .., but to take advantage
© CERTU / MOBILITY DEPARTMENT
of the public's equipment and of the PT system, or to be close to their place of work (theses criterion make 33% of the choice in zone 1 and only 18% in zone 2).
Zone 2 is a more "residential" one, even if there are few important streets (as le Cours Emile Zola for example) . This quality of the environment played a role in the choice of the households . As in zone 1, households are interested by the proximity of equipment (schools, services, shops, . . .) of the CBD . So, these households want to take advantage of the equipment of the CBD, but without the disadvantage of the CBD (noise, lack of green spaces, etc .). See table 15 : the part of the "mixt" space is really more important in zone 1, than in zone 2 .
Table°25 : land-use in each zone
ZONES INDIV COLL MIXTE ACT
1 16% 18% 43% 23% 100% 2 30% 29% 13% 28% 100% 3,4 27% 22% 9% 42% 100% 5 71% 11% 5% 13% 100% 6,7 66% 4% 4% 25% 100% Source : RGP 90 (INSEE) With :
INDIV : residential individual COLL : residential collective
MIXT : residential + shops + services . .. ACT : activities
The comfort of the dwelling is an important criteria in the two zones. Zones near the centre of the agglomeration (3,4) :
"Area of employment, near the CBD, blue collar and employees, with a low level of income . A lot of foreign people and collective buildings ." "
Quality of environment is always the first criteria of the choice of the dwelling, but the comfort of the dwelling is also important.
© CERTU / MOBILITY DEPARTMENT
Households expressing an intention of relocating
Criterion about the choice of dwelling, zone 3-4 Others Equipment Work Lonely Comfort PT supply Environment 0% 40% 10% 20% 30% 40%
The situation is the same as in central zones, except that criterion are equally split (but not the quality of environment and the comfort of the dwelling) . In these zones, quality of environment is certainly lie to the security and the neighbourhood aspects . The comfort is also an important criteria, certainly because is low here : there are a lot of buildings with more than 20 dwellings (HLM), which implies displeasure : noise, size of the dwelling, ...
Table°26 : percentage of type of buildings with more than 20 dwellings shared by zone ZONES 1 16% 2 32% 3,4 38% 5 9% 6,7 5% 100% Source : RCP 90(INSEE)
© CERTU / MOBILITY DEPARTMENT
Households not expressing any intention of relocating
Criterion about the choice of dwelling, zone 3-4 Others Equipment Work Lonely Comfort prsupply Environment 0% 10% 20% 30% 40%
The results are closer from those of the zone 1, but not for the "equipment" . The quality of the environment is the first criteria, but it has a lower level than in external zones . These zones are the industrial core of the agglomeration : there are a lot of negative external
impacts (Saint-Fons, Gerland, Rillieux, . . .), and a lot of highways (ring, A7), which implies noise and pollution. See table 27.
Table n °27 : industrial employment shared by zone ZONES Heavy industry Light industry
1 11% 15% 2 14% 21 % 3,4 38% 26% 5 6% 11% 6,7 32% 27% 100% 100% Source : RGP 90 (INSEE)
The comfort of the dwelling plays a role, as the PT supply (as in zone 1) : many of the boroughs present in these zones have a good PT supply in term of buses and subway (line D) .
© CERTU / MOBILITY DEPARTMENT
Zones of residential's boroughs of the west agglomeration (5):
" Residential borough, single family homes . A lot of white collars, with many children . A lot of green spaces and few activities"
Quality of environment is an important criteria, others are not significant. Households expressing an intention of relocating
Criterion about the choice of dwelling, zone 5 Others Equipment Work Lonely Comfort PT supply Environment 0% 20% 40% 60%
As for the general assessment, quality of environment is a very important criteria . This one define the choice of dwelling in zone 5, and in others external zones (6-7) . Households living in the western agglomeration are enjoyed by the environment . So, when they want to relocate themselves, they are attached to find the same quality for their welfare (so they put
it in advance) . Others criterion are not very present . The comfort of the dwelling, doesn't plays an important role.
The main lesson we must kept at this level of the analysis concerns a switch between the criterion concerning the choice of dwelling for internal (1 ; 2 ; 3-4) and external zones (5 here) . For the first ones, the comfort of the dwelling is one of the most important criteria : these households experience the effects of the high concentration of people and activities which lead some negatives external aspects, as precise before. They also live in ancient dwellings (no park for cars, no lift, bad insulation, ...). So, the comfort of the future dwelling is considered as important . For the second ones, households are more lie to the quality of the environment, for the reasons we explain
© CERTU / MOBILITY DEPARTMENT
Households not expressing any intention of relocating
Criterion about choice of dwelling, zone 5
Others Equipment Work Lonely Comfort PT supply Environment 0% 10% 20% 30% 40% 50%
We can see, the place of the quality of the environment, which is not a surprise . The framelife is very good in these zone (calm, green spaces, . . .), and it is near the CBD . In this zone households are very lie to the quality of their life either by the comfort of their dwelling, certainly because this comfort is already good !
Zones very far of the CBD (6,7) :
Zone 6 : " Households with medium level of income, a lot of single family homes, few employment"
Zone 7 : " Zones far from the CBD, inhabitants with low income, no employment and activities "
The quality of the environment is still present here . The comfort of the dwelling hasn't a very important place.
Households expressing an intention of relocating
Criterion about the choice of dwelling, zone 6-7 9% Others Equipment Work Lonely Comfort PT supply Environment 0% 20% 40% 60%
© CERTU / MOBILITY DEPARTMENT
The logic of the households is the same for both zones (5 and 6-7) . So, the quality of the environment is the more important criteria . The distinction concerns the place given to the criteria concerning the proximity of the work . Zones 6-7 don't give few opportunities in term of employment, even if it concentrate 32% of the employment of the heavy basic industry of the agglomeration . So, households need to go outside their zone of dwelling to go to work. For their future location, they express the need to be close to their place of work.
Table 28 : Employment shared by zones
ZONES Heavy industry Light industry Basic Services Induced Services Small shops Big shops Educ. 1 11% 15% 33% 31% 29% 18% 17% 2 14% 21 % 18% 18% 18% 15% 29% 3,4 38% 26% 27% 26% 26% 32% 30% 5 6% 11% 8% 9% 9% 14% 10% 6,7 32% 27% 14% 17% 17% 21% 14% 100% 100% 100% 100% 100% 100% 100% Source : RGP 90 (INSEE)
Households not expressing any intention of relocating
Criterion about the choice of dweling, zone 6 7 13%
ni 6
%° .4%0 . 3%ç 19% -6% (51% 0% 10% 20% 30% 40% 50% 60%The results are the same than the previous ones, without the importance of the equipment . We find again the same logic between zones 5 and 6-7 : the place of the quality of the environment and of the comfort of the dwelling (but at an other level than for central zones). So, the real difference between these two types of zones concerns the lower importance of the public equipment : zone 6-7 has a low density, and fewer equipment than zone 5 : it seems logic that only few households say that they have choose their location (i .e. dwelling) here in relation with the equipment.
Others Equipment Work Lonely Confort PT supply Environment
© CERTU / MOBILITY DEPARTMENT
V. A CRITERION APPROACH TO ASSESS BEHAVIOUR LAWS
V.1 . Reasons for changing residence
Reminder: groups of criterion :
Criterion not concerning the zone but the dwelling : 1. Criterion not concerning the zone nor the dwelling : 4; 6 ; 7 Criterion concerning the zone and the dwelling : 3 ; (2) Criterion concerning the zone, not the dwelling : 5 ; 8; 9; 10
Households expressing an intention of relocating:
Criteria not related to the geographical zone, but instead to the housing unit:
The size of the housing unit is, in all cases, the top motivation behind moving out, yet the importance of this criterion is less pronounced in the outlying peripheral zones . This phenomenon can be explained by the average surface area of housing units, which is greater in these outlying zones.
Criteria related neither to the geographical zone nor to the housing unit:
First-time home ownership comes in second place in the majority of zones ; this motivational factor however remains more "diluted" in the outlying zones (6-7), most
likely due to the high rate of home ownership, even among the households seeking to move out . Other motivations thereby become more sharply defined in the relocation
decision-making process (for example, moving closer to the workplace) . This rationale is, logically, more applicable in the city's central core where typically younger households seeking a more stable family and professional situation tend to be located . This category of resident would then be looking to get settled more permanently.
Family reasons exert a rather major influence, except in Lyons' western districts (Zone 5). The central zones (1-2) exhibit younger households seeking to relocate into more suitable housing once a child has been added to the family . In the outlying zones, problems pertaining to schools and educational facilities as well as constraints imposed by driving distances could incite some households to move out. In the western Lyons neighbourhoods, family and professional stability is perhaps stronger than in the other zones.
The desire to live in a single-family home is one of the motivations getting the least attention by households . Yet, it should be noted that this motivational factor is somewhat more distinct in the densely-populated zones near the centre (3-4) as well as in the outlying zones (6-7) . In the former, the existence of many low-income, high-density housing projects most surely enhances the feeling for greater isolation, whereas in the outlying zones, a suburban residential development pattern is dominant, which likely serves as an incentive for resident households, in addition to real estate prices being attractive . In contrast, the true urbanites, those who prefer apartment living and who enjoy the amenities the city's historical centre has to offer, can be found in the central core zone.
© CERTU / MOBILITY DEPARTMENT
Criteria related to the geographical zone but not to the housing unit:
Proximity to the workplace represents a significant motivation, especially within the metropolitan area's outlying zones (5-7) . This feature is correlated with the limited employment opportunities available in these zones, with the exception of a few pockets, a condition which implies major constraints in terms of both trip-making and automobile-related facilities.
The "neighbourhood" criterion comes into play more decisively in the densely-populated zones near the city centre as well as in Lyons' western districts ; in both of these areas, problems related to safety and neighbours have taken on greater importance in addition to the negative image created by the presence of many factories . With respect to the city's western districts, the disadvantages stemming from a peripheral location are likely felt ; the car has become vital in the organisation of day-to-day life, and not exclusively for commute trips but for leisure trips as well, especially those that involve children.
Criteria related to both the geographical zone and the housing unit:
Both price and comfort play a key role in the central zones as well as in the outlying zones, and tend to get somewhat downplayed elsewhere : in the centre, this phenomenon is strongly tied to the problems arising in older buildings (the Croix-Rousse, Vaise and Saint-Jean districts) . Within the densely-populated zones near the centre, households either don't seem to be placing as much emphasis on housing comfort or show satisfaction with their present level of comfort.
In Lyons' western districts, a strong share of the households fall within the socio-economic category of professionals/managers and average incomes are higher ; residents generally enjoy a very high level of housing comfort . This criterion therefore does not appear critical in relocation decisions . The same result obtained in two separate zones, the centre and the western suburbs, does in effect stem from two distinctly different realities.
Concerning those households not expressing any intention of relocating:
Criteria not related to the geographical zone, but instead to the housing unit:
It's the size of the housing unit that ranks first among the reasons behind moving out in all zones, yet this observation turns out to be less pronounced in the outlying zones (5-7). Criteria related neither to the geographical zone nor to the housing unit:
First-time home ownership has proved to be a major relocation motivation in the central residential zone (2), the western districts and the peripheral zones . These three
geographical sectors do in fact account for the conurbation's most residential areas, though display varying characteristics . Attractive real estate prices play heavily in the outlying zones . In the city's western suburbs, it's undoubtedly the quality of the environment (calm, green space and open space amenity), along with proximity to the city centre, that have exerted the biggest influence on households in their relocation decisions . As for the central residential zone, real estate prices are extremely attractive for a centrally-located zone with good access to all facilities.
© CERTU / MOBILITY DEPARTMENT
The desire to live in a home is, quite logically, a more distinct motivation in the urban area's most residential zones (5-7).
Family reasons also play an important role, especially within the densely-populated zones near the centre due to these zones' favourable rental markets . This feature tends to be highly emphasised by households with lower incomes looking to move out once a child has been added to the family. The limited impact of this particular motivational factor in the city's central core can be explained by the greater frequency of older couples within this zone who have moved for other reasons, such as being closer to many urban facilities or reducing commuting distances.
Criteria related to the geographical zone but not to the housing unit:
The workplace meant a lot to those households which have moved away from the urban core, as it did to those which have moved out of the densely-populated zones near the city
centre . This finding is closely tied to the fact that these geographical areas comprise Lyons ' employment centres.
We can note, that a "neighbourhood-specific motivation has been absent in all zones. Criteria related to both the geographical zone and the housing unit:
Price and comfort factors are equally split across all zones, yet a major dichotomy between the two can be observed, as opposed to the case concerning households not expressing any intention of relocating . A plausible explanation appears difficult to find.
V.2. Criterion presents in the choice of housing
Households expressing an intention of relocating:
The quality of the environment is, across all zones, the number one criterion behind the choice of a future residence ; however, this factor remains more pronounced in zones located furthest from the city centre (5-7) . In these zones, households tend to favour environmental quality, whereas in the centrally-located zones, a split exists between environmental quality and housing comfort, the 2 "d-leading criterion in relocation decisions . Households residing in outlying zones do benefit from certain environmental advantages (quiet neighbourhoods, more space, abundance of parks and recreational areas); consequently, they're likely to seek to preserve their quality of life in a subsequent residence . In the central zones, households are subjected to the negative external impacts generated by a concentration of both population and human activity (noise, lack of space, pollution, etc .) and sometimes live in housing units that are not very functional and/or in need of renovation (no elevator, lack of parking spaces, poor insulation, etc .). The comfort of their future residence thus becomes of vital importance.
Public transit service is a decision criterion that's more heavily emphasised in the city's central core ; households there tend to be regular users of mass transit systems for many of their activities (both work and leisure) . Moreover, their rate of automobile ownership, as a whole, is relatively low . They thereby exhibit heightened sensitivity to the advantages of public transit and seek to retain this amenity in their new location.
© CERTU / MOBILITY DEPARTMENT
Isolation turns out to be a rather insignificant criterion, except in the densely-populated zones located near the centre ; and this is perhaps due to problems with neighbours or safety concerns.
Proximity to the workplace is a relatively strong criterion within the area's outlying zones: job opportunities are rare, except for certain pockets. Under these conditions, some
households elect to relocate in order to be closer to work.
Access to facilities plays a more significant role in the centrally-located zones (1-2). Households there do benefit from certain advantages due to the facilities available, and some would like to retain this advantage in their future housing situation.
Households not expressing any intention of relocating:
A discrepancy between the central zones (1-4) and the outlying zones (5-7) as regards the criteria pertaining to both environmental quality and housing comfort does indeed exist, yet it remains much less noticeable than for those households expressing an intention of relocating . Furthermore, the households moving into Zone 2 have favoured environmental quality, as is the case in the outlying zones . These zones (2 and 5-7) comprise the conurbation's residential districts and, as such, benefit from a better environment than do those zones home to greater economic activity (3-4) or the city's central core . In the latter, households tend to be influenced by other parameters : the level of comfort, proximity to the workplace, facilities, etc.
Access to public transit is also a criterion in choosing future housing which is, quite naturally, more pronounced in the central zone since this area has the best transit service in the entire conurbation . Similarly, proximity to the workplace has exerted a particular influence on those households moving away from the city's central core . This zone does in fact contain a large concentration of jobs, and especially in the services sector . Access to urban facilities is a criterion that's more marked in the central zones (1-2) and in the western suburbs . As for seeking a more isolated setting, this criterion is generally absent in all zones.
VI . Modelling the consumption of the dwelling
We can consider the dwelling of a household as a good : the unit consumed should be the meter square . What are the households 11 characteristics which define the variation of the meters squares used ? Do the behaviours are different between zone ?:
To give a response to these questions, some multiple regressions were built The results are very interesting.
© CERTU / MOBILITY DEPARTMENT
VI.1. Results for each zone
The variables concerning the households which play a role at a global level are : 1. the number of people by household (NPME),
2. the average income of the household (RM) 3. the age of the head of the household (AG1P),
The both first vary from 1 to 10 (ten classes of income), the age from 18 to 68. The results for each zone are consigned in the table presented page 42.
With this modelling approach, we can explain between 30% to 53% of the variability of the square meters used by households . We have, here, good results.
If we focus on the coefficients we obtain, we can make some remarks (don't forget the scale problem lie to the different variables, and which are reflected in the coefficients) :
- The number of people in the household plays a very important role in zone 1, and 3-4 : we can explain this situation by the facts previously defined : in zone 1, dwellings are not functional and there are a lot of young households . When the family grows up, they need to have a dwelling with a more important size : the first child occurs a big change . In zone 3-4, the problem is certainly different . It concentrate an important number of block of flat which have a lot of dwellings, supplied for people with low income. So, when the size of household grows up, they need to consume much square meters, because it's difficult for us to find a more comfortable dwelling. - The income plays an important role in zone 5 and 6-7 . This is not a surprise. Households living in zone 5 are white collars which have an important level of income, and they live in single family home : they have certainly a good elasticity income/size of the dwelling . This is certainly due to the relation income-patrimony. As they can support an important level of effort in a financial point of view, they can buy, or rent, a more important size of dwelling, even if they don't really need to have this level of consumption . Households of zone 6-7 are also living in single family home, but they are blue collars . The size of the dwelling is certainly sensitive to the income for us, because a lot of them are home ownership (67%), as we saw it previously . They are certainly able to support an important level of effort in a financial point of view for their home, even if they have lower consumption for other goods : they certainly have'nt an important patrimony, but they certainly give an important part of their income to reimburse their house . In this zone we also have, because its the country, parents who give their home to their children.
- The age of the head of the family plays a role in zone 2 and 5 . In these zones, we find the more comfortable apartments (zone 2) and the more comfortable single family home (zone 5) of the agglomeration . Perhaps, when the age of the head family grows up, he want to have a more important size for it's dwelling, because he already have a very good level of comfort .