THÈSE
En vue de l’obtention du
DOCTORAT DE L’UNIVERSITÉ DE TOULOUSE
Délivré par l'Université Toulouse 3 - Paul Sabatier
Présentée et soutenue par
Maria
Cristina CASTILLO ALVAREZ
Le 31 janvier 2019
Fractionnement des isotopes de
nickel lors de
l'adsorption à la surface de la calcite et coprécipitation
avec la calcite
Ecole doctorale : SDU2E - Sciences de l'Univers, de l'Environnement et de l'Espace
Spécialité : Sciences de la Terre et des Planètes Solides Unité de recherche :
GET - Geosciences Environnement Toulouse Thèse dirigée par
Eric OELKERS, Ghylaine QUITTE-LEVASSEUR et
Jacques SCHOTT Jury
Mme Rachel James, Rapporteur M. Olivier Rouxel, Rapporteur M. Marc Benedetti, Rapporteur M. François Chabaux, Examinateur
M. Eric Oelkers, Directeur de thèse Mme Ghylaine Quitte, Co-directeur de thèse
i
Nickel isotope fractionation during
adsorption on the calcite surface
and coprecipitation with calcite
iii
Abstract
The chemical and isotopic compositions of trace elements in calcite are the basis for most past temperature, atmospheric CO2, and ocean pH paleo reconstructions. The isotope compositions
of divalent metals incorporated into the calcite structure also have the ability to record valuable information that reflects the geochemical conditions of formation (Galy et al., 2002; Chang et al., 2004; Beard et al., 2012; Mavromatis et al., 2013; Fantle and Tipper, 2014; Mavromatis et al., 2015; Mavromatis et al., 2019). Moreover, as the equilibrium and kinetic partition of divalent metals between calcite and fluid exhibit contrasting behaviors, it can be expected that their isotope composition in calcite exhibits distinct trends (Schott et al., 2014).
Because Ni aqueous speciation strongly depends on fluid pH andalkalinity, the isotopic composition of Ni adsorbed on calcite surface and/or incorporated into the calcite lattice could provide information on the chemical environment in which this mineral originally formed. To calibrate this potentially useful tool, experiments were performed at 25°C to determine Ni isotope fractionation during 1) Ni adsorption on calcite surface as a function of solution pH (from 7.5 to 8.7) and 2) Ni coprecipitation with calcite at pH = 6.2, pCO2 = 1 atm as a function of calcite growth
rates (ranging from 10-8.2 to 10-7.3 mol m-2 s-1).
Results show that the equilibrium fractionation factor, Δ60Nisolid-solution, for Ni adsorption on
calcite is equal to -0.49 ± 0.16‰ and is pH – independent. Light Ni isotopes are also preferentially incorporated in calcite during its coprecipitation. The extent of Ni isotope fractionation decreases from -0.3 to -1 ‰ as the calcite precipitation rate increases from 10-8.2 to 10-7.3 .mol m-2 s-1. This behavior, due to the strong hydration of the Ni2+ aqua ion, may serve to approximate calcite precipitation rates and pCO2 in past oceans.
v
Résumé
Les compositions chimiques et isotopiques traces des métaux de traces dans la calcite sont à la base de la plupart des reconstructions de températures passées, de CO2 atmosphérique et de pH
océanique. Les compositions isotopiques des métaux divalents incorporées dans la structure de calcite ont également la capacité d’enregistrer des informations précieuses reflétant les conditions géochimiques de la formation. (Galy et al., 2002; Chang et al., 2004; Beard et al., 2012; Mavromatis et al., 2013; Fantle and Tipper, 2014; Mavromatis et al., 2015; Mavromatis et al., 2019). De plus, comme la répartition à l’équilibre et la cinétique des métaux divalents entre la calcite et le fluide présentent des comportements contrastés, on peut s’attendre à ce que leur composition isotopique dans la calcite présente des tendances distinctes (Schott et al., 2014).
Comme la spéciation aqueuse de Ni dépend fortement du pH et de l’alcalinité, la composition isotopique de Ni adsorbée à la surface de la calcite et / ou incorporée dans le réseau de calcite pourrait fournir des informations précieuses sur l’environnement chimique dans lequel ce minéral s’est formé à l’origine. Pour calibrer cet outil potentiellement utile, des expériences ont été effectuées à 25 ° C pour déterminer le fractionnement isotopique du Ni pendant 1) l'adsorption de Ni à la surface de la calcite en fonction du pH de la solution (de 7,5 à 8,7) et 2) la coprécipitation de Ni avec de la calcite à pH 6,2, pCO2 = 1 atm en fonction de taux de croissance de la calcite
allant de 10-8,2 à 10-7,3 mol m-2 s-1.
Les résultats montrent que le facteur de fractionnement à l’équilibre, solution Δ60Nisolid-solution,
pour l’adsorption de Ni sur la calcite est égal à -0,49 ± 0,16 et indépendant du pH. Les isotopes de Ni léger sont également incorporés de manière préférentielle dans la calcite pendant sa coprécipitation. L'ampleur du fractionnement isotopique du Ni diminue de -0.3 and -1 lorsque le taux de précipitation de la calcite augmente de 10-8,2 à 10-7,3 mol m-2 s-1. Ce comportement, dû à la forte hydratation de l’ion aqueux Ni2+, peut servir à estimer les taux de précipitation de la calcite
vii
Preface
This PhD study has been carried out at the Geosciences Environnement Toulouse (GET) laboratory at the Centre National de la Recherche Scientifique (CNRS) in Toulouse, France. This thesis consists of two chapters that are versions of manuscripts that have been prepared for submission to peer-reviewed academic journals (chapters 3 and 4), as well as a general introduction to the topic (chapter 1) a methodology section (chapter 2) and general conclusions of this work (chapter 5).
• Chapter 1 is a general introduction to the thesis that presents an overview of calcite precipitation kinetics, the interaction of calcite with divalent metals, particularly Ni, and how isotope fractionation is driven by mineral growth and metal incorporation. This chapter also includes a summary of the experimental studies comprised in this thesis.
• Chapter 2 presents a detailed description of the experiments and analytical techniques used during this thesis. This chapter details the steps undertaken to optimize previously published experimental protocols for isotope analysis. Notably, this chapter recounts the determination of the best choice of materials, reagents and initial conditions, as identified through preliminary tests and thermodynamic models. All the details of the experimental design are explained as well as the sample treatment prior to measurements and the principle of analytical techniques used for chemical and isotopic analysis used during this work.
• Chapter 3 presents the results of a study of Ni isotope fractionation during its adsorption onto the calcite surface. In this chapter, the experiments of adsorption as a function of time and pH and the Ni isotope fractionation occurring during them are explained in detail. The main results of this chapter were submitted to Geochimica et Cosmochimica Acta on the 24th September 2018 as a manuscript titled “Experimental determination of Ni isotope fractionation during Ni adsorption from an aqueous fluid onto calcite surfaces” that is found as annex 1 of this thesis. It is authored by Cristina Castillo Alvarez, Ghylaine Quitté, Jacques Schott and Eric H. Oelkers. The experimental and analytical work was performed
viii by myself, with suggestions of Jacques Schott. Measurements on the Neptune MC-ICP-MS were carried out in collaboration with Ghylaine Quitté. Data evaluation and interpretation was performed by myself, with aid from Jacques Schott and Eric H. Oelkers. The manuscript was written by myself and the co-authors.
• Chapter 4 presents the results of a study of Ni isotope fractionation during its coprecipitation with calcite as a function of precipitation rate. The experiments were designed and performed by myself with suggestions from Jacques Schott and Martin Voigt. Analytical work was performed by myself. Measurements on the Neptune MC-ICP-MS were carried out in collaboration with Ghylaine Quitté. Data evaluation and interpretation was performed by myself, with aid from Jacques Schott and Eric H. Oelkers.
• Chapter 5 includes a summary of this thesis, the general conclusions, and potential directions that this research can take in the future.
ix
Table of contents
Abstract ... i Résumé ... v Preface ... vii Table of contents ... i List of figures ... xvList of tables ... xix
Nomenclature ... xxi
Chapter 1. Introduction ... 1
1.1 Carbonates and their role regulating the ocean’s pH. ... 3
1.1.1 CO2 and the carbonic acid system in the ocean ... 3
1.1.2 Determination of seawater conditions in the past through proxies ... 4
1.2 Calcite growth from solution ... 5
1.2.1 Calcite ... 5
1.2.2 Thermodynamic principles of mineral formation ... 6
1.2.3 Reactions at the calcite surface ... 7
1.2.4 Mechanism of divalent metal incorporation ... 8
1.3 Isotope fractionation during mineral growth ... 13
1.3.1 Isotope notation ... 13
1.3.2 Isotope fractionation ... 15
1.3.3 Equilibrium fractionation ... 15
1.3.4 Equilibrium isotope fractionation during adsorption ... 16
x
1.3.6 Significance of the water exchange rate ... 17
1.3.7 Implications for paleo reconstructions ... 21
1.4 Nickel ... 22
1.4.1 Nickel isotopes ... 22
1.4.2 Nickel in the ocean ... 22
1.4.3 The motivation for studying Ni isotopic fractionation during its interactions with calcite 25 1.5 Scope of this thesis ... 25
Chapitre 1b. Introduction générale ... 27
Chapter 2. Experimental and analytical methods... 31
2.1 Starting materials ... 33
2.1.1 Reagents ... 33
2.1.2 Calcite ... 33
2.1.3 Aqueous Nickel stock solution ... 35
2.2 Experimental methods ... 36 2.2.1 Reactors ... 36 2.2.2 Thermodynamic calculations ... 37 2.2.3 Adsorption Experiments ... 37 2.2.4 Coprecipitation Experiments ... 40 2.3 Experimental protocol ... 45 2.3.1 Adsorption experiments ... 45 2.3.2 Coprecipitation experiments ... 45 2.4 Chemical analysis ... 46 2.4.1 Alkalinity and pH ... 47
xi
2.4.3 Isotope analysis ... 48
Chapter 3. Ni isotope fractionation during adsorption on the calcite surface ... 55
3.1 Introduction ... 57
3.1.1 Ni isotope imbalance in the ocean ... 57
3.1.2 Ni adsorption on calcite ... 57
3.1.3 Isotope fractionation during adsorption ... 58
3.2 Materials and methods ... 59
3.2.1 Materials ... 59
3.2.2 Thermodynamic calculations ... 61
3.2.3 Adsorption experiments ... 61
3.2.4 Determination of Ni concentration in the solutions and solids. ... 62
3.2.5 Determination of the isotopic composition of Ni in aqueous solutions ... 63
3.2.6 Determination of the isotopic composition of Ni in the solids ... 64
3.3 Results ... 65
3.3.1 Ni aqueous speciation ... 65
3.3.2 Adsorption isotherm ... 65
3.3.3 Adsorption as a function of time ... 66
3.3.4 Adsorption as a function of pH ... 70
3.4 Discussion ... 77
3.4.1 Comparison with previous results ... 77
3.4.2 Isotopes ... 79
3.4.3 Interpretation of fractionation factors ... 80
3.5 Conclusion ... 82
Chapter 4. Ni isotope fractionation during its coprecipitation with calcite ... 83
xii
4.1.1 Divalent metals as proxies of past seawater composition ... 85
4.1.2 Theoretical background ... 86 4.2 Methodology ... 87 4.2.1 Experimental set up ... 87 4.2.2 Sampling ... 89 4.2.3 Thermodynamic calculations ... 90 4.2.4 Chemical analysis ... 90
4.2.5 Calcite growth rates and Ni partition coefficients ... 90
4.2.6 Isotope Analysis ... 91
4.3 Results ... 92
4.3.1 Mineralogy and composition of the precipitated phases ... 93
4.3.2 Chemical composition of the reactive fluids ... 95
4.3.3 Ni partition between calcite and fluid DNi ... 97
4.3.4 Ni isotope fractionation during calcite precipitation ... 98
4.4 Discussion ... 100
4.4.1 Ni distribution coefficient between calcite and solution ... 100
4.4.2 Control of Ni isotope composition in calcite ... 101
4.4.3 Ni isotope fractionation factor as a function of calcite growth rate and implications for natural systems. ... 101
4.5 Conclusions ... 105
Chapter 5. General conclusions ... 107
5.1 Conclusions ... 109
5.2 Suggestions for future research ... 110
Chapitre 5b. Conclusions générales ... 113
xiii Annex ... 133
xv
List of figures
Figure 1. correlation between atmospheric CO2, oceanic pH, and oceanic pCO2 from NOAA:
Modified after R. A. Feely, Bulletin of the American Meteorological Society, July 2008. Source: NOAA PMEL graphic. Data: Mauna Loa Observatory and Station Aloha. ... 4 Figure 2. Speciation at the calcite-fluid interface. Figure taken from Pokrovsky et al.(2000). ... 8 Figure 3. Effect of pH on the distribution of Ca species. (Pokrovsky et al., 2002a) ... 10 Figure 4. Adsorption of divalent cations on calcite (top) and the relationship between the difference
in ionic radius between the Me2+ and calcite and their conditional equilibrium constant (bottom) from (Zachara et al., 1991) ... 11 Figure 5. Different rates of precipitation regimes proposed by DePaolo (2011). The figure shows
net precipitation rate over backward dissolution rate on the x axis and diffusion flux over precipitation flux on the y axis ... 17 Figure 6. Sketch of the Ni2+ aqueous ion ... 18
Figure 7. Stable isotope fractionation of a) Ca, b) Sr and c) Mg correlated with their partitioning between calcite and fluid. Watkins et al. (2017)... 20 Figure 8. Ni budget in the ocean. Modified after Gall et al. (2013). ... 24 Figure 9. SEM images of the synthetic calcite used in this study. ... 34 Figure 10. Isotopic composition of the first aqueous Ni stock solution. Each black square represents
a measurement of the Ni stock solution and the grey line represents the average of measurements determined to be -0.52 ± .17 ‰ ... 36 Figure 11. Effect of background electrolyte on the adsorption edge of Ni. The experiments shown
were conducted using different background electrolytes: grey circles represent experiments where NaCl was used, green squares show experiments performed using NH4Cl, and yellow triangles show experiments performed using NaNO3 as a background
electrolyte. All experiments were kept at 25oC, atmospheric pCO2, and 0.1 ionic strength.
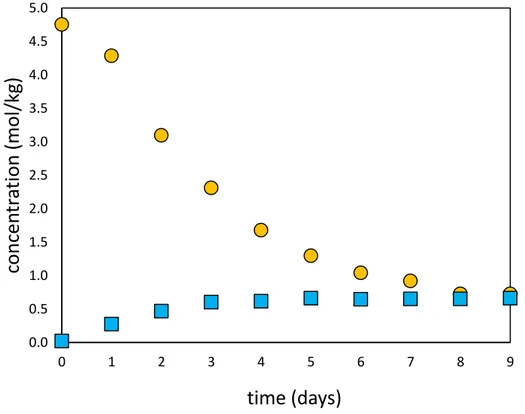
... 39 Figure 12. Results of C15 and C16 Ni co-precipitation experiments started without and with Ni in
the reactor at the beginning of the experiment. Blue squares correspond to experiment C15 where no Ni was present in reactors at the beginning of the run. Orange circles
xvi represent experiment C16 where Ni was added to the reactor prior to the beginning of the run. ... 42 Figure 13. Comparison of isotopic compositions of solids and solutions recovered from
coprecipitation experiments C15 and C16. Blue squares represent experiment C15 and orange circles represent C16. ... 43 Figure 14. Comparison of results of coprecipitation models with experimental data obtained for
experiment C29. The dashed line represents the modeled precipitation rate for experiment C29 and purple diamonds show measured precipitation rates. The modeled concentration of Ni in the reactor at a given time is shown by the a) the solid line when starting with 1 ppm Ni in the reactor and b) the dotted line if no Ni was present in the reactor at the beginning of the experimental run. Green circles show measured Ni concentrations for experiment C29. ... 44 Figure 15. Ni standards. Unprocessed standards were directly measured while the processed
standards were treated via the ion exchange chromatography process (without the addition of an experimental matrix). ‘NaCl processed’ represents the standard processed with the addition of NaCl. ‘ads processed’ refers to the standard processed with the addition of the matrix used in adsorption experiments. ‘cop’ exhibits the standards run during measurement of the coprecipitation experiments. A second standard is represented by the green circles, showing the composition of processed and not processed standards. ... 53 Figure 16. SEM image of aged calcite. They show the rhombohedral morphology of calcite and
crystal intergrowth. ... 60 Figure 17. Ni aqueous speciation in a 0.01 M NaCl CaCO3 solution at atmospheric pCO2. It was
calculated using PHREEQC with the minteq.v4 database. ... 65 Figure 18. Adsorption isotherm for Ni in 0.01 M NaCl at pH 8.3 and 25oC. ... 66 Figure 19. Ni adsorption as a function of time. Series 3K experiments were performed as a function
of time using 0.1M NH4Cl at pH 9.2 as the background electrolyte. The error associated
with these measurements is included within the symbol size. ... 67 Figure 20. Time dependent adsorption experimental set 8K. The figure shows a) percentage of Ni
adsorbed, b) Ni isotopic composition of fluid and adsorbed Ni, and c) fractionation between solid and fluid, as a function of time. The isotopic composition and
xvii concentration of adsorbed Ni was calculated via mass balance. Error bars represent 2 standard deviations. ... 68 Figure 21. Measured Ni adsorption as a function of pH. squares represent results of series 5P and
triangles correspond to results of series 6P. Both experimental series were performed at 25oC and atmospheric pCO2 using 0.01M NaCl as the background electrolyte... 70
Figure 22. Ni adsorption as a function of pH during series 9P. Colored symbols represent samples on which isotopic analysis was performed. Both experiments were performed at 25oC and atmospheric pCO2 using 0.01M NaCl as the background electrolyte... 71
Figure 23. Ni fractionation factor between calcite and containing fluid calculated using all experimental sets. Squares show the composition of fluids and circles composition of adsorbed Ni. The average fractionation factor using all experiments was calculated to be -0.45 ± 0.78 ‰ ... 73 Figure 24. Ni isotope fractionation between calcite and fluid as a function of pH (using all
experimental data). ... 73 Figure 25. Isotope fractionation factor between Ni in solid (blue squares) and Ni remaining in
solution (green circles). The arrow shows an average of Δ60/58Nicalcite-fluid = -0.49 ± 0.16
‰ and shaded area represents the isotopic composition of Ni stock solution. ... 76 Figure 26. shows the pH dependence of the fractionation factor between Ni adsorbed and Ni in
solution ... 77 Figure 27. Schematic illustration of the experimental design used for coprecipitation experiments:
the reactor was placed in a thermostatically controlled vessel, the aqueous solution was agitated using a suspended stirring bar. Equilibrium with a constant CO2 partial pressure
was achieved by bubbling presaturated air into the reactor with a peristaltic pump. .... 89 Figure 28. SEM image of the calcite seed material (left) and of the calcite recovered after
experiment C17 (right). The scale of the images is provided in the figure. ... 94 Figure 29. Ni molar fraction in calcite, XNi,, as a function of the steady state Ni2+ to Ca2+
concentration ratio in the aqueous solution. The error associated with these measurements is included within the symbol size. ... 95 Figure 30. Reactive fluid Ni, and Ca concentrations and alkalinity during experiment C15. These
results illustrate a typical fluid evolution of the flow experiments performed in this study with the eventual attainment of fluid steady state. The purple diamonds show the
xviii temporal evolution of calcium, while alkalinity is shown by the blue squares. Both are shown on the right scale. Nickel concentrations are represented by the green circles and its scale is shown on the left. Analytical uncertainty is included in symbol size. ... 96 Figure 31. Measured nickel partition coefficients as a function of the logarithm of the calcite
precipitation rate. The error associated with these measurements is included within the symbol size. ... 97 Figure 32. Ni isotope fractionation factors between calcite and the reactive fluid as a function of
the calcite precipitation rate. Both fractionation factors determined directly from measured solid compositions, and those generated by first calculating the isotopic compositions of the solids through mass balance constraints are shown. ... 98 Figure 33. fractionation factor between calcite and fluid for Ni, Mg, Sr, and Ca plotted as a function
of the calcite precipitation rate. The data plotted was obtained from Mavromatis et al. (2013), AlKhatib and Eisenhauer (2016), and Bohm et al. (2012.) ... 103
xix
List of tables
Table 1. Rate of exchange of water in the metal coordination sphere ... 19 Table 2. Ni inputs and outputs into the ocean ... 23 Table 3. Percentage of Ni recovered in different material reactor vessels during tube adsorption preliminary testing. ... 37 Table 4. Summary of adsorption experiments. ... 38 Table 5. Test of Ni precipitation due to supersaturation with respect to Ni-bearing solid phases. 40 Table 6. Summary of the Ni purification process ... 51 Table 7. Data used to calculate the Ni adsorption isotherm at 25oC and pH 8.3. ... 66
Table 8. Results obtained from experimental series 3K and 8K used to study time dependence of Ni adsorption on calcite ... 69 Table 9. Summary of adsorption experimental data used for calculating the fractionation factor between Ni adsorbed on calcite and Ni in solution ... 72 Table 10. Summary of results of experimental series 6P, 7P, and 9P designed to determine the fractionation factor of Ni during its adsorption on calcite as a function of pH. ... 74 Table 11. reported Ni sorption isotherms ... 78 Table 12. Summary of the results of the coprecipitation experiments. ... 93 Table 13. Results of isotopic analysis of fluids and solids recovered from the coprecipitation experiments. ... 99
xxi
Nomenclature
Abbreviations
AAS Atomic Absorption Spectrometry CPES Calcite pre equilibrated solutions IEC Ion Exchange Chromatography
ICP-OES Inductively Coupled Plasma Optic Emission Spectrometry KIE Kinetic Isotope Effect
MC-ICPMS Multi Collector- Inductively Coupled Plasma Mass Spectrometry LOD Limit of Detection
Me2+ Divalent metals
PE Polyethylene
PP Polypropylene
PTFE Polytetrafluoroethylene
PZC Point of zero charge
XRD X-Ray Diffraction
SCM Surface complexation Modelling
SD Standard Deviation
SEM Scanning Electron Microscopy
SE Standard Error
SI Saturation Index
xxii Symbols α Activity coefficient Å Armstrong δ delta Δ fractionation factor Ω saturation state I Ionic strength KSP Solubility product D Partition coefficient
S Specific surface area
T Temperature
t Time
Kwex water exchange rate
Kex exchange rate
Rp Precipitation rate
Xi Mole fraction of species i
1
3
1.1 Carbonates and their role in regulating ocean pH.
1.1.1 CO2 and the carbonic acid system in the ocean
Currently, a prevalent environmental issue is the increase in atmospheric carbon dioxide (CO2) due to the burning of fossil fuels. Throughout geologic time atmospheric CO2 concentrations
have fluctuated significantly; however, these concentrations have recently gained significant attention due to the sharp increase in CO2 release since the dawn of the industrial revolution in
1800. Since then, more than 500pg of anthropogenic carbon have been released into the atmosphere. Oceans have taken up about 48% of these emissions (Sabine et al., 2004; Mackenzie and Lerman, 2006) resulting in a shift in average pH of surface seawater from 8.2 to just under 8.1. This shift affects the carbonic acid system in seawater and ultimately affects marine carbonates. Thus, carbonate-water interactions are an essential component of climate regulation and the fate of fossil fuel derived CO2.
Oceans can absorb CO2 due to the fast exchange rate at the gas-liquid interface thereby
influencing atmospheric CO2 content and in turn Earth’s climate (Broecker, 2012). As atmospheric
CO2 concentration increases so does the amount of dissolved CO2 in seawater. This is observable
in data from the atmospheric observation station in Mauna Loa, Hawaii, where a correlation exists between atmospheric CO2 concentration and seawater pH (Fig. 1). Increasing dissolved CO2 in the
ocean changes the ratio of CO2 dissociated products and results in the formation of carbonic acid
(H2CO3); carbonic acid generation results in increased bicarbonate (HCO3-) and H+ ion
concentrations and decreased carbonate (CO32-) ion concentrations. This decrease in CO32- ion
concentrations changes its saturation state with respect to calcium carbonate (CaCO3) and
subsequently the precipitation rate of marine carbonates.
It is essential to understand the thermodynamic and kinetic factors controlling carbonate-water interactions in order to better understand their role in climate regulation. These factors play a major role in regulating the chemical composition of oceans (Van Cappellen et al., 1993) and are crucial in modeling geochemical processes that can be used to predict future environmental conditions (Morse and Mackenzie, 1990; Morse et al., 2007). However, a major problem in calibrating climate models is the need for information on past climate conditions. These data can be obtained through proxy reconstructions. Proxies provide a better understanding of past climates
4 and allow model sensitivity to be tested, thereby improving our ability to predict future climate change.
In proxy reconstructions, past climatic conditions that cannot be directly measured are correlated with another variable (Clarke and Wheeler, 1922). For example, correlations between seawater and atmospheric CO2 concentrations (as in Fig. 1) can be extended into the past through
combination with data obtained from air bubbles trapped in ice cores. Since atmospheric CO2 is
related to oceanic pH past values for atmospheric CO2 can be inferred by using oceanic pH as a
proxy.
Figure 1. correlation between atmospheric CO2, oceanic pH, and oceanic pCO2
from NOAA: Modified after R. A. Feely, Bulletin of the American Meteorological Society, July 2008. Source: NOAA PMEL graphic. Data: Mauna Loa Observatory and Station Aloha.
1.1.2 Determination of seawater conditions in the past through proxies
Carbonate sediments precipitated in the ocean preserve a number of elemental and isotopic proxies that are used to determine past oceanic temperatures and seawater conditions (Lea, 2013). The most studied paleo oceanographic conditions for which proxies are used are temperature,
5 salinity, primary productivity, nutrient content, and surface-water carbon dioxide concentrations; all are examined through the use of elemental and isotope ratios (Goldstein and Hemming, 2013).
The most used elemental proxies include Sr/Ca and Mg/Ca ratios of biologically precipitated carbonates for temperature (Marshall and McCulloch, 2002; Cléroux et al., 2008; Flannery and Poore, 2013), Cd/Ca ratios for nutrient utilization (Bryan and Marchitto, 2010), Ba/Ca ratios for alkalinity (Lea and Boyle, 1990), and Zn/Cd ratios in foraminifera shells for carbonate ion concentration (Marchitto, 2011). For isotopic ratios, the most commonly used include the stable carbon isotope composition of bulk organic matter or individual marine organic components as a proxy for past surface-water CO2 conditions (Tipple et al., 2010), the amount of δ18O in
foraminifera and corals to assess temperature fluctuations (Grossman and Ku, 1986), and B isotope ratios (δ11B) to determine changes in oceanic pH and alkalinity (Sanyal et al., 1996). There are
inherent issues with using these proxies to reconstruct paleo oceanographic conditions, these include poor resolution of proxy data as well as uncertainties related to the proxy itself. Therefore, efforts are focused towards the development of new and more robust paleo-proxy tools, such as the trace metal incorporation in marine sediments.
1.2 Calcite growth from solution
1.2.1 Calcite
Carbonates are sedimentary rocks found in essentially all marine systems and are characterized by the presence of the carbonate ion (CO32-) in their structure. Calcium carbonate
(CaCO3) is the most abundant carbonate and it possesses 2 main polymorphs: calcite and aragonite.
These polymorphs differ mainly in their systematic crystalline structure; calcite is rhombohedral and aragonite is orthorhombic. Calcite and aragonite solubility product (Ksp) are also different
from one another. Ksp is a thermodynamic constant that determines if a mineral and the coexisting
aqueous solution are at chemical equilibrium. In the case of CaCO3, the solubility product can be
described by the equation
6 where ɑ(i) represents the activity of the ith aqueous species.
At 25 oC and standard atmospheric pressure, Ksp of calcite and aragonite were
experimentally determined to be 10-8.48 and 10-8.34, respectively (Plummer and Busenberg, 1982). Calcite’s lower Ksp value means it is more stable than aragonite (Mucci, 1983; Morse and
Mackenzie, 1990). It also means that in oceans, the zone where aragonite can be found will be closer to the surface and more susceptible to changes in seawater chemistry. Because the product ɑ(𝐶𝑎2+) ∗ ɑ(𝐶𝑂
32−) decreases with increasing oceanic depth, almost all deep sea carbon rich
sediments are depleted in aragonite (Morse and Mackenzie, 1990).
1.2.2 Thermodynamic principles of mineral formation
Crystallization from solution is a fundamental process for mineral formation. According to classic crystallization theory, the process begins with a spontaneous clustering of ions or molecules leading to nucleation once a free energy barrier has been overcome for a critical cluster size. These clusters then grow by incorporation of ions/molecules resulting in the formation of crystals and minimization of system free energy (Meldrum and Cölfen, 2008; De Yoreo et al., 2015).
CaCO3 precipitation from aqueous solution is dominated by the reaction
Ca2+ + CO32- ⇌ CaCO3, which is the result of simultaneous precipitation (forward) and dissolution
(backwards) reactions of the mineral occurring at the solid-water interface (Plummer and Busenberg, 1982; Chou et al., 1989; Wollast, 1990). At equilibrium these rates are identical and one can write:
ɑ(𝐶𝑎2+)∗ɑ(𝐶𝑂 32−)
𝑘𝑠𝑝 = 𝛺 = 1
(2)
where ɑ(i) represents the activity of the ith aqueous species, and Ω stands for the solution saturation state with respect to the considered solid phase.
7 Ω <1 means that a solution is undersaturated and dissolution will tend to take place; alternatively, Ω >1 means a solution is oversaturated and the mineral may precipitate. In order for nucleation to take place, the saturation state commonly needs to be significantly higher than 1.
The attachment of ions to a mineral surface from an aqueous solution happens in steps. As oversaturation increases the spacing of the steps decreases and the step velocities increase causing a more rapid growth rate. The velocity and spacing of these steps and density of kink sites on the crystal surface determine the mineral growth rate (De Yoreo and Vekilov, 2003; Joswiak et al., 2018). The rate at which minerals grow can be described in terms of Ω by the equation:
𝑅 = 𝑘 ∗ (Ω − 1)𝑛 (3)
where R is the precipitation rate (normalized to the reacting surface area)
k is the rate constant, and n is the order of the overall reaction obtained from fitting the experimental
data to the equation.
1.2.3 Reactions at the calcite surface
Three steps are required for crystal growth from solution: 1) diffusion of ions to the mineral-fluid interface, 2) adsorption on the surface of the mineral, and 3) incorporation into the bulk structure. The exchange of ions between mineral and fluid occurs at the mineral-fluid interface which occupies the outermost few monolayers of a surface. Composition of this interface can be different from that of the bulk lattice as has been shown by high-resolution X-ray reflectivity measurements (P. Fenter et al., 2000; P Fenter et al., 2000; Schlegel et al., 2002).
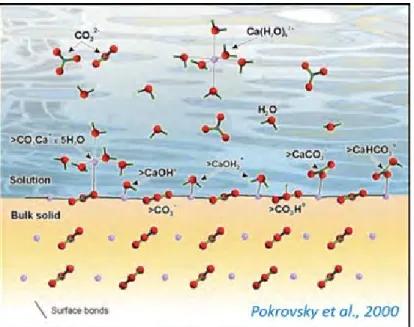
The speciation and charge at the mineral surface can be described using surface complexation models (SCM) that use thermodynamics to describe the formation of hydrolyzed species on the calcite surface (fig.2, Van Cappellen et al. 1993; Pokrovsky et al. 2000). Formation of surface species depends on aqueous solution pH. There is a point at which the total net charge at the calcite surface is 0, (usually around 8.3) termed the point of zero charge (PZC). In more acidic solutions the surface is positively charged and dominated by protonated surface species; contrastingly, in alkaline solutions, it is dominated by negatively charged surface species (Hohl et al., 1980; Davis and Kent, 1990; Pokrovsky and Schott, 2002).
8
Figure 2. Speciation at the calcite-fluid interface. Figure taken from Pokrovsky et al.(2000).
Surface complexation models (SCM) developed by Van Cappellen et al. (1993), Pokrovsky et al., (2000), and Pokrovsky and Schott (2002) assume there are two primary hydration sites on the calcite surface: >CaOH0 and >CO3H0 (where > represents a surface species). Each of these
primary hydration sites has 1:1 stoichiometry. These sites are assigned a +1 or −1 charge in >Ca1+ and >CO31− since the charges are partially satisfied by bonds to the underlying bulk structure.
Consequently, hydration and adsorption of calcite constituent ions (Ca2+ and CO32–) from the
aqueous solution result in the formation of the following surface species: >CO3H0, >CO−3>CaCO3
-, >CaOH2+, >CaO−, and CaHCO30. The existence of such species has been demonstrated using
spectroscopic methods (Stipp and Hochella, 1991). In calcite supersaturated aqueous solutions, the successive protonation/deprotonation of these sites and reactions with ions leads to precipitation.
1.2.4 Mechanism of divalent metal incorporation
Calcite has a high affinity for divalent metals (Me2+; Davis et al. 1987; Zachara et al. 1991;
Lakshtanov and Stipp 2007), which are incorporated in the calcite lattice by substituting for a Ca2+
ion. This makes calcite a significant sink for elements such as Ca, Mg, and Sr (Wilkinson and Algeo 1989; Tipper et al. 2006; Krabbenhöft et al. 2010; Pearce et al. 2015). Thus, calcite has an important impact on the mobility and geochemical cycles of trace metals in aquatic environments
9 (Van Cappellen et al., 1993; Gaskova et al., 2009; Villegas-Jiménez et al., 2009). The adsorption of Me2+ on the calcite surface can also affect the mineral growth rate and growth mechanism (Katz, 1973; Meyer, 1984; Davis et al., 1987; Freund et al., 2001; Wasylenki et al., 2005).
The main ways in which calcite interacts with metals is through adsorption on the calcite surface and incorporation into the bulk structure. The sorption and incorporation processes are tightly interrelated since adsorption is a necessary intermediate step for all incorporation reactions and both mechanisms are controlled by the same chemical factors (Curti, 1999).
1.2.4.1 Adsorption
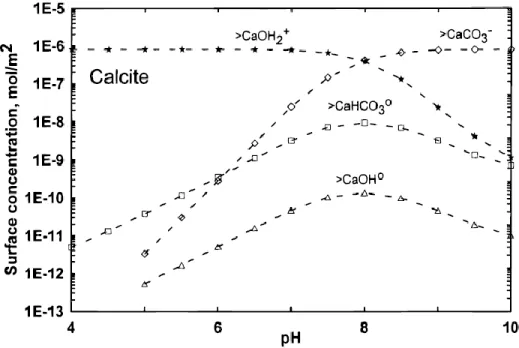
Adsorption is the surface-limited accumulation of an adsorbate as a surface complex without the development of a three-dimensional structural arrangement (Sposito, 2009). It is attained via complexation on the hydrated surface (Zachara et al., 1991; Pokrovsky et al., 2000; Lakshtanov and Stipp, 2007). The main factor affecting the adsorption of ions on calcite is the pH of the calcite containing aqueous solution; this affects both the surface speciation of calcite (Fig. 3) and the aqueous speciation of the Me2+.For this reason, most of the studies on Me2+ adsorption are conducted as a function of pH of the reactive aqueous fluid.
The pH dependence of surface-exchange reactions is consistent with the adsorption behavior of Me2+ on calcite (Fig. 4). The sorption of divalent metals generally increases with increasing pH (Zachara et al., 1991; Hoffmann and Stipp, 2001; Lakshtanov and Stipp, 2007; Belova et al., 2014; Pokrovsky et al., 2014) and mass of the solid (Belova et al., 2014) and decreases with ionic strength (Lamana, 2010).
Various studies have suggested that the surface of calcite is in exchange equilibrium with major and minor solutes in the aqueous phase (Möller and Sastri, 1974; Mucci and Morse, 1985; Villegas-Jiménez et al., 2009). Competition with such cations is another factor which affects the sorption behavior of metals. In the case of Ca, studies by Kornicker et al. (1985) and Zachara et al. (1991) determined that the increase in sorption caused a decrease in the aqueous concentration of Ca maintained by calcite solubility.
10
Figure 3. Effect of pH on the distribution of Ca species. (Pokrovsky et al., 2002a)
The higher affinity that some Me2+ show for the calcite surface can be correlated to the difference between the ionic radii of the metals and that of calcium. In particular, Me2+ with ionic radii smaller than calcite easily substitute into cation sites in bulk calcite (Reeder and Ribbe, 1983). The smaller the difference in size between the metal and Ca, the smaller the disruption to the atomic structure and the affinity of the Me2+ for calcite. For cations larger than Ca, only a certain fraction
can be tolerated before aragonite becomes the stable phase, so their fractional sorption is much smaller (Zachara et al., 1991).
Sorption is quantified using the distribution coefficient Kd, which is defined as the ratio of the
concentration of the metal sorbed on the solid to the metal in the aqueous solution in equilibrium with calcite (Jenne et al., 1979; Gomes et al., 2001):
𝑘𝑑 =[𝑀𝑒]𝑎𝑑𝑠𝑜𝑟𝑏𝑒𝑑 [𝑀𝑒]𝑠𝑜𝑙𝑢𝑡𝑖𝑜𝑛
(4)
11
Figure 4. Adsorption of divalent cations on calcite (top) and the relationship between the difference in ionic radius between the Me2+ and calcite and their conditional equilibrium constant
12 The desorption of Me2+ correlates well with its hydration energy. Metals that dehydrate soon after adsorption create a local structure similar to a surface precipitate while those with high hydration energies remain hydrated until their incorporation into the structure. The more strongly hydrated metals are also the most desorbable (Zachara et al., 1991).
1.2.4.2 Coprecipitation
Coprecipitation occurs whenever foreign species are trapped in the body of a
precipitating solid (Curti, 1977). In the case of Me2+ coprecipitation with calcite, it entails its incorporation into the bulk solid by replacing a Ca2+ cation with a Me2+ ion (Lakshtanov and Stipp, 2007). Coprecipitation is a more permanent removal of metal cations from the fluid than adsorption since they will remain in the solid until it dissolves (Román-Ross et al., 2006).
The affinity of a Me2+ for the solid is measured by the partition coefficient (D
Me). The
partitioning of elements between calcite and the reactive fluid is commonly described using thermodynamics by the Henderson and Kracek (1927) :
𝐷𝑀𝑒 = 𝑋𝑀𝑒 𝑋𝐶𝑎
[𝐶𝑎] [𝑀𝑒]
(5)
where Xi represents the mole fraction of the ith species in the solid and [i] stands for the
concentrations of the ion in aqueous solution.
The higher the 𝐷𝑀𝑒, the more the metal tends to go into the solid. However, if crystal growth
is rapid, adsorbed ions may be buried into the freshly precipitated material resulting in solid concentrations that deviate substantially from those predicted for equilibrium partitioning between the crystal and its surroundings (Hofmann et al., 2012). The effectiveness of this entrapment process depends on the interaction between the growth rate of the crystal and the diffusivity at the boundary layer. It follows that the partition coefficient depends on the precipitation rate and approaches 1 with increasing precipitation rate (Lakshtanov and Stipp, 2007).
13
1.2.4.3 Coupled adsorption/precipitation models
Two models involving coupled adsorption/precipitation processes describe the sorption behavior of metal ions on carbonate surfaces (Comans and Middleburg, 1987; Davis et al., 1987). Both models postulate that metal ions first bind to the calcite surface through an adsorption reaction and then dehydrate to create a surface co-precipitate. These models differ in their conceptual view of the coprecipitation reaction.
During fast crystal growth, the adsorption process is often controlled by aqueous diffusion. At high precipitation rates, a growing crystal may trap species at the ratio of their diffusivities in the bulk aqueous solution. The effectiveness of this entrapment process is determined by the growth rate of the crystal and diffusivity in the boundary layer of the crystal (Wang and Xu, 2001). During slow precipitation, when diffusion is not limiting, adsorption is nearly at equilibrium and DMe approaches its equilibrium value.
1.3 Isotope fractionation during mineral growth
1.3.1 Isotope notation
Equilibrium, in terms of isotope fractionation, is parallel to the concept of chemical equilibrium and requires that the forward and backward reaction between two phases occur simultaneously and at the same rate. Therefore, the same equations that can be used to describe a chemical reaction can be used to describe isotope exchange reactions. However, it should be noted that the time required to reach isotopic equilibrium can differ from that required to reach chemical equilibrium (Blanchard et al., 2017).
Isotope exchange in carbonates can be described by:
MeCO3 + Me2+* ↔ MeCO3* + Me2+ (6)
where * denotes the component enriched in the heavy isotopes
The equivalent of Keq, the equilibrium constant of a chemical reaction, is the equilibrium
14 𝛼𝐴−𝐵 = 𝑅𝐴
𝑅𝐵
(7)
where Ris the ratio of heavy to light isotope in substance A or B
Kinetic fractionation occurs in an incomplete process where the light isotopes exhibit faster reaction rates than the heavy isotopes. For example, during diffusion, the molecules containing lighter isotopes will move and potentially react faster. They can be described by first order kinetics for two competing isotope reactions:
𝐴→ 𝐵 𝑘 (8)
𝐴∗→ 𝐵𝑘∗ ∗ (9)
where A and B are the light or heavy (*) isotopes of substance A and B, and k corresponds to the rate constants for the light (k) and heavy (k*) isotopes
Then the fractionation factor α corresponds to the ratio of the rate constants as defined by:
𝛼
𝐴−𝐵=
𝑘
𝑘
∗(10)
In the conventional delta notation ( Urey 1950), the isotope composition of component A (or B) is expressed relative to that of a standard as per mil deviation (‰):
𝛿𝐴 = [( 𝑅𝐴 𝑠𝑎𝑚𝑝𝑙𝑒
𝑅𝐴 𝑠𝑡𝑎𝑛𝑑𝑎𝑟𝑑) − 1] ∗ 1000
(11)
15
∆𝐴−𝐵= 𝛿𝐴 − 𝛿𝐵 (12)
The fractionation factor can be evaluated via abinitio calculations from reduced partition fraction ratios (RPFR) β of the considered phase so that:
∆𝐴−𝐵= 1000(𝐿𝑛β𝐵− 𝐿𝑛β𝐴) (13)
1.3.2 Isotope fractionation
The isotopic composition of elements incorporated into minerals provides information on the mechanisms of chemical reactions and their rates in geochemical processes such as redox transformations, sorption, complexation, and dissolution and precipitation. These processes cause a modification in the relative abundance of the isotopes of an element within reactants and products (Urey, 1947).
Fractionation of stable isotopes between two phases can be attributed to a small difference in masses of the isotopes resulting in small variations in their thermodynamic and kinetic properties; therefore, it can be dominated by either equilibrium (thermodynamic) or kinetic factors (Urey, 1947; Bigeleisen, 1965; Criss, 1999; Schauble, 2004). In general, isotope fractionation between any two phases or compounds within a phase can be attributed to some combination of mass dependence of equilibrium partition coefficients, diffusion coefficients, and reaction rate constants (Watkins and Watson, 2017).
1.3.3 Equilibrium fractionation
During equilibrium fractionation, it is expected that both the forward and backward reaction rates are greater for the lighter isotopes because the zero-point vibrational energy and the mean molecular velocity of light isotopes are higher than those of heavy isotopes (e.g. Bigeleisen 1965; O’Neil 1986; Criss 1999). In addition, heavier isotopes form molecules with higher bonding energies which are more difficult to break. In general, the main processes responsible for thermodynamically driven fractionation of metal isotopes could change oxidation state and/or
16 differentiate in coordination number or bonding geometry since they can modify the bond vibrational frequencies of atoms (Bigeleisen, 1949; Schauble, 2004).
Isotope partitioning at thermodynamic equilibrium depends only on temperature and the identity and composition of the phases. It reflects the slight change of free energy between two phases containing different isotopes of the same chemical element. Since it is crucial that the precipitation reaction rate exceeds the dissolution reaction rate for mineral growth to occur, it is only possible to observe equilibrium isotope fractionation if the reaction is slow enough so that there are no ionic transport limitations to the surface and the rate of species attachment to advancing steps is slow.
1.3.4 Equilibrium isotope fractionation during adsorption
Analyzing metal isotope ratios in solution and of sorbed species allows for the determination of the fractionation factor (Δ) associated with sorption (Wiederhold, 2015). Fractionation during sorption is mostly governed by differences in the environment of the sorbed species compared to its aqueous counterpart.
Theoretical and experimental calculations have shown isotope fractionation within aqueous species is correlated to their bond length. Generally, chemical species that have lower coordination numbers have shorter bond lengths and preferentially incorporate the heavier isotopes of an element (Schauble, 2004; Zeebe, 2005; Bogatko et al., 2013; Colla et al., 2013; Huang et al., 2014). Isotope fractionation between the common species present in solution has also been investigated based on ab initio calculations and experimental measurements (Fujii et al., 2011; Fujii et al., 2014), and the isotopic fractionation between several aqueous species of a given metal have been calculated by Density Functional Theory (DFT).
1.3.5 Kinetic fractionation
Kinetic isotope effects are caused by the different reaction rates of light and heavy isotopes and are only preserved in incomplete processes. The influence of kinetic effects on the isotopic composition depends strongly on the relative extent of reaction progress (Wiederhold, 2015).
Kinetic processes have an important effect on the isotopic composition of an element during mineral precipitation and need to be accounted for to have a better understanding of its chemical and biochemical cycles (Anbar and Rouxel, 2007; Baskaran, 2011). Kinetic isotope effects may be
17 caused by diffusive transport to the mineral-fluid interface as well as the mass dependence on species attachment rate at the solid surface. DePaolo (2011) suggested different regimes of mineral precipitation (Fig. 5) based on the limiting step of the reaction. For regimes 2, 3, and 4, the kinetic effects caused by diffusion and rates of attachment to growth sites will play a role in the isotopic fractionation.
Figure 5. Different rates of precipitation regimes proposed by DePaolo (2011). The figure shows net precipitation rate over backward dissolution rate on the x axis and diffusion flux over precipitation flux on the y axis
1.3.6 Significance of the water exchange rate
The water exchange rate (kwex) of an aqueous metal species measures the lifetimes of water
molecules in its inner-coordination shell (Wang et al., 2007). It is equivalent to 1/τ, where τ is the residence time of water molecules in the first hydration sphere surrounding the cation (Bourg et al., 2010) so that a low kwex implies that water molecules are more strongly attached to the cation.
(Fig. 6) Water-exchange rates are key indicators of chemical reactivity in aqueous coordination compounds and are fundamental in understanding the reactivity of these ions in chemical and
18 biological systems; they are involved in phenomena such as adsorption, electron transfer, and surface charging (Helm and Merbach, 1999; Wang et al., 2007).
Figure 6. Sketch of the Ni2+ aqueous ion
Of the three steps required for crystal growth from solution (diffusion of ions to the mineral-fluid interface, adsorption on the mineral surface, and incorporation into the bulk structure), the last two require a progressive desolvation of the ions. While the origin of kinetic isotopic and trace element fractionation during calcite precipitation is not fully understood, several studies associate it with dehydration of dissolved ions during the incorporation step and rehydration during the coupled dissolution step. It has even been suggested that ion desolvation is the main mechanism causing fractionation of free aqueous metal cations with the rate of exchange of H2O in the metal
following an inverse power law mass dependence (Hofmann et al., 2012):
𝑘𝑤𝑒𝑥.𝑗 𝑘𝑤𝑒𝑥,𝑖 = (
𝑚𝑖
𝑚𝑗)
−𝛶 (14)
19 The rearrangement of the coordination shell necessary for the metal to have access to the calcite surface is not normally a rate limiting step because water exchange in the first hydration shells is usually fast. However, the Me2+ desolvation rates relative to Ca is critical; as the desolvation rate of Ca2+ is the rate limiting step for calcite growth, it would be difficult formetals such as Mg and Ni which desolvate at rates 3-5 orders of magnitude slower than Ca (Table 1) to get totally desolvated in bulk calcite except under very slow calcite precipitation rates (Mavromatis et al., 2013).
Table 1. Rate of exchange of water
in the metal coordination sphere
In any reaction where a chemical bond must be broken, it is expected that the rate of bond breaking, and the rate of reaction, will be higher for the light isotopic species (Zeebe and Wolf-Gladrow, n.d.; Criss, 1999). Experimental (deBoer R. B., 1977; Mucci, 1983), theoretical (Pokrovsky and Schott, 2002; DePaolo, 2011; Hofmann et al., 2012), and molecular simulation studies suggest that the kinetics of Me2+ attachment/detachment to and from the calcite surface is related to the rate of exchange of water molecules.
Metal (Me2+) log k wex (s-1) Cu 9.5 Ba 9.2 Sr 8.9 Ca 8.8 Cd 8.2 Zn 7.8 Mn 7.0 Fe 6.3 Co 5.8 Mg 5.4 Ni 4.3
20
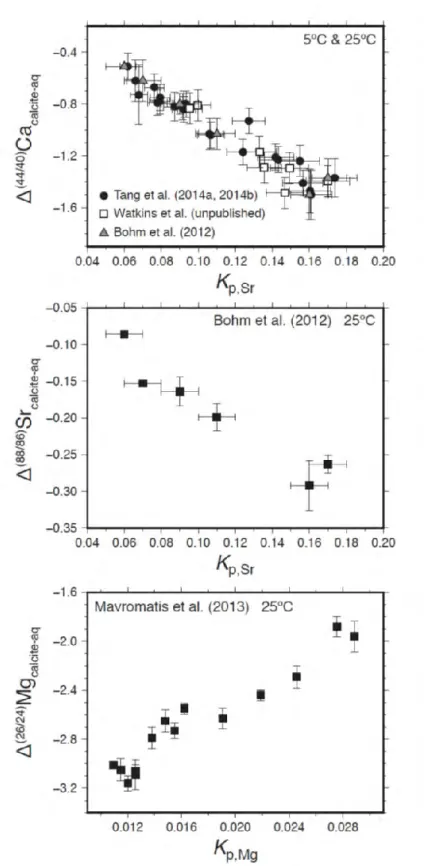
Figure 7. Stable isotope fractionation of a) Ca, b) Sr and c) Mg correlated with their partitioning between calcite and fluid. Watkins et al. (2017)
21 As an example, the extent of strontium isotope fractionation in calcite increases with calcite precipitation rate (Böhm et al., 2012) while the extent of magnesium isotope fractionation decreases with calcite precipitation rate (Mavromatis et al., 2013; Saenger and Wang, 2014). Fig. 7 shows the isotope fractionations of two trace metals (Sr and Mg) incorporated into inorganic calcite compared to that of Ca2+. Its variation with growth rate leads to correlations between metal isotope fractionations and metal partitioning. The differences in the desolvation rates of these metals relative to Ca2+ may be the cause of such trends. For instance, Sr2+ has a desolvation rate similar to Ca whereas Mg2+ has a desolvation rate more than 3 orders of magnitude slower (Table 1, Nielsen 1984). Furthermore, infrared spectra of calcite grown at different rates confirm the incomplete desolvation of Mg2+ ions at higher growth rates based on the presence of water in the infrared spectra of fast-grown calcite (Mavromatis et al., 2013).
1.3.7 Implications for paleo reconstructions
Isotope exchange reactions between CaCO3 and seawater are the basis for past
temperature, atmospheric CO2, and ocean pH paleo reconstructions; such reconstructions utilize
oxygen, carbon, and boron isotopes, respectively. The isotopic compositions of Me2+
incorporated into the calcite structure also have the ability to record valuable information reflecting the geochemical conditions of formation(Galy et al., 2002; Chang et al., 2004; Mavromatis et al., 2013; Mavromatis et al., 2019) Moreover, as the equilibrium and kinetic partition of these elements between calcite and fluid exhibit contrasting behaviors, it can be expected that their isotope composition in calcite exhibits distinct trends (Schott et al., 2014).
Traditionally, temperature is considered to be the main factor controlling the degree of isotope fractionation (Emrich et al., 1970). However, it has been suggested that temperature plays only a secondary role in fractionation during mineral growth (Lemarchand et al., 2004). Several experimental studies show other processes such as the mineral growth rates (Mavromatis et al., 2013), mineralogy (Romanek et al., 1992), metal desolvation rates (DePaolo, 2011), biologically mediated effects (Pogge von Strandmann, 2008; Hippler et al., 2009), and fluid saturation state with respect to precipitating solid (Lemarchand et al., 2004) also have an
important effect on isotope fractionation. These studies could provide important information on the geochemical conditions of mineral formation.
22 During mineral precipitation from solution at high precipitation rates, the system is not at isotopic equilibrium. The preferential incorporation of light isotopes combined with the precipitation rate dependence that has been shown in several studies (Böhm et al., 2012; Mavromatis et al., 2013) suggests that the fractionations are mostly kinetic in origin. These deviations from equilibrium fractionation could additionally provide information on geochemical processes and paleoenvironments. This thesis focuses on the incorporation of Ni in calcite. This element is of special interest due to the slow desolvation rate it exhibits; it demonstrates the slowest of desolvation rate of all Me2+ discussed in this chapter. Therefore, it has the potential to reveal valuable information on the precipitation rate of Ni bearing calcite.
1.4 Nickel
1.4.1 Nickel isotopes
Naturally occurring Ni is composed of five stable isotopes (58, 60, 61, 62, and 64) with
58Ni being the most abundant (68.08%). Ni isotope compositions are conventionally reported
relative to the U.S. National Institute of Standards and Technology Standard Reference Material 986 (NIST SRM 986) international standard. While most past work on Ni isotopes has centred on cosmochemistry, Ni isotope compositions for silicate Earth, sediments, and water samples have also been characterized. This study focuses on existing oceanic Ni data.
1.4.2 Nickel in the ocean
Nickel in the ocean exhibits nutrient-like behavior as its dissolved concentration ranges from of 2 nmol/kg at the surface to 12 nmol/kg at greater depths with an estimated average of about 8 nmol/kg (Sohrin and Bruland, 2011). It is a bioessential trace metal, and 10–60% of Ni in coastal and open-ocean is complexed with organic ligands (Donat et al., 1994; Saito et al., 2004). In seawater, the dominant Ni species is Ni2+, the only stable oxidation state over the pH range of most
natural waters.
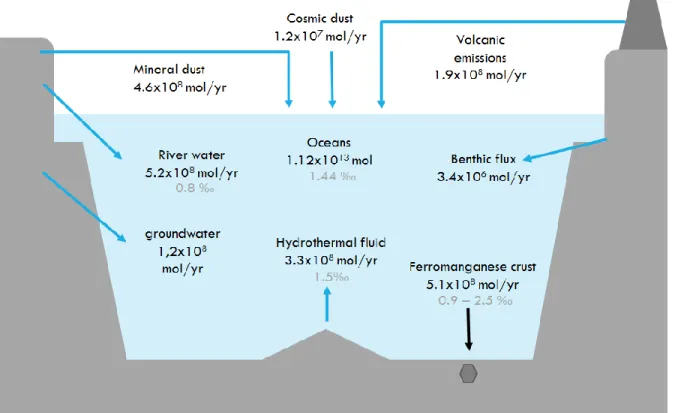
The global marine Ni budget is controlled by the input of dissolved Ni from river water, dissolution in the oceans of riverine and atmospheric transported particulate material, Ni scavenging by marine minerals sedimentation, and geothermal activity (Sclater et al., 1976; Li et al., 2003; Jeandel and Oelkers, 2015). The main sink of Ni in the ocean is ferromanganese crust.
23 The isotopic composition of seawater was determined by Cameron and Vance (2014) who reported values of δ60Ni = 1.44 ± 0.15. Interestingly, the isotopic composition of Ni in the oceans
is nearly homogeneous across all ocean basins. This can be explained by the significantly longer residence time of Ni, about 30,000 years (Cameron and Vance, 2014), compared to the mixing time for global oceans of about 2,000 years (Jenkins, 2003). Along different depths in a study of the Black Sea, variation in isotopic composition of Ni is very substantial, at about 1.5‰, requiring very large isotope effects associated with the sources and sinks of Ni (Vance et al., 2016).
Rivers, the main input of Ni into the ocean, are isotopically heavier than the crust from which they originated, meaning that light Ni isotopes are probably retained during soil formation (Ratié et al., 2015). They been determined to have an annual δ60Ni average of +0.80‰ and to show
significant seasonal variability between +0.29 and +1.34‰ (Cameron and Vance, 2014). It should be noted that while compared to the crust, rivers provide isotopically heavy inputs into oceans, Ni in oceans is about 0.6‰ heavier than Ni in rivers.
Table 2. Ni inputs and outputs into the ocean
Ni content δ60Ni
(moles) ‰
seawater 1.12 x10¹³ 1.44
Ni in/ out δ60Ni
(mol per year) (‰)
Inputs river water 5.20x10⁸ 0.8 mineral dust 4.60 x10⁸ cosmic dust 1.20 x10⁷ volcanic emission 1.90 x10⁸ benthic flux 3.40 x10⁶ groundwater 1.20E x108 hydrothermal fluid 3.30 x10⁻⁸ 1.5 Outputs ferromanganese crust 5.10 x10⁻⁸ 0.9-2.5
24
Figure 8. Ni budget in the ocean. Modified after Gall et al. (2013).
Based on isotopic mass balance considerations, a source of isotopically heavy Ni in modern oceans is missing. (Cameron and Vance, 2014). It has also been speculated that the effects of Ni sorption onto Fe/Mn oxide surfaces, which is a major sink of Ni in the ocean (Peacock and Sherman, 2007), could explain, at least in part, the isotopic composition of seawater since it favors enrichment of lighter isotopes (Wasylenki et al., 2015; Gueguen et al., 2018). Alternatively, the source of heavy Ni could be balanced by an oceanic sink enriched in light Ni isotopes. It has been suggested that this sink could be sulfides associated with anoxic or suboxic marine sediments that are enriched in organic matter (Gueguen et al., 2013; Hofmann et al., 2014). However, the role of organic-rich sediments in Ni isotope mass balance is unclear at this time as the bulk δ60Ni of organic-rich sediments displays a large range from 0.28‰ to 2.5‰ (Porter et al., 2014).
Table 2 shows a compilation of the data on Ni fluxes into and out of the ocean from with the addition of Ni isotope data from several publications. These data, which represents the known information on the Ni budget in the ocean is schematically represented in Figure 8.
25 1.4.3 The motivation for studying Ni isotopic fractionation during its interactions with
calcite
Isotope exchange reactions between calcium carbonates and seawater are important in paleo-reconstructions including determination of past temperature, atmospheric CO2, and oceanic pH
from oxygen, carbon, and boron isotopes, respectively. In paleo oceanographic research proxies are continuously evolving and improving. Simultaneously new proxies are being studied and developed through water column analysis, surface sediment analysis, and through laboratory experimentation. When Ni substitutes for Ca2+ in calcite as octahedral Ni2+ the Ni isotopic composition (in sedimentary calcite) can provide valuable information on the chemical composition, pH, and pCO2.
If the removal of Ni from the dissolved phase in the surface ocean is associated with isotopic fractionation, then Ni isotopes may be able to yield constraints on precise biogeochemical processes involved at the time of mineral formation. This is due to its strong complexation with organic ligands and its slow water exchange rate (table 1); out of the first row transition metals, Ni has the most inhibiting enthalpy of dehydration at -513 kcal/mol (Baes and Mesmer, 1976).
Another advantage of Ni over other divalent metals is that during its incorporation in calcite it undergoes fewer processes that cause fractionation (i.e. redox or change of coordination number) and thus the main mechanism causing fractionation will be the distribution within species. This distribution within species will reflect in the Ni2+ composition since it is the only species of Ni that can exchange into the calcite lattice. The isotope fractionation among aqueous species will, therefore, be reflected in the composition of free Ni and consequently in the fractionation between Ni in the solid and the reactive fluid.
The speciation of a metal in solution affects its kinetic and thermodynamic properties. It also affects the isotopic composition of the aqueous metal and the metal incorporated from the solution into a solid. This study provides new insights into the parameters controlling isotope fractionation of Ni during its interactions with calcite and provides new tools to reconstruct paleo-environmental conditions based on the composition of the Ni isotopes recorded in carbonate sediments.
26 Only a few experiments have investigated the adsorption of Ni on the calcite surface and its coprecipitation with this mineral. However, to our knowledge, no isotope data has been published on Ni isotope fractionation that is linked to these processes. The aim of this thesis is to fill this gap and also characterize the mechanisms controlling Ni isotope fractionation that are driven by interactions of this element with calcite. It is expected that the extent of adsorption of Ni on calcite and coprecipitation with calcite can reveal information on the chemical composition of the reactive fluid from which Ni came into contact with this mineral. Results of this thesis will provide important insight into several key questions:
• Does the speciation of the solution affect the fractionation of Ni during adsorption on calcite?
• What is the mechanistic cause of Ni isotope fractionation during adsorption and coprecipitation on/with calcite?
• Is there a link between calcite precipitation rate and the extent of Ni isotope fractionation?
• Can Ni incorporated into calcite be used as a proxy for paleo oceanic conditions? • Does Ni incorporated in calcite play a significant role in the oceanic Ni isotope
budget?
In an attempt to answer these questions, two experimental studies have taken place. Each is presented in a different chapter of this thesis. The first study (chapter 3) is devoted to the investigation of Ni isotope fractionation during adsorption on the calcite surface as a function of pH. This study was motivated by the search for a heavy source or light sink of Ni in the ocean in order to better constrain the Ni global oceanic isotope budget. The second study (chapter 4) investigates Ni isotope fractionation associated with its coprecipitation with calcite. The aim of this study is the development of a new proxy to determine paleo oceanic chemical composition (pH, pCO2, saturation state with respect to calcite). To evaluate this new proxy, experiments were
designed to quantify Ni isotope fractionation as a function of the precipitation rate of calcite at 1 atm pCO2 and 25oC.
27
Chapitre 1b. Introduction générale
28 Les carbonates sont des roches sédimentaires trouvées dans pratiquement tous les systèmes marins et caractérisés par la présence de l'ion carbonate (CO32-) dans leur structure. Le carbonate
de calcium (CaCO3) est le carbonate le plus abondant à la surface de la Terre, avec deux
polymorphes principaux, la calcite et l'aragonite. La calcite a une forte affinité pour les métaux divalents (Davis et al., 1987; Zachara et al. 1991; Lakshtanov et Stipp, 2007). Les principales voies d’interaction des métaux avec la calcite sont leur adsorption à la surface du minéral et leur incorporation dans le réseau cristallin. Les processus de sorption et d'incorporation sont étroitement liés puisque l'adsorption est une étape intermédiaire nécessaire pour toutes les réactions d'incorporation et que les deux mécanismes sont contrôlés par les mêmes facteurs chimiques (Curti, 1999). Cela fait de la calcite un puits pour des éléments divalents tels que Cd, Zn, Mn, Fe, Cd, Mg et Sr. (Wilkinson et Algeo, 1989; Tipper et al., 2006; Krabbenhöft et al., 2010; Pearce et al., 2015) qui peut avoir un impact important sur la mobilité et les cycles géochimiques des métaux traces dans les milieux aquatiques (Van Capellen, 1993; Villegas-Jimenez, 2009; Martin-Garin et al., 2003).
La composition isotopique des éléments incorporés dans les minéraux fournit des informations sur les mécanismes des réactions chimiques et leurs vitesses dans les processus géochimiques tels que les transformations redox, la sorption, la complexation, la dissolution et la précipitation. Ces processus modifient l'abondance relative des isotopes d'un élément dans les réactifs et les produits (Urey, 1946). Le fractionnement des isotopes stables entre deux phases peut être attribué à la faible différence de masse des isotopes entraînant de petites variations de leurs propriétés thermodynamiques et cinétiques. Il peut donc être dominé par des facteurs d'équilibre (thermodynamiques) ou cinétiques (Urey, 1947; Bigeleisen, 1965; Schauble, 2004). En général, le fractionnement isotopique entre deux phases ou composés au sein d'une phase peut être attribué à une certaine combinaison de coefficients de partage à l'équilibre, coefficients de diffusion et constantes de vitesse de réaction (Watkins, 2017).
Les réactions d'échange d'isotopes entre les carbonates de calcium et l'eau de mer peuvent servir comme témoins ou proxys des conditions physico-chimiques passées à la surface de la terre et sont à la base de paléo-reconstructions concernant, notamment, la température, la teneur de l’atmosphère en CO2 et le pH des océans à partir des isotopes de l'oxygène, du carbone et du bore,
respectivement. En paléo-océanographie, les proxys évoluent et s’améliorent continuellement, tandis que de nouvelles méthodes se développent grâce à l’analyse des sédiments et à des