1 2 3 4 5 6 7 Université de Montréal 8 9 10 11 12
Durée de lʼexposition avec symptômes, séquelles et coûts de lʼasthme 13
professionnel en relation avec le statut psychologique et 14
socioéconomique 15 16 17 par 18 19 20 21 David Miedinger 22 23 24 25 26
Programme de Sciences biomédicales 27
28 29 30 Faculté de Médecine 31 32 33
Thése présentée à la Faculté des études supérieures 34
en vue de lʼobtention du grade de docteures sciences (Ph.D) 35
en Sciences biomédicales 36 37 38 39 40 41 42 43 Avril, 2012 44 © David Miedinger, 2012 45 46
46 47 48 49 50 Université de Montréal 51
Faculté des études supérieures 52
53 54 55 56
Cette thèse intitulée : 57
58
Durée de lʼexposition avec symptômes et séquelles de lʼasthme 59
professionnel en relation avec le statut psychologique et 60
socioéconomique 61 62 63 64 65 présenté par : 66 David Miedinger 67 68 69 70 71 72 73
a été évaluée par un jury composé des personnes suivantes : 74
75 76 77 78 Dr François Madore 79 Président rapporteur 80 Dr Jean-Luc Malo 81 Directeur de recherche 82
Dre Maria Victoria Zunzunegui 83
Codirectrice de recherche 84 Dr Jacques Ameille 85 Examinateur externe 86 Dr Robert Amyot 87 Examinateur interne 88 Dr Louis Patry 89 Représentant de la doyenne 90
Résumé 91
Le facteur le plus important de pronostic de l'asthme professionnel 92
(AP) est la durée des symptômes avant le retrait de lʼexposition à lʼagent 93
causant lʼAP. La qualité de vie réduite, la détresse psychologique et les 94
maladies psychiatriques sont des conditions souvent associées à l'AP. 95
Notre objectif était d'identifier les facteurs, incluant le statut 96
socioéconomique, qui ont une influence sur lʼintervalle de temps nécessaire 97
pour présenter une requête à une agence médicolégale à la suite de 98
lʼapparition de symptômes dʼasthme et de confirmer qu'un tel délai est 99
associé à un moins bon pronostic respiratoire et à des coûts directs plus 100
élevés. En outre, nous avons examiné la relation entre les variables cliniques 101
et socio-économiques dʼune part et leur influence sur les facteurs 102
psychologiques et économiques dʼautre part chez des travailleurs atteints 103
d'AP. Ensuite, nous avons voulu évaluer si les individus souffrant de détresse 104
psychologique (DP) et de morbidité psychiatrique pourraient être identifiés en 105
utilisant un instrument mesurant la qualité de vie (QV). 106
Lʼétude a été effectuée auprès dʼindividus ayant déposé des 107
demandes d'indemnisation pourʼAP auprès du Commission de la sécurité et 108
de la santé du travail du Québec (CSST). Les données ont été recueillies au 109
moment de la réévaluation, soit environ deux ans et demi après le diagnostic. 110
Outre la collecte des marqueurs cliniques de l'asthme, les individus ont été 111
médicale, à une brève entrevue psychiatrique (évaluation des soins primaires 113
des troubles mentaux, PRIME-MD) et à un ensemble de questionnaires, 114
incluant le Questionnaire sur la qualité de vie - AQLQ(S), le Questionnaire 115
respiratoire de St. George (SGRQ) et le Psychiatric Symptom Index (PSI). 116
Soixante personnes ont été incluses dans l'étude. Etre plus âgé, avoir 117
un revenu supérieur à 30 000$ CA etêtre atteint dʼAP dû à un allergène de 118
haut poids moléculaire ont une association positive avec le nombre dʼannées 119
dʼexposition avec symptômes avant le retrait. Au cours de la période de suivi, 120
le nombre dʼannées dʼexposition avec symptômes était plus grand chez les 121
individus ayant une hyperréactivité bronchique persistante. Par ailleurs, la 122
présence de symptômes au poste de travail pendant moins d'un an est 123
associée à une réduction des coûts directs. Les paramètres de QV et de DP 124
avaient des corrélations modérées avec les marqueurs cliniques de lʼAP. Les 125
plus fortes associations avec ces variables ont pu être observées dans les 126
cas de la sévérité de l'asthme, des statuts dʼemploi et matrimonial, du revenu 127
et de la durée de la période de travail avec l'employeur. Un seuil de 5,1 au 128
niveau de la sous-échelle de la fonction émotionnelle de lʼAQLQ(S) sʼest 129
avéré avoir la meilleure valeur discriminante pour distinguer les individus 130
avec ou sans détresse psychiatrique cliniquement significative selon le PSI. 131
Nous avons été en mesure d'identifier les variables socio-économiques 132
associées à un intervalle plus long dʼexposition professionnelle en présence 133
de symptômes dʼasthme. De même, une plus longue période d'exposition a 134
compensation plus élevés. Ces résultats s'avèrent utiles pour la surveillance 136
de lʼAP qui pourrait cibler ces sous-groupes d'individus. La QV et la PS sont 137
fréquemment réduites chez les individus atteints d'AP qui perçoivent une 138
compensation. Elles sont associées à des marqueurs cliniques de lʼasthme et 139
à des facteurs socio-économiques. En outre, nos résultats suggèrent que le 140
questionnaire de lʼAQLQ(S) peut être utilisé pour identifier les individus avec 141
un niveau de détresse psychologique potentiellement significatif. 142
143
Mots-clés : Analyse des coûts, délai de diagnostic, économie, asthme 144
professionnel, troubles psychiatriques, détresse psychologique, qualité de 145
vie, Québec, dépistage, facteurs socioéconomiques. 146
Abstract 147
The most important factor in the prognosis of occupational asthma 148
(OA) is the length of exposure with symptoms prior to removal from exposure. 149
Impaired quality of life, psychological distress and psychiatric disease are 150
conditions frequently associated with OA. 151
Our goal was to identify factors, including socio-economic status, that 152
can influence the delay in submitting a claim to a medicolegal agency after 153
the onset of asthmatic symptoms, and to confirm that such a delay is 154
associated with a worse respiratory prognosis and higher direct costs. 155
Further, we examined the association between clinical and socio-economic 156
variables and their influence on psychological and cost outcomes in 157
individuals with OA. Next, we wanted to evaluate whether individuals with 158
clinically significant psychological distress (PD) and psychiatric morbidity 159
could be identified by using a quality of life (QOL) measurement instrument. 160
This is a study of individuals who filed claims for compensation for 161
occupational asthma from the Workersʼ Compensation Board of Quebec (the 162
CSST). Data were collected at re-evaluation, approximately two and a half 163
years after diagnosis. Besides collecting clinical markers of asthma, 164
individuals underwent a general socio-demographic and medical history 165
evaluation, a brief psychiatric interview (Primary Care Evaluation of Mental 166
Disorders, PRIME-MD) and completed a battery of questionnaires, including 167
Respiratory Questionnaire (SGRQ), and the Psychiatric Symptoms Index 169
(PSI). 170
Sixty individuals were included in the study. Being older, having a 171
revenue of >$30,000 Can. (CAD$) and having OA due to high- molecular- 172
weight agents were all positively associated with the number of years of 173
exposure with symptoms before removal from exposure. Individuals with 174
persistent airway hyperresponsiveness at follow-up had a higher number of 175
years with symptoms. Experiencing symptoms in the workplace for less than 176
one year generated lower direct costs. QOL and PD parameters had 177
moderate correlations with clinical markers of OA. Asthma severity, 178
employment and marital status, income and length of employment with the 179
employer showed the strongest associations with QOL and PD. More 180
impaired QOL was associated with higher direct costs for compensation. A 181
cut-off of 5.1 on the AQLQ(S) emotional function subscale had the best 182
discriminative value to distinguish individuals with or without clinically 183
significant psychological distress according to the PSI. 184
We were able to identify socio-economic variables that were associated 185
with a longer interval during which individuals remained symptomatic in the 186
workplace before being removed from exposure. This longer exposure time 187
was associated with worse disease outcomes and higher compensation 188
costs. These findings could prove to be useful in surveillance programs that 189
could be preferentially targeted for these subgroups of individuals. Impaired 190
and are associated with clinical markers of OA and socio-economic factors. 192
Further, our findings suggest that the AQLQ(S) questionnaire could be used 193
to identify individuals with potentially clinically significant levels of 194
psychological distress. 195
196
Keywords: Costs and Cost Analysis, Diagnosis Delay, Economics, 197
Occupational Asthma, Psychiatric disorder, Psychological Distress, Quality of 198
Life, Quebec, Screening, Socioeconomic Factors 199
Table of Contents 200 201
Résumé ... iv 202
Abstract ... vii 203
Table of Contents ... x 204
Index of figures ... xiii 205
Abbreviations ... xv 206
Acknowledgements ... xviii 207
1. Introduction... 20 208
1.1. Asthma in the workplace ... 21 209
1.1.1. Definition of asthma... 21 210
1.1.2. Diagnosis of work-related asthma in Quebec... 37 211
1.1.3. Management of patients with occupational asthma ... 60 212
1.2. Social determinants of health... 79 213
1.2.1. Sex and gender ... 79 214
1.2.2. Housing and neighbourhood conditions ... 83 215
1.2.3. Immigration status and health of ethnic minorities ... 84 216
1.2.4. Social exclusion and social support ... 89 217
1.2.5. Single parenthood ... 94 218
1.2.6. Social gradient and personal or family income... 95 219
1.2.7. Education and access to retraining schemes... 96 220
1.2.9. Labour union affiliation ... 102 222
1.2.10. Stress ... 103 223
1.2.11. Substance abuse and addiction ... 104 224
1.3. Asthma in the workplace and its association with socio-economic 225
factors ... 106 226
1.3.1. The socio-economic and psychological consequences of having 227
asthma while in the workforce ... 106 228
1.3.2. Socio-economic consequences of work-related asthma ... 117 229
1.3.3. Quality of life, psychological distress and psychiatric disease in 230
individuals with work-related asthma... 125 231
1.3.4. Possible interactions between socio-economic factors and 232
objective measures of asthma... 128 233
1.4. The medico-legal system for workersʼ compensation in Quebec 234
... 138 235
1.4.1. The claims process ... 139 236
1.4.2. Income replacement indemnity and rehabilitation ... 141 237
1.4.3. Permanent disability indemnity... 142 238
1.4.4. Costs of occupational asthma and effectiveness of the 239
compensation system... 145 240
1.5. Measuring health with questionnaires ... 149 241
1.6. Study aims... 165 242
2.1. Article 1: Factors influencing duration of exposure with 244
symptoms and costs of occupational asthma ... 167 245
2.2. Article 2: Quality-of-life, psychological, and cost outcomes 2 246
years after diagnosis of occupational asthma... 169 247
2.3. Article 3: Identification of clinically significant psychological 248
distress and psychiatric morbidity by examining quality of life in 249
subjects with occupational asthma ... 221 250
3. Discussion ... 262 251
3.1. Strengths and limitations of this study ... 264 252
3.2. Interpretation of study findings... 273 253
3.2.1. Originality of results... 291 254
3.2.2. Generalization of results... 293 255
3.3. Conclusions ... 296 256
3.4. Implications and suggestions for further research... 298 257
3.4.1. Implications of the study results on the management of workers 258
with possible OA... 298 259
3.4.2. Implications for future research projects ... 300 260
4. References ... 308 261
262 263
Index of figures 263 264
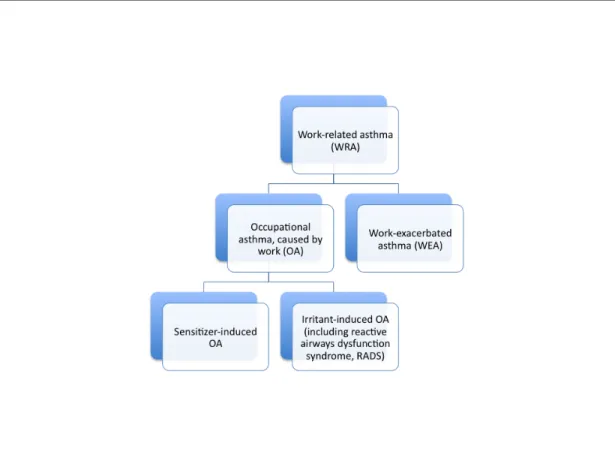
Figure 1: Different subtypes of work-related asthma ... 23 265
Figure 2: Performing SPT on the forearm... 43 266
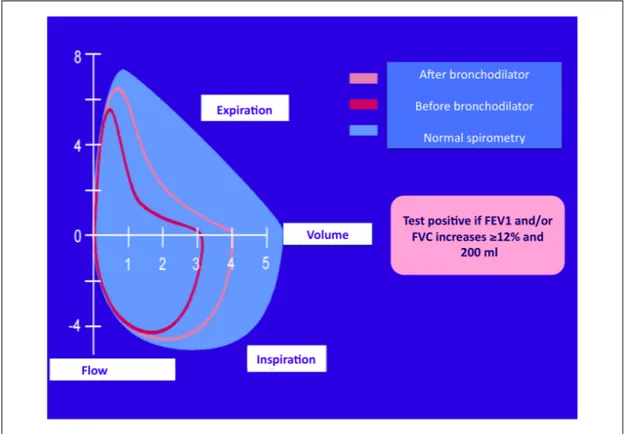
Figure 3: Flow volume curves during bronchodilator test ... 50 267
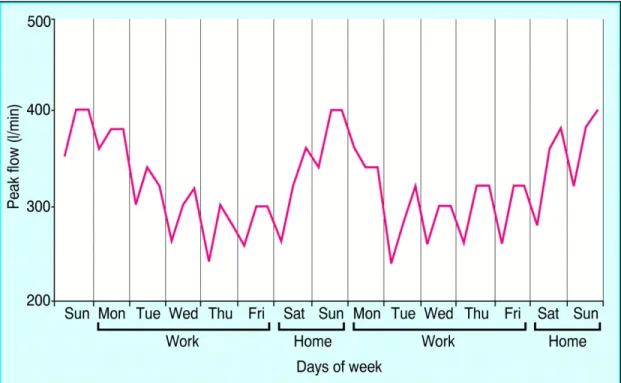
Figure 4: Self-recorded peak flow measurement showing classic pattern of 268
OA ... 52 269
Figure 5: Natural history of immunological OA ... 62 270
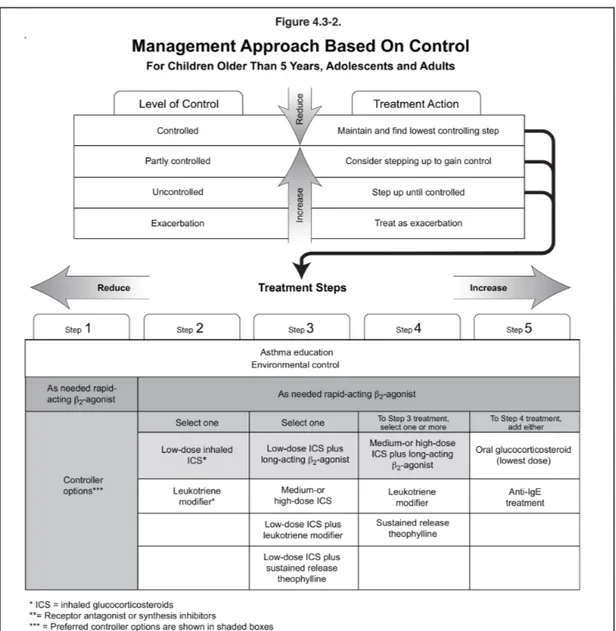
Figure 6: Management approach based on control of asthma symptoms... 72 271
Figure 7: Questionnaire used by Labrecque and co-workers to screen for OA 272
in diisocyanate-exposed workers ... 76 273
Figure 8: The working environment can interact with asthma in a complex 274
manner ... 110 275
Figure 9: Predictive model of work disability among adults with asthma.... 112 276
Figure 10: Theoretical model of how exposures affect lung function 277
throughout the life... 132 278
Figure 11: Number of cases of compensated occupational lung diseases in 279
the province of Quebec from 1988-2003 ... 139 280
Figure 12: Table for calculation of permanent disability indemnity used by the 281
“CSST” in Quebec/Canada... 143 282
Figure 13: Symptoms domain of the SGRQ questionnaire... 157 283
Index of tables 284 285
Table 1: Illustrative examples of specific agents (and workers) associated with 286
sensitizer-induced OA ... 27 287
Table 2: Types of OA according to Chan-Yeung and Malo ... 28 288
Table 3: Methods for the determining the frequency of OA ... 30 289
Table 4: Key questions suggested in the American College of Chest 290
Physiciansʼ Consensus Statement on Diagnosis and Management of 291
WRA ... 38 292
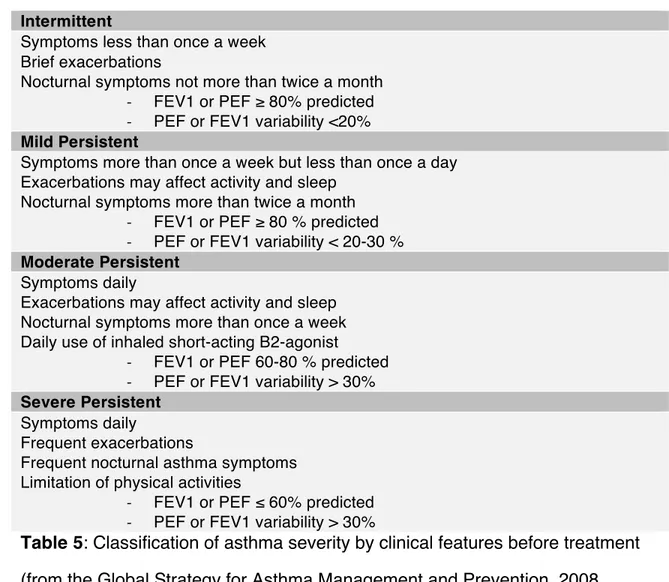
Table 5: Classification of asthma severity by clinical features before treatment 293
... 66 294
Table 6: Levels of asthma control... 67 295
Table 7: The beneficial effects of regular work ... 100 296
Table 8: Impact of OA on major socio-economic outcomes ... 119 297
Table 9: Comparison of different asthma-specific quality of life questionnaires 298
... 154 299
300 301
Abbreviations 301 302
ACCP American College of Chest Physicians 303
AHR Airway Hyperresponsiveness 304
AIRA Allergic Rhinitis and its Impact on Asthma 305
AMA American Medical Association 306
AQLQ(S) Standardized Form of the Asthma Quality of Life 307
Questionnaire by Juniper 308
BPTs Bronchial Provocation Tests 309
CAD$ Canadian dollars 310
CAW Center for Asthma in the Workplace (Montreal, Canada) 311
COPD Chronic Obstructive Pulmonary Disease 312
CSST Commission de la Santé et de la Sécurité du Travail du 313
Québec 314
DALYs Disability-Adjusted Life Years 315
DAP Permanent Disability Indemnity 316
DSM Diagnostic and Statistical Manual of Mental Disorders 317
EAACI European Academy of Allergy and Clinical Immunology 318
ENO Exhaled Nitric Oxide 319
ECRHS European Community Respiratory Health Survey 320
FEV1 Forced Expiratory Flow in One Second 321
GINA Global Initiative for Asthma 323
HADS Hospital Anxiety and Depression Scale Questionnaire 324
HMW High Molecular Weight 325
IgE Immunoglobulin E 326
IRR Income Replacement Indemnity and Rehabilitation 327
LMW Low Molecular Weight 328
LWAQ Living with Asthma Questionnaire 329
MCMI-III Millon Clinical Multiaxial Inventory I-III 330
OA Occupational Asthma 331
PC20 Concentration of methacholine causing a fall in forced 332
expiratory volume in one second greater than or equal to 333
20% 334
PEF Peak Expiratory Flow 335
PRIME-MD Primary Care Evaluation of Mental Disorders 336
Questionnaire 337
PSI Psychiatric Symptom Index 338
RADS Reactive Airways Dysfunction Syndrome 339
RAST Radioallergosorbent Test 340
ROC Receiver Operator Characteristic Curve 341
SIC Specific Inhalation Challenge 342
SGRQ St. Georgeʼs Respiratory Questionnaire 343
SPT Skin Prick Test 344
WHO World Health Organization 346
WRA Work-Related Asthma 347
TMA Trimellitic Anhydride 348
YWS Years of Exposure with Symptoms before Removal from 349
Exposure 350
YI Youden Index 351
Acknowledgements 352 353
First of all, I would like to thank my mentor and thesis director Dr. Jean- 354
Luc Malo for accepting me as a student and giving me such a great 355
opportunity to work on his team at the Center for Asthma in the Workplace in 356
Montreal. I am deeply grateful for his expertise, insight, guidance and support, 357
which have helped me to achieve this academic degree. 358
I wish also to express my sincere appreciation for many constructive 359
comments and support to Dr. Maria Victoria Zunzunegui, who agreed to be 360
my thesis co-director, and to Dr. Kim Lavoie. Many thanks to Dr. Heberto 361
Ghezzo for assisting in all the statistical aspects of the project, and to 362
Jocelyne LʼArchevèque for collecting and organizing the data for me to work 363
with. I would also like to thank Kathe Lieber for proofreading my thesis. 364
Dr. Denyse Gautrin, Dr. Jean Bourbeau and Dr. François Madore 365
challenged me during the doctoral exam with their eloquent questions, which 366
helped me to improve my thesis. 367
Further, I would like to thank Diane Provost and Jocelyne Normandin 368
for helping me to organize and deal with all the administrative matters that 369
came along and helping me to connect with my collaborators at the research 370
centre after my departure for Switzerland. 371
I am indebted in gratitude to my friend and mentor Dr. Jörg D. Leuppi. 372
in Basel but also motivated me to pursue my clinical and research career 374
abroad. Back in Switzerland I am very happy to plan and conduct challenging 375
research projects together with him and the members of his research group. 376
This thesis could not have been finalized without the backup by Dr. 377
Hanspeter Rast and Dr. Marcel Jost my superiors at Suva in Lucerne. This 378
project was supported in part by the Swiss National Science Foundation, the 379
Canadian Institutes of Health Research and bursaries and studentship 380
awards from the University of Montreal and the University Hospital 381
Basel/Switzerland. 382
I would like to express my gratitude to Dr. Gregory Moullec, Sylvie 383
Daigle and Dr. Bruno Bosisio for their friendship and for all the very special 384
moments during my stay in Montreal. 385
Special thanks go to my mother, Suzanne Heinzel-Scheerer, and her 386
partner Rolf Steger, not only for their love and support but also for helping me 387
to organize all the matters aside from work, especially during the time I lived 388
abroad. 389
Last but not least, I would like to thank my wife and great love, France 390
Gaudreault, for her unconditional belief in me and her support for my 391
endeavour of adding research to my clinical duties as a physician. I have 392
great respect for her commitment to leave her family and friends, leave her 393
job, and relocate to Switzerland to share her life with me. 394
397
In this chapter, I will first briefly discuss the definition and specific 398
features of asthma that is caused by the workplace. I will discuss which tests 399
can be used to diagnose and treat occupational asthma (OA), and report on 400
the expected natural course in individuals who remain exposed to the causal 401
agent in the workplace and how the outcome differs in those individuals who 402
are able to decrease or stop their exposure. I will then highlight the strong and 403
important association of socio-economic and psychological factors with health 404
in general before summarizing findings of past studies on the association of 405
OA with various socio-economic and psychological factors. I will also briefly 406
explain how a claim made to the compensation agency in Quebec/Canada is 407
handled and what compensation is offered to individuals whose claim is 408
accepted. 409
410 411 412
1.1. Asthma in the workplace 412 413
1.1.1. Definition of asthma 414
415
The Global Initiative for Asthma (GINA), launched in 1993, brings 416
together committees made up of leading asthma experts from around the 417
world to develop guidelines for asthma care. According to GINA, “Asthma is a 418
chronicinflammatory disorder of the airways in which many cells and cellular 419
elements play a role. The chronic inflammation isassociated with airway 420
hyperresponsiveness (AHR) that leads torecurrent episodes of wheezing, 421
breathlessness, chest tightness,and coughing, particularly at night or in the 422
earlymorning. These episodes are usually associated with widespread,but 423
variable, airflow obstruction within the lung that isoften reversible either 424
spontaneously or with treatmentʼʼ (www.ginasthma.org). Asthma has been 425
classified by Rackeman into two different types based on causative factors: 426
extrinsic asthma is often due to an allergy to antigens and frequently occurs 427
before the age of 30, while intrinsic asthma usually occurs later in life, 428
secondary to chronic or recurrent infections of the bronchi, sinuses, or tonsils 429
and adenoids (1). 430
To avoid exacerbation of asthmatic attacks and further progression of 431
the disease, triggering situations or substances should be avoided whenever 432
inflammation and bronchospasm. It has been estimated that about 300 million 434
people worldwide are affected by asthma. The global prevalence of asthma 435
ranges from 1% to 18% of the population in different countries, and the 436
number of disability-adjusted life years (DALYs) lost due to asthma is similar 437
to years lost for diabetes, cirrhosis of the liver or schizophrenia (2). 438
439 440
Work-related Asthma 441
442
Several terms are used to describe asthma in relation to the workplace, 443
as summarized in the American College of Chest Physiciansʼ (ACCP) 444
446
Figure 1: Different subtypes of work-related asthma 447
448
Work-related asthma (WRA) is the term used to define asthma that is 449
induced or exacerbated at the workplace. In population studies, a diagnosis of 450
WRA is assigned to respondents with self-reported physician-diagnosed 451
asthma who report that their work environment is causing asthma symptoms 452
(4). Self-reporting of work-related symptoms and exposure to airway irritants 453
can, however, be prone to recall bias in individuals with lung disease. 454
Evidence for this comes from studies investigating the association of 455
occupational exposure to airway irritants with chronic obstructive lung 456
exposure and chronic obstructive lung disease was much stronger than a 458
more objective measure of exposure by a job-exposure matrix (5). 459
460 461
Work-exacerbated Asthma 462
463
Work-exacerbated asthma (WEA) is the term used in the case of 464
workers with pre-existing or concurrent asthma (asthma that occurs at the 465
same time but is not caused by workplace exposures) that is worsened by 466
work-related factors like airway allergens, irritants and exercise (3). Subjects 467
may notice an increased frequency or severity of asthma symptoms and/or 468
may need to increase their medication in order to control symptoms during or 469
after their work days. In rare cases WEA and OA may coexist in workers: 470
Subjects who work at different workplaces may become sensitized to an 471
allergen causing OA. Their asthma may be exacerbated by other irritating 472
factors encountered during work; for example, when performing a job task 473
without exposure to the allergen or at a different workplace. 474
475 476 477
Occupational Asthma 477
478
Occupational asthma (OA) is the term used for asthma that starts 479
when the subject is exposed to a substance present in the workplace. Rarely, 480
it may occur in subjects with a history of childhood asthma that became 481
quiescent during adolescence before resurfacing as a consequence of 482
occupational exposure through a sensitizing or irritating mechanism (3). OA 483
can be divided into two categories: 484
485
Immunological OA appears after sensitization to a substance that is 486
specific to the workplace. Symptoms appear after a latency period that seems 487
to vary according to the nature of the agent (6). For some allergens, an 488
allergic immunoglobulin E (IgE)-mediated mechanism has been 489
demonstrated, whereas for others the mechanisms of sensitization are 490
presently unclear. Another approach often used is to distinguish allergens 491
according to their molecular weight: high-molecular-weight (HMW) allergens 492
are often proteins with a mass >10 kd, while low-molecular-weight (LMW) 493
allergens are those such as chemicals, like diisocyanates. 494
495
Non-immunological OA may occur after a single or multiple high- 496
concentration exposures to an inhaled non-specific irritant in the workplace. 497
demonstrate non-specific AHR. Brooks defined this condition in 1985 as 499
asthma occurring after a single exposure to high levels of an irritating vapour, 500
fume or smoke, and suggested the term reactive airways dysfunction 501
syndrome (RADS) (7). 502
503 504
1.1.1.4. Etiologies of OA 505
506
Substances that are known to cause immunological OA encompass a 507
broad spectrum of natural and synthetic chemicals found in a diverse range of 508
materials and industrial processes. These agents can be divided into two 509
broad categories by their mechanism of action: immunological is the 510
sensitizer-induced form of OA and non-immunological is the irritant-induced 511
form of OA (8). In immunological OA, asthma is induced through an IgE- 512
dependent mechanism, whereas in some patients specific IgEs are 513
apparently not involved despite a clear asthmatic reaction in specific 514
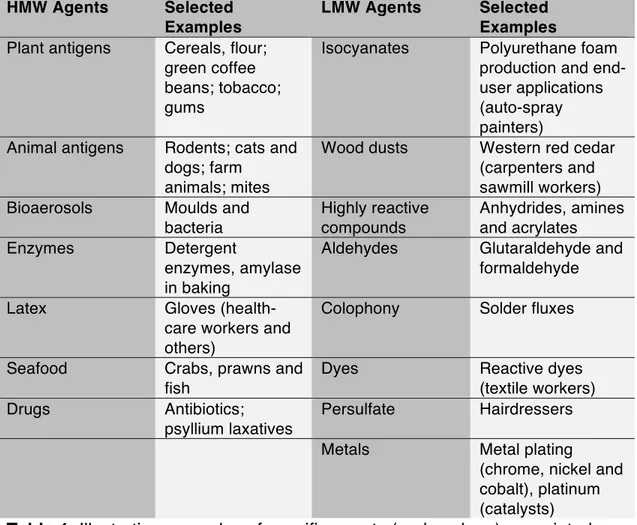
inhalation challenges (8). Etiologic agents can be classified according to their 515
propensity for IgE-dependent or non-dependent action (9), as shown in Table 516
1. 517
518 519
519 HMW Agents Selected
Examples
LMW Agents Selected Examples Plant antigens Cereals, flour;
green coffee beans; tobacco; gums
Isocyanates Polyurethane foam
production and end-user applications (auto-spray painters) Animal antigens Rodents; cats and
dogs; farm animals; mites
Wood dusts Western red cedar
(carpenters and sawmill workers)
Bioaerosols Moulds and
bacteria Highly reactive compounds Anhydrides, amines and acrylates Enzymes Detergent enzymes, amylase in baking
Aldehydes Glutaraldehyde and
formaldehyde
Latex Gloves
(health-care workers and others)
Colophony Solder fluxes
Seafood Crabs, prawns and
fish
Dyes Reactive dyes
(textile workers)
Drugs Antibiotics;
psyllium laxatives
Persulfate Hairdressers
Metals Metal plating
(chrome, nickel and cobalt), platinum (catalysts)
Table 1: Illustrative examples of specific agents (and workers) associated 520
with sensitizer-induced OA 521
522
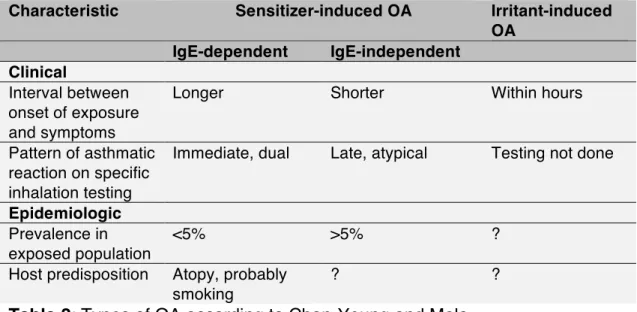
OA induced by these two groups of allergens differs in clinical 523
presentation, the type of reaction produced during inhalation tests and the 524
characteristics of the population at risk, as shown in Table 2 (3). 525
526 527
527 Characteristic Sensitizer-induced OA Irritant-induced
OA IgE-dependent IgE-independent Clinical Interval between onset of exposure and symptoms
Longer Shorter Within hours
Pattern of asthmatic reaction on specific inhalation testing
Immediate, dual Late, atypical Testing not done
Epidemiologic Prevalence in exposed population
<5% >5% ?
Host predisposition Atopy, probably smoking
? ?
Table 2: Types of OA according to Chan-Yeung and Malo 528
529
The most common agents for asthma without latency or irritant-induced 530
asthma are chlorine and ammonia (9). 531
532 533
1.1.1.5. Epidemiology of Work-related Asthma 534
535
There is much debate in the medical community about how to define 536
asthma and about the “gold standard” for the diagnosis of asthma (10). One 537
way of defining asthma in studies is by asking study participants if they have 538
ever been diagnosed by a physician as having asthma. Respiratory 539
symptoms can be misinterpreted by a physician as being caused by asthma, 540
especially if no objective investigation with lung function and bronchial 541
obstructive pulmonary disease (COPD), vocal cord dysfunction or upper 543
airway cough syndrome are known to present with symptoms similar to 544
asthma. In a recent study, Aaron and co-workers objectively assessed 545
subjects with self-reported physician-diagnosed asthma and found that one- 546
third of patients did not have asthma on the basis of bronchial provocation 547
test (BPT) results and problem-free withdrawal of medication (11). 548
Toelle and co-workers have suggested that in epidemiologic studies, 549
asthma should be defined as having airway hyperresponsiveness (AHR) plus 550
recent wheezing in the 12 months prior to study (12). However, it is well 551
known that not all patients with asthma do have AHR or complain of wheezing 552
(13). 553
Not surprisingly, different definitions of OA exist. By consensus, a 554
widely used definition of OA has been formulated: “Occupational asthma is a 555
disease characterized by variable airflow limitation and/or 556
hyperresponsiveness and/or inflammation due to causes and conditions 557
attributable to a particular occupational environment and not to stimuli 558
encountered outside the workplace.” (14) 559
Depending on the population studied and the objective of the 560
epidemiologic studies, the definition of OA can vary. When using a broader 561
definition of WRA, this includes WEA and the two forms of OA: non- 562
immunological OA and immunological OA. This precludes the general 563
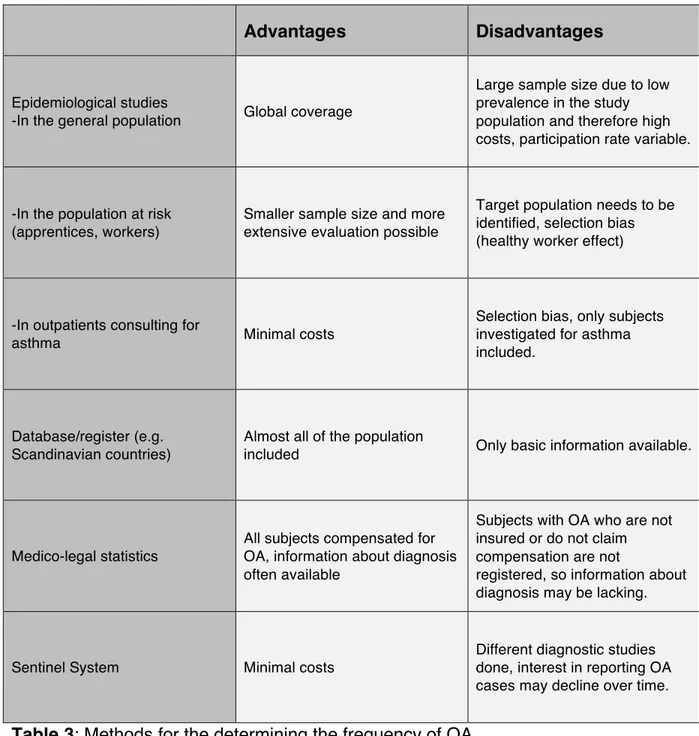
epidemiologic investigations. Furthermore, different methods can be used to 565
determine the frequency (incidence and prevalence) of OA (Table 3). 566
567
Advantages Disadvantages
Epidemiological studies
-In the general population Global coverage
Large sample size due to low prevalence in the study population and therefore high costs, participation rate variable.
-In the population at risk (apprentices, workers)
Smaller sample size and more extensive evaluation possible
Target population needs to be identified, selection bias (healthy worker effect)
-In outpatients consulting for
asthma Minimal costs
Selection bias, only subjects investigated for asthma included.
Database/register (e.g. Scandinavian countries)
Almost all of the population
included Only basic information available.
Medico-legal statistics
All subjects compensated for OA, information about diagnosis often available
Subjects with OA who are not insured or do not claim compensation are not
registered, so information about diagnosis may be lacking.
Sentinel System Minimal costs
Different diagnostic studies done, interest in reporting OA cases may decline over time.
Table 3: Methods for the determining the frequency of OA 568
569
OA is one of the most prevalent occupational respiratory diseases in 570
meta-analysis that between 9% and 15% of diagnosed cases do have a 572
professional origin (15). However, later studies have estimated a higher 573
population-attributable risk of occupational exposure for adult-onset asthma in 574
the United States (37%) (4) and Finland (29% for males and 17% for females) 575
(16). In the European Community Respiratory Health Survey (ECRHS), the 576
population-attributable risk for adult asthma due to occupational exposure 577
ranged from 10% to 25%, equivalent to an incidence of new-onset OA of 250- 578
300 cases per million people per year (17). 579
580 581
1.1.1.6. Risk factors for OA 582
583
1.1.1.6.1 Level of exposure 584
585
Studies have provided strong evidence supporting a dose-response 586
relationship between the level of exposure to occupational agents and the 587
development of IgE-mediated sensitization and work-related respiratory 588
symptoms (18). For isocyanates - considered LMW agents - an exposure- 589
response gradient has been documented for respiratory symptoms, 590
sensitization (reflected by specific IgE and IgG) and the development of OA 591
(19, 20). For acid anhydrides such as trimellitic anhydride (TMA), a dose- 592
sensitization (21). However, there are studies of bakers and laboratory animal 594
workers showing that high-level exposures to flour or laboratory animal 595
allergens may have a protective effect on the development of sensitization 596
and respiratory symptoms (22-24). 597
598 599
1.1.1.6.2. Mode of exposure 600
601
In animal models, skin exposure has been shown to initiate IgE- 602
mediated sensitization, eosinophilic airway inflammation and bronchial 603
hyperresponsiveness (18). In humans, airway and skin exposure to offending 604
allergens often occur simultaneously; however, there is evidence that OA to 605
isocyanates consistently occurs in work settings with low diisocyanate 606
exposure, due either to intermittent peak exposures or to skin exposure (25, 607
26). 608
609 610
1.1.1.6.3. Co-exposure to pollutants 611
612
Co-exposure in the workplace to environmental pollutants such as 613
ozone, nitrogen dioxide, diesel exhaust particles and endotoxin can act as an 614
has been identified as a risk factor for work-related sensitization in laboratory 616
animal workers (27). However, this finding was not present in larger and 617
better controlled studies, and could not be shown in workers exposed to LMW 618
agents (28). Smoking has also been identified as a risk factor for persistent 619
respiratory symptoms after acute irritant inhalation exposure leading to 620
irritant-induced OA (29). 621
622 623
1.1.1.6.4. Atopy 624
625
Atopy is defined as either a positive skin prick test (SPT) response or 626
specific IgE response against a series of common aero-allergens (28). Atopy 627
has been shown to be a risk factor for the development of sensitization and 628
OA to HMW agents and to some LMW agents (18). In a follow-up study of 629
laboratory animal workers in the Netherlands, a combination of atopy and 630
elevated IgE (>100 IU/mL) when starting work with animals was associated 631
with subsequent sensitization over the following two years (30). Other studies 632
have shown that atopy is a stronger risk factor for sensitization in those with 633
low levels of exposure compared with those having medium- to high-level 634
exposure (24, 28, 31). 635
636 637
1.1.1.6.5. Genetic factors 638 639
Several genes have been shown to be associated with OA to LMW and 640
HMW occupational allergens. While some of these loci seem to have 641
protective properties, others confer a higher risk for OA (18). Identified genes 642
are involved in protection against antioxidant stress, α-1-antitrypsin 643
production and regulation of native immune pathways (18, 32). However, 644
most of the data available are derived from cross-sectional studies and show 645
only weak associations; some of the associations could not be confirmed in 646
studies carried out in other samples (18). 647
648 649
1.1.1.6.6. Bronchial hyperresponsiveness 650
651
Increased non-specific bronchial hyperresponsiveness has also been 652
considered a risk factor for subsequent development of OA: Gautrin and co- 653
workers investigated apprentices in animal health technology and found that 654
increased baseline immediate skin reactivity to pets (cats and dogs) and 655
higher degrees of non-specific AHR were risk factors for the development of 656
probable OA at follow-up after 3.5 and 8 years (33, 34). 657
658 659
1.1.1.6.7. Rhinitis 660 661
In the ECRHS, rhinitis was associated with asthma in cross-sectional 662
analysis and shown to be a risk factor for the subsequent development of 663
asthma at follow-up (35, 36). In individuals evaluated for WRA, Castano and 664
co-workers showed that occupational rhinitis (OR) frequently coexists with OA 665
(37). Symptoms of work-related rhinoconjunctivitis are risk factors for the later 666
development of asthma in the workplace in apprentices and workers handling 667
laboratory animals (38, 39), as shown in a study of patients in the Finnish 668
Register of Occupational Diseases (40). The acknowledgement of OR as a 669
risk factor for the development of OA has led the European Academy of 670
Allergy and Clinical Immunology (EAACI) Task Force on Occupational 671
Rhinitis to state in its position paper that the prevention of work-related rhinitis 672
may also provide an excellent opportunity to prevent OA (41). 673
674 675
1.1.1.6.8. Sex 676
677
Most occupational health and exposure assessment studies have been 678
carried out in male populations, so the findings cannot easily be extrapolated 679
to estimate the risk for female workers. In workers processing snow crab, it 680
to snow crab than their male co-workers (42). Atopy is a risk factor for the 682
development of OA to HMW allergens such as snow crab, and the risk for 683
atopy is greater for females than for males of working age (43). There is 684
accumulating evidence of a sex difference in susceptibility to exposure to 685
tobacco smoke, irritants and allergens that needs to be taken into account 686
when interpreting studies reporting a difference in respiratory disease rates 687
according to sex (44). Furthermore, there is evidence that immune response 688
in women differs from that in men, and that women are at much higher risk of 689
developing autoimmune diseases than men (45). 690
While “sex” is the term usually used to refer to biological differences 691
between men and women, “gender” most often refers to what is socially 692
recognized as feminine and masculine (46). Further analysis in workers 693
processing snow crab indicates that female workers more often perform work 694
where higher exposure to snow crab allergen is present than their male co- 695
workers (47). Eng et al. conducted a broad-based telephone survey of male 696
and female workers in New Zealand that showed major differences in 697
occupational exposure patterns between female and male workers, indicating 698
that these exposure differences were present between and within occupations 699
(48). Both studies highlight the fact that for OA, not only sex but also gender 700
differences must be taken into account when interpreting results of research 701
studies investigating risk factors. 702
703 704
1.1.2. Diagnosis of work-related asthma in Quebec 705 706
WRA is a major health challenge. Acute WRA can render suffering 707
subjects unable to work, often for a prolonged period of time. OA can cause 708
acute as well as long-term disability, which adversely affects quality of life and 709
socio-economic factors. 710
To diagnose WRA, subjects undergo a comprehensive medical history 711
in order to identify the presumed causal agent, followed by objective tests at 712
the physicianʼs office or at the workplace. When the offending allergen is in 713
doubt, it may be necessary for industrial hygienists to inspect the workplace in 714
order to identify irritating or sensitizing substances. Subjects who were 715
exposed to high levels of irritants within a short time normally develop 716
respiratory symptoms within the next 24 hours and often require emergency 717
treatment. Whenever possible, WRA should be investigated with objective 718
testing before the patient is advised to change profession or workplace. 719
720 721
1.1.2.1. Occupational history 722
723
In all working subjects with new-onset, worsening or difficult to treat 724
asthma, WRA needs to be considered, and a detailed history of temporal 725
Information about subjectsʼ profession, work status and exposure 727
characteristics must be obtained. Specific work environments have been 728
shown to be associated with an increased risk of more severe asthma, 729
especially in adult-onset asthma (49). 730
In real life, clinicians often neglect the importance of taking such a 731
detailed occupational history. Shofer and co-workers conducted a structured 732
retrospective comparison of occupational respiratory health history 733
documented by clinicians in an academic medical centre, with data 734
documented by patients on a structured questionnaire. While a job title was 735
documented in 75% of patient medical records, additional occupational 736
history data such as duties, exposures at work and use of protective 737
equipment were charted much less frequently (50). 738
Dyspnoea, wheezing, chest tightness and cough are the cardinal 739
symptoms of asthma as well as WRA. However, there are specific questions 740
a physician who suspects that the patientʼs asthma is related to the workplace 741
should ask (see Table 4) (3). 742
743 - Were there changes in work processes in the period preceding the onset of
symptoms?
- Was there an unusual work exposure within 24 hours before the onset of initial asthma symptoms?
- Do asthma symptoms differ during times away from work such as weekends or holidays or other extended times away from work?
- Are there symptoms of allergic rhinitis and/or conjunctivitis symptoms that are worse with work?
Table 4: Key questions suggested in the American College of Chest 744
Physiciansʼ Consensus Statement on Diagnosis and Management of WRA 745
746
When work processes are changed, subjects may be exposed to new 747
agents causing sensitization or increased exposure to previously occurring 748
agents. Sometimes the work process of co-workers is changed, or the 749
subjectʼs workplace is moved to another place where he or she starts to be 750
exposed to a sensitizing agent. Work conditions may have changed, such as 751
new ventilation and exposure to cold air, exhaust gases or second-hand 752
smoke. Sometimes, as in WEA, the underlying asthma worsens when 753
subjects decrease their medication use, or during the spring/summer when 754
the allergen concentration (e.g. pollen) rises. 755
After chemical spills or other high-level exposures to airway irritants, 756
subjects may develop respiratory symptoms within short periods of time that 757
result in them seeking emergency care. This form of WRA is called non- 758
immunological OA. One form of non-immunological OA is RADS, initially 759
described by Brooks and co-workers in 10 individuals who developed a 760
persistent asthma-like illness after a single exposure to high levels of an 761
irritating vapour, fume or smoke. In all subjects, the symptoms developed 762
within a few hours and often minutes after exposure. All had bronchial 763
hyperreactivity on methacholine testing (7). However, some subjects do not 764
meet the criteria for RADS and develop symptoms after days and for a shorter 765
period of time. Many of these subjects are exposed to lower concentrations of 766
Often, a temporary pattern of symptoms related to exposure at the 768
workplace can be established. When workers return to their workplace, they 769
may notice an increase in symptoms the first day or at the end of the workday 770
or realize that their symptoms slowly increase during the working week. On 771
weekends the symptoms may disappear, but in subjects with long-standing 772
illness this improvement may be insignificant. This correlation between 773
symptoms and workplace exposure is present in about 88% of subjects with 774
immunological OA; however, 76% of subjects without proven OA do also see 775
improvement of symptoms when they are away from work (52). Chan-Yeung 776
et al. reported that, even after a change of workplace, symptoms and non- 777
specific AHR can persist in workers with asthma caused by Western red 778
cedar: roughly 60% of workers still had asthma exacerbations after a mean 779
follow-up period of four years (53). 780
All subjects with asthma should be questioned about upper respiratory 781
and eye symptoms. This is especially true for subjects evaluated for OA. 782
Rhinoconjunctivitis symptoms often precede or occur simultaneously with 783
lower airway symptoms. Rhinitis may either be caused or exacerbated by 784
exposures at the workplace. Occupational rhinitis is an inflammatory disease 785
of the nose characterized by intermittent or persistent symptoms (i.e. nasal 786
congestion, sneezing, rhinorrhea, and itching), variable nasal airflow 787
limitation, and/or hypersecretion due to causes and conditions attributable to 788
a particular work environment and not to stimuli encountered outside the 789
between exposures at the workplace and the development of the disease 791
(54). 792
Immunological occupational rhinitis is characterized by the acquisition 793
of sensitization. This category includes occupational rhinitis caused by high 794
and low molecular weight agents (55). Irritant-induced occupational rhinitis 795
includes cases of occupational rhinitis caused by low molecular weight 796
agents. This involves non-allergic, less well-known pathogenic mechanisms 797
and is further sub-classified into acute irritant, chronic irritant, and corrosive 798
rhinitis (55). Subjects with work-aggravated rhinitis have pre-existing rhinitis, 799
the symptoms of which are triggered by exposure to irritants at the workplace 800
(fumes, vapours, and dust) (55). 801
As mentioned earlier, work-related rhinitis symptoms are common in 802
workers exposed to laboratory animals (42%) or who work in swine 803
confinement units (62%). Vandenplas and co-workers have identified a 804
positive relationship between symptoms such as nasal or ocular itching and 805
the diagnosis of OA confirmed by specific inhalation challenge (SIC) (56). In 806
the same study, work-related loss of voice was negatively associated with the 807
diagnosis (56). Allergic rhinitis may precede asthma (57), and it has been 808
shown that effective treatment of rhinitis can decrease the risk for emergency 809
room visits or hospitalization for asthma (58). Contact urticaria has been 810
described in snow-crab processing workers (59) and in health-care workers 811
exposed to natural rubber latex (60). 812
1.1.2.2. Immunologic assessment 814 815
Atopy has been shown to be a risk factor for immunological OA in 816
health-care personnel exposed to HMW allergens such as natural rubber 817
latex (61) and in laboratory-animal handlers (62), but not in workers exposed 818
to diisocyanates (63). 819
In immunological OA due to HMW allergens, specific IgE titers are 820
elevated. Two methods are used to show sensitization: performing SPT or 821
measuring specific IgE antibody assays (radioallergosorbent test (RAST)). 822
SPT is usually performed on the medial aspect of the forearm. Small 823
drops of standardized allergen, histamine and isotonic saline solutions are 824
applied on the untreated skin and inoculated with a prick needle (Figure 2). 825
827
Figure 2: Performing SPT on the forearm 828
829
The patient is told not to rub or scratch the skin until the test is read 830
after 15 minutes. The diameter of the induration is noted and recorded. An 831
induration of up to 3mm in diameter is considered negative. This test detects 832
tissue-bound IgE (64). False positive results can occur in subjects with 833
dermographism, whereas false negative results can occur if patients are on 834
treatment with antihistamines or suffer from immunodeficiency syndromes 835
that affect type I allergic reactions. Sensitivity is decreased if subjects are 836
tested after not being exposed to the allergen for a prolonged time (65). 837
Another limitation is that commercially available allergen solutions are often 838
SPTs have been shown to have high sensitivity for OA to HMW 840
allergens with only moderate specificity. Vandenplas et al. investigated a 841
sample of 45 workers evaluated for OA to natural rubber latex. In their sample 842
sensitivity of the SPT for OA was 100%, specificity was 21%, positive 843
predictive value 75% and negative predictive value 50%. The negative 844
predictive value of SPTs for OA rose when the clinical history was 845
incorporated into logistic regression analysis (64). 846
The RAST was developed in the late 1960s and marketed in 1974 by 847
Pharmacia Diagnostics AB in Sweden. In brief, the patientʼs serum is 848
incubated with the test kit containing specific allergens bound to a solid-phase 849
support. The patientʼs specific IgE binds to the allergens of the test kit. 850
Excess serum and unbound IgE are removed. Radio-labelled antihuman IgE 851
antibody is added to the test kit, binding to the tail of the patientʼs specific IgE 852
and building a sandwich complex. Unbound radio-labelled antihuman IgE is 853
then removed and the sample is measured with a radioactivity counter. The 854
radioactivity measured is proportional to the proportion of radio-labelled 855
antihuman IgE, which is proportional to the amount of patient-specific IgE 856
(66). This method has been further elaborated by using enzyme-based 857
immunoassay systems with higher precision (67). In vitro, specific IgE 858
measurements have been shown to be less sensitive to detecting specific IgE 859
antibodies to HMW-allergens; in workers at enzyme manufacturing plants, 860
SPTs with enzyme solutions had 100% sensitivity compared to 62% 861
assessment is lower in the case of LMW allergens. Extracts of these 863
allergens often cause unspecific irritative cutaneous reactions. Specific IgEs 864
have been described for a minority of LMW allergens: trimellitic anhydride 865
(TMA) in plastic industry workers (69) and platinum salts in workers at a 866
platinum refinery (70). 867
868 869
1.1.2.3. Non-invasive measures of airway inflammation 870
871
Sputum cell counts and measurement of exhaled nitric oxide (ENO) are 872
measurements that assess airway inflammation in asthmatic subjects. 873
Because they are easy to perform, their use has been evaluated in patients 874
with OA. 875
For induced sputum cell counts, sputum is induced by using inhalations 876
of increasing concentrations (3%, 4% and 5%) of hypertonic saline after 877
inhalation of a short-acting bronchodilator (71). As hypertonic saline can 878
cause bronchoconstriction, spirometry is performed to monitor lung function. 879
Immediately afterwards, patients are asked to rinse their mouth, take a sip of 880
water and blow their nose in order to minimize oral contamination of the 881
sputum sample. They are then asked to try to bring up sputum into a 882
container. The sputum is then processed and analyzed according to 883
observed after exposure to HMW allergens such as oilseed rape flour in 885
farmers (73) and to different types of flours after SIC in a laboratory (74), as 886
well as after exposure to LMW allergens such as cyanoacrylates (75), red 887
cedar wood dust (76) and diisocyanates (77). However, sometimes 888
diisocyanates (78) as well as metal working fluids (79) and grain dust (80) can 889
induce sputum neutrophilia, though it is likely that this finding reflects different 890
phenotypes of asthma (81). Lemiere and co-workers investigated 10 subjects 891
with OA and observed a significant increase in sputum eosinophilia at work, 892
which was not observed among controls (82). Girard and co-workers 893
demonstrated that the addition of sputum cell count analysis to peak 894
expiratory flow measurement (PEF) monitoring performed during work and 895
during a period off work improved the specificity of diagnosis for 896
immunological OA confirmed by SIC: a >2% increase in sputum eosinophils 897
improved specificity by 26% (83). 898
Not all subjects with asthma are able to produce sputum for analysis. 899
Matsuoka and co-workers estimated that only 73% of the asthmatics they 900
investigated who were scheduled to undergo sputum cell count analysis 901
produced sputum, and patients with long-standing disease and non-smokers 902
were less likely to produce induced sputum successfully (84). Analysis of 903
induced sputum cell counts is not available everywhere, as special equipment 904
and expertise are needed to achieve reliable and reproducible results. 905
Measurement of ENO is a new non-invasive measurement of airway 906
range of effects, including non-adrenergic, non-cholinergic neurotransmission 908
as well as vascular and non-vascular smooth muscle relaxation (85, 86). 909
Many questions remain to be answered about the role of NO in lung disease. 910
NO has been described as a pro-inflammatory mediator with 911
immunomodulatory effects that has been thought to predispose to the 912
development of AHR (85). However, under physiological conditions NO is a 913
weak mediator that causes smooth muscle to relax and provides protection 914
against AHR (87). Epithelial inducible nitric oxide synthase activity is the 915
major determinant of NO concentration in exhaled breath (88). 916
ENO is elevated in asthmatic subjects who are not currently on steroid 917
treatment compared with non-asthmatic subjects (89). Atopy is a significant 918
factor associated with elevated ENO in asthmatic and non-asthmatic subjects 919
(90). ENO levels are elevated in subjects with non-specific AHR: 83% of 920
asthma patients with AHR to mannitol and 88% of asthma patients with AHR 921
to methacholine do have ENO levels >20 ppb (91). ENO levels have been 922
shown to reflect sputum eosinophilia (92); Smith and co-workers have 923
validated a treatment algorithm based on ENO measurements that makes it 924
possible to reduce inhaled corticosteroids without compromising asthma 925
control (93). 926
ENO levels may rise in asthmatic and non-asthmatic subjects after 927
gassing incidents with exposure to ozone in bleachery workers (94) or 928
toluene, xylene and methylethyl ketone solvents used by leather workers (95). 929
workers with laboratory animal allergy (96). Health-care workers had a 931
significant increase in ENO levels one hour after a latex challenge but after 22 932
hours, levels remained significantly increased only in latex-sensitized 933
subjects, this being related to AHR (97). However, there were no significant 934
differences in ENO levels in latex-sensitized health-care workers when a 935
comparison was made between the beginning and the end of a work week 936
(98). After SIC with different agents, Piipari and co-workers demonstrated 937
that ENO levels significantly increased mainly in subjects with pre-SIC ENO 938
levels of <14.5ppb and a late asthmatic reaction, while subjects with pre-SIC 939
ENO levels of >14.5 ppb and significant bronchoconstriction saw no 940
significant increase in ENO (99). A rise in ENO occurred in two-thirds of 941
subjects with a positive SIC test with diisocyanates, but also in half of 942
subjects with a negative test (100). 943
Although ENO measurement is a promising new tool in non-invasive 944
evaluation of airway inflammation, it has several limitations. Smoking can 945
decrease ENO levels (101); however, smokers who are asthmatic still have 946
elevated levels (102) and ENO levels tend to rise in smokers who stop 947
smoking (103). Respiratory manoeuvres are known to transiently reduce ENO 948
(104), and infection (105) and nitrate-rich meal intake (106) can transiently 949
raise ENO levels. 950
Newer methods such as analysis of breath volatile organic compounds 951
have been shown to help in discriminating healthy controls from patients with 952
to sputum inflammation and a measure of asthma control (107). However, to 954
date this method has not been specifically applied in the investigation of 955
individuals with OA. 956
957 958
1.1.2.4. Lung function tests 959
960
Lung function tests make it possible to measure the severity of airflow 961
limitation, its reversibility and its variability. Two different methods have been 962
proven to reliably assess these parameters: spirometry and peak expiratory 963
flow measurement. Two-thirds of human beings have a diurnal rhythm of 964
airway calibre, but asthmatic subjects have an exaggeration of this rhythm, 965
especially if their asthma is not well controlled (108). 966
The volumetric spirometer measures lung volumes with a water bell or 967
a bellows wedge, whereas the flow-measuring spirometer measures flow with 968
a pneumotachograph, turbines or ultrasound and determines the volumes by 969
extrapolation from measured flow values. Data are expressed in figures such 970
as forced vital capacity (FVC), forced expiratory volume in one second 971
(FEV1) and PEF, or graphically as volume-time curve or flow-volume loop. 972
With these values, we can calculate the Tiffenau Index by dividing the FEV1 973
value by the FVC value. Values below 0.70 are considered abnormal. It is 974
two puffs of a short-acting bronchodilator. After 15 minutes spirometry is 976
repeated and FEV1 and FVC values are compared with previously obtained 977
values. Increases in the FEV1 value of ≥12% and ≥200ml are seen as 978
diagnostic of asthma (109). 979
980
981
Figure 3: Flow volume curves during bronchodilator test 982
983
Population studies have obtained reference values for FVC, FEV1 and 984
PEF based on age, sex and height (110). To be reproducible and 985
comparable, measurements need to be performed according to published 986
Lung function can be measured before and after the working shift, and 988
the difference between these parameters is recorded as “cross-shift” 989
changes. However, the value of determining cross-shift changes is limited, as 990
subjects can have late asthmatic responses that occur after the work shift 991
ends. It is also difficult to standardize the measurement as indirect work 992
exposure when changing work clothes or leaving the workplace through an 993
area of exposure. As workers may work on different shifts, the influence of 994
spontaneous circadian variation adds further confusion to the interpretation of 995
results (112, 113). 996
Patients can take their own peak flow measurements with compact and 997
inexpensive devices. Patients are instructed to measure PEF on work days as 998
well as days off and record the values in a diary. A minimum of four 999
measurements is recommended; more frequent measurements do not seem 1000
to increase sensitivity and specificity (114). Ideally, the measurement period 1001
includes a time where the worker is on holiday for at least two weeks. 1002
According to the GINA guidelines, a diurnal variation in PEF of more than 1003
20% suggests a diagnosis of asthma (115). Figure 4 shows an example of a 1004
1006
Figure 4: Self-recorded peak flow measurement showing classic pattern of 1007
OA 1008
1009
When analyzing PEF recordings of subjects with OA, three different 1010
reaction patterns may be noted: immediate reaction, late reaction and flat 1011
reaction. 1012
Immediate reactions are indicated by a drop in lung function in the first 1013
hour after the worker is exposed to the allergen. Lung function values may 1014
improve shortly after leaving the workplace; for example, during lunch break 1015
or in the evening after leaving work. 1016
Late reactions normally start several hours after the start of exposure 1017
at work and progress even once the worker has left the workplace. Workers 1018
frequently complain of symptoms in the evening after work or during the 1019
Flat reactions are demonstrated in subjects with chronic exposure and 1021
fixed airway obstruction. The diurnal variability of PEF recordings is blunted. 1022
Reading peak flow recordings requires experience and even in experts, 1023
the results can vary, as demonstrated by Baldwin and co-workers (117). This 1024
favours a standardized approach using computer programs like OASYS-2 1025
(OASYS Research Group, Midland Thoracic Society; Birmingham, UK) that 1026
were developed to analyze and simplify the reading of PEF recordings (118). 1027
Although PEF variability is higher in workers with OA compared to 1028
workers with WEA, the method is too insensitive to reliably distinguish 1029
between the subjects (119). PEF recordings depend on the effort of the 1030
patients. PEF manoeuvres have been shown to be less reproducible if 1031
performed by the patient alone compared to performance under the 1032
supervision of a technician (120). Malo and co-workers asked patients 1033
evaluated for OA to perform PEF with a data-logging PEF device and write 1034
down the values in a diary. Only 52% of the recorded values and 71% of the 1035
indicated timing of the measurements in the diary corresponded with the 1036
stored values in the data-logging device (121). 1037
The Agency for Healthcare Research and Quality reviewed studies 1038
evaluating PEF in OA confirmed by specific inhalation challenge. The pooled 1039
estimate of sensitivity was 63.6 %(95% CI: 43.4 to 79.9%); for specificity , it 1040
was 77.2 %(95% CI: 66.5 to 85.2%) (122). 1041
1.1.2.5. Non-specific bronchial provocation tests 1042 1043
AHR is a hallmark of asthma that can be assessed by performing 1044
bronchial provocation tests (BPTs) using direct (methacholine, histamine) or 1045
indirect stimuli (exercise, hypertonic saline, adenosine-monophosphate and 1046
mannitol) (123). One of the advantages of using indirect stimuli to assess 1047
non-specific AHR is that all the common stimuli that provoke an asthma 1048
attack in daily life, such as allergens, cold air, exercise, sulphur dioxide and 1049
fog, act indirectly to cause airways to narrow (124). 1050
In asthmatics, responsiveness to indirect BPT is a better reflection of 1051
indices of airway inflammation, such as sputum eosinophils or ENO, than that 1052
to direct BPT with methacholine (125). In a study of active firefighters, a BPT 1053
using mannitol had higher efficiency and Youden index than a BPT using 1054
methacholine (126). Indirect BPTs are more specific for diagnosis of asthma 1055
(127-129), although they are less sensitive for identifying AHR in a laboratory 1056
study population (130). Using a direct BPT for a young, healthy population 1057
often produces false-positive responses in subjects without asthma 1058
symptoms (131-134). Exercise-induced bronchoconstriction can be missed in 1059
direct BPTs, such as with a histamine or methacholine challenge (135, 1060
136)but it may be better diagnosed using indirect BPTs (137-139). 1061
A BPT using mannitol has been shown to be well correlated with other 1062
to diagnose a 10% decline in FEV1 during eucapnic voluntary hyperpnea 1064
(140). The protocol for performing a BPT using mannitol has been 1065
standardized and validated, allowing easy comparisons. For most subjects, 1066
the duration of the test is <20 min. Compared to current wet aerosol tests, 1067
such as those using methacholine, the equipment used for this test is simple 1068
to use, inexpensive, and does not require any maintenance and cleaning 1069
(141). As with all BPTs, only an office spirometer is required. 1070
For current, widely-used direct tests with methacholine and histamine, 1071
solutions of appropriate concentrations need to be prepared by hospital 1072
pharmacies according to the particular protocol. These solutions need to be 1073
transported to the location where the test is to be performed, and the cold 1074
chain needs to be maintained; otherwise, the vials cannot be used. In 1075
comparison, mannitol test kits come ready to use and can be stored at room 1076
temperature for longer time than methacholine solutions, allowing testing at 1077
the subjectsʼ workplace (142). 1078
For patients with OA who were investigated to assess their 1079
impairment/disability approximately 2 years after their initial diagnosis, we 1080
found that this test is a better marker of disease activity and can differentiate 1081
subjects based on disease severity. Further, concomitant assessment of 1082
airway responsiveness and collecting sputum can be performed at the same 1083
time (143). 1084
However, the current standard in the evaluation of OA is to perform an 1085