Research Article:
JNEUMETH-D-11-00598
Comparison of transcranial magnetic stimulation measures obtained at rest and under active conditions and their reliability
Suzy Ngomo1,2, Guillaume Leonard1,2, Hélène Moffet1,2, Catherine Mercier1,2*
1Centre interdisciplinaire de recherche en réadaptation et en intégration sociale (CIRRIS) 2 Département de réadaptation, Faculté de médecine, Université Laval
* Corresponding author
Corresponding author’s address: Catherine Mercier, OT Ph.D.
Centre interdisciplinaire de recherche en réadaptation et en intégration sociale (CIRRIS) 525 boul. Hamel, Québec (QC) G1M 2S8, Canada
Abstract
Transcranial magnetic stimulation (TMS) studies investigating motor cortex reorganization in clinical populations use a variety of measurements, with some performed at rest and others with the muscle slightly contracted. Surprisingly there are still a limited number of studies focusing on relationship between TMS-measures obtained at rest and during active muscle contraction in healthy individuals. The purpose of this study was to: 1) compare resting and active TMS-measures and assess their association; 2) determine their respective short- and long-term reliability. Motor threshold (MT), motor evoked potentials (MEP) amplitude, map area, normalized map volume, map center of gravity (CoG) and short-interval intracortical inhibition (SICI) of the first dorsal interosseous (FDI) muscle were assessed in 12 healthy subjects. Subjects were tested three times (with a short (four days) and a long (>1 month) inter-session interval). No significant difference was found between resting and active measures, except for MT. Active MT was on average at 82% of resting MT. Good short- and long-term reliability were found for MT and CoG (in resting and active conditions), for the SICI and MEP amplitude at rest and for the normalized map volume under active condition. In conclusion, maps of FDI muscle obtained at rest and during active contraction are very similar to each other in healthy individuals when differences in MT are taken into account. Most TMS measures present good reliability when obtained under the appropriate condition, with comparable short-term and long-term reliability.
Keywords : Transcranial magnetic stimulation; Reliability; Motor maps; aMT; rMT; Center of gravity; Muscle contraction.
Highlights
>Resting and active motor threshold (MT) show a linear relationship. > Resting and active maps are similar when differences in MT are taken into account. > Most of the TMS measures present good reliability under the appropriate condition. >Most of the TMS measures present comparable short-term and long-term reliability.
1. Introduction
Transcranial magnetic stimulation (TMS) is a safe and non-invasive technique that is frequently used to evaluate cortical function and corticospinal pathway in health and disease (Anand and Hotson, 2002; Rossi, 2009). As a consequence of the widespread use of TMS, a large variety of TMS measures are reported in the literature, including motor thresholds (MT), amplitude of motor evoked potentials (MEP), cortical map measures [e.g. size of the cortical map (map area), volume of the map and center of gravity of the map (CoG)] and measures of intracortical inhibitory/facilitatory mechanisms [e.g. short-interval intracortical inhibition (SICI), long-interval intracortical inhibition (LICI), silent period, etc.]. All these measures can be taken at rest or during active contraction of the target muscle. Several studies performed in clinical populations include measurements under both resting and active conditions (Khedr et al., 2011a; Khedr et al., 2011b; Orth, 2009; Vacherot et al., 2010). However there are still a limited number of studies focusing on relationship between TMS-measures obtained at rest and during active muscle contraction in healthy individuals. For example, it remains unclear whether the location of a motor map taken at rest and the location of a motor map taken during muscle contraction are similar. Also, the clarification of the relationship between resting and active TMS measures is necessary to interpret and compare adequately the results of studies using different approaches to set their stimulation protocols. For example, several authors set the intensity of paired-pulse TMS or rTMS stimulations by using a percentage of the resting motor threshold (rMT) (Fisher et al., 2002; Maeda et al., 2002), while others base their calculations on a percentage of the active motor threshold (aMT) (Di Lazzaro et al., 2006; Filipovic et al., 2010; Orth et al., 2003; Ortu et al., 2008).
Another important issue aspect to bear in mind when comparing different TMS measures is their respective reliability. Several studies have investigated the reliability of some TMS measurements (Boroojerdi et al., 2000; Cacchio et al., 2009; Carroll et al., 2001; Corneal et al., 2005; Kimiskidis et al., 2004; Maeda et al., 2002; Malcolm et al., 2006; Mills and Nithi, 1997; Mortifee et al., 1994; Orth et al., 2003; Uy et al., 2002; Wilson et al., 1995; Wolf et al., 2004). However most of these studies have focused on measures taken at rest. Only three studies have reported the reliability of measures taken during active contraction using appropriate statistical approaches (Carroll et al., 2001; Kamen, 2004; van Hedel et al., 2007), and none of these studies have looked at motor map parameters. Moreover reliability studies on measurement taken at
rest often investigated only short-term reliability. Studies looking at intervals of four weeks and more mainly focused on corticospinal excitability measurements (Cacchio et al., 2009; Corneal et al., 2005; Kimiskidis et al., 2004; Mills and Nithi, 1997; Mortifee et al., 1994), neglecting the reliability of motor mapping procedures (except (Malcolm et al., 2006)).
The purpose of this study was two-fold: First, we wanted to compare a variety of TMS measures (at the hotspot: MT, MEP amplitude and SICI; parameters of motor maps: area, normalised volume, center of gravity (CoG)) obtained at rest with those obtained during slight muscle contraction, and to evaluate the relationship between measures taken under these two conditions. A second objective was to systematically assess the test–retest reliability of these measures under resting and active conditions for short and long inter-session intervals.
2. Method 2.1. Participants
Twelve healthy subjects (seven women and five men) aged between 21 and 34 years (mean age 26.5 ± 4.3 years) participated in the study. All subjects but one were right-handed, based on the revised Edinburgh Handedness Inventory (Oldfield, 1971). None of the subjects had a history of neurological deficit, systemic disease, or musculoskeletal disease, and none had sustained upper extremity injuries within the previous three months. Contraindications for magnetic resonance imaging (MRI) or TMS (e.g. metallic or electronic implants, pregnancy, history of epilepsy, etc) were also among the exclusion criteria. The study was approved by the local ethics committee and has therefore been performed in accordance with the ethical standards laid down in the 1964 Declaration of Helsinki. All participants gave their written consent after being informed of the nature and purpose of the study.
2.2. Experimental design
Four aspects of test-retest measurements were examined: (a) short-term reliability with hand muscles tested at rest; (b) short-term reliability with hand muscles tested during muscle contraction; (c) long-term reliability with hand muscles tested at rest and (d) long-term reliability with hand muscles tested during contraction. To assess both short-term and long-term reliability, participants were tested during three separate sessions. There was a fix interval of four days between sessions 1 and 2. Session 3 was performed at least one month after session 2. The inter-session interval between sessions 2 and 3 ranged from 35 to
457 days, with a median interval of 88 days. All participants completed the three sessions except for one who could not attend the last session due to health issues unrelated to the experiment (n = 11 participants for session 3). For each session, the same TMS procedure was performed, both at rest and during muscle contraction.
2.3. Electromyography
After skin preparation, two Ag/AgCl surface recording electrodes (1 cm2 recording area) were placed over the non-dominant first dorsal interosseous (FDI) muscle in a belly-tendon montage, with a ground electrode positioned over the ulnar styloid process. EMG signals were amplified, bandpass filtered (20-1000 Hz), digitized at a sampling rate of 2000 Hz (Power1401 Interface; Cambridge Electronic Design, Cambridge, UK) and stored on a computer for off-line analyses. At the start of each session, the EMG associated with the maximum voluntary contraction (MVC) of the FDI was evaluated. Three successive trials were performed with an inter-trial interval of 30 s, without feedback to the subject. The highest value of the three trials was retained as the MVC, which was used to set the targeted level of FDI contraction (7.5±2.5% of MVC) for active conditions. During testing, the EMG root mean square (RMS) value of the 50 ms timeframe preceding each TMS pulse was verified to ensure that the baseline EMG activity preceding each TMS pulse was appropriate for the conditions tested (rest or 7.5±2.5% of MVC under active conditions).
2.4. TMS procedures
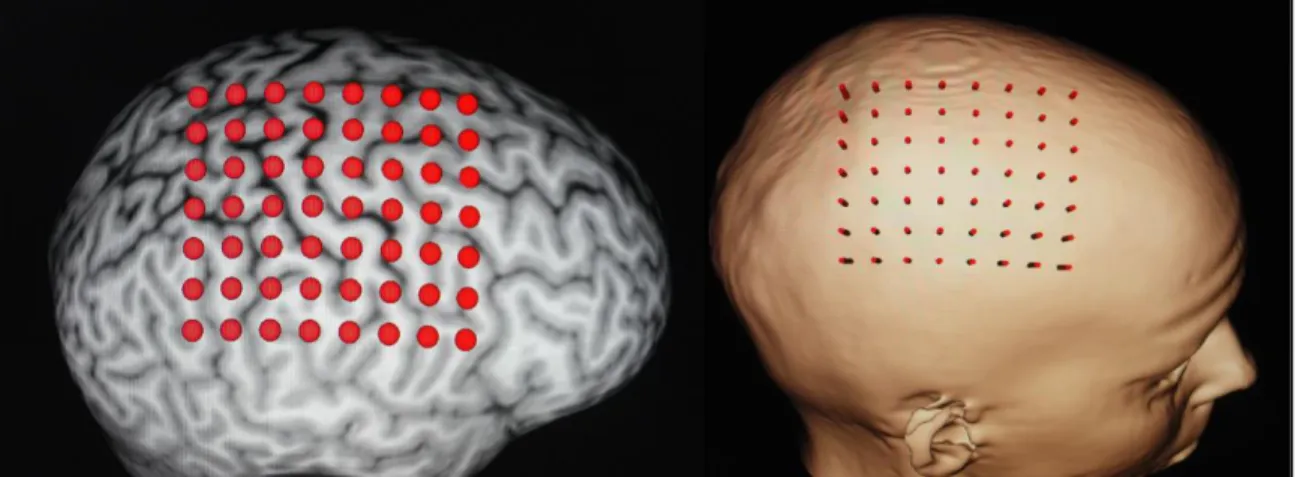
Prior to the TMS session, a 3D image of the head was obtained using magnetic resonance imaging (MRI) for each subject in order to use the frameless stereotaxy neuronavigation system (Brainsight, Rogue Research). The use of a neuronavigation system ensured accurate positioning of the coil throughout a session and across the different sessions. A 56-point grid (with points spaced by 10 mm, with seven rows in the anteroposterior axis and eight columns in the mediolateral axis) was implemented over the precentral gyrus of contralateral hemisphere on the 3D brain reconstruction (see Figure 1). The primary motor cortex (M1) representation of the FDI muscle was mapped using a 70 mm figure-of-eight coil connected to a BiStim TMS stimulator (Magstim, Magstim Company Ltd, U.K). The optimal location (hotspot) of the target muscle was found and used for the assessment of motor threshold and for the paired-pulse procedures.
2.4.1 Motor threshold
Resting and active motor thresholds for the FDI muscle expressed in percentage of the maximum stimulator output (MSO) were determined. The motor threshold at rest (rMT) was defined for each participant as the minimal intensity of stimulation capable of eliciting MEPs of at least 50 µv in 50% of the trials with the FDI at rest (no muscle contraction). Alternately, the active motor threshold (aMT) was defined as the minimal TMS intensity that produced MEP amplitudes of at least 120% of background EMG in at least 50% of the trials (6 out of 12 trials), with muscle contraction maintained to 7.5±2.5% of the MVC. Visual feedback of the EMG activity was given to the subject during active conditions in order to ensure stable muscle contraction.
2.4.2 Motor mapping
The different points of the grid were stimulated with six successive TMS pulses separated by intervals of 4 to 6 s (random interval). The mapping was first performed with the muscle at rest, and then with the muscle contracted. It is important to note that the resting and active conditions were tested with a TMS intensity set at 110% of the rMT and aMT, respectively (and not with the same absolute intensity of stimulation). For each point and condition, the peak-to-peak amplitude of the recorded MEP was measured and averaged using Spike 2 software (Cambridge Electronic Design, Cambridge, UK). The different TMS variables were then extracted: 1) MEP amplitude at the hotspot, 2) map area, 3) normalised map volume, and 4) center of gravity (CoG). CoG was computed for the mediolateral (x), anteroposterior (y) and inferior to superior (z) coordinates relative to the vertex (expressed in mm) using the following formula: CoGx = (Σxi * MEPi) / ΣMEPi ; CoGy = (Σyi * MEPi) / ΣMEPi and CoGz = (Σzi * MEPi) / ΣMEPi; where MEPi represents the mean amplitude of the MEPs produced at one site (Wassermann et al., 1992).
Map area was calculated as the sum of the active points/ sites. A standardized grid was used across subjects (inter-site distance of 10 mm), with the number of active sites truly representing the cortical area. A site was considered active if (1) at least two MEPs ≥ 50 µv were elicited out of six stimulations (resting conditions) or (2) if at least two MEPs clearly discernable from the background EMG were elicited (active conditions). Map boundaries were delimited by non-active sites which had produced one MEP. Normalized volume was calculated by adding mean amplitudes of each stimulated site divided by the mean MEP amplitude at the site where the largest responses were obtained.
2.4.3 Paired pulse procedure
The protocol used for the evaluation of the short intracortical inhibition (SICI) was similar to the protocol described by Kujirai (Kujirai et al., 1993),with a subthreshold conditioning stimulus followed by a suprathreshold test stimulus, both delivered at the hotspot. The stimulus intensity of the conditioning pulse was adjusted to 80% of the rMT for resting conditions and 80% of the aMT for active conditions. The second pulse (test stimulus) was given at an intensity of 120% of the rMT (resting conditions) and 120% of the aMT (active conditions). The interval between the conditioning and test stimulus was set at 3 ms. Ten trials were performed for each of the two conditions (test stimuli only and 3 ms paired-pulse stimuli). The two conditions were presented in a randomized order with the inter-trial interval varying between 4 and 6 s. The paired-pulse procedure at rest was performed immediately after the mapping performed at rest, while the paired-pulse procedure under the active conditions was performed immediately after the mapping in active conditions. The amplitude of the conditioned MEPs was expressed in percentage of the test stimuli response.
2.5. Data pre-processing and statistical analysis
The different TMS-related measurements studied were analyzed in relation to the two objectives of this study.
In order to ensure that the voluntary muscle activity during active conditions was comparable between the three sessions, comparisons and correlations of MVC values were made between sessions 1 and 2 and between sessions 1 and 3 using paired-sample t-tests and Pearson’s test.
2.5.1. Comparison of resting and active measures and their association
To verify whether testing under resting and active conditions convey similar information, comparisons were performed between resting and active TMS measures of session 1, using paired-sample t-tests. Pearson correlation analyses were also used to assess the association between the measures obtained at rest and the measures obtained during active conditions.
2.5.2. Reliability analyses
Prior to reliability analyses, the statistical dispersion (between-subject variability) was assessed using the coefficient of variation (CV). The CV is defined as the ratio of the standard deviation to the mean [CV=σ/|µ|] (higher values reflecting higher dispersion).
To assess reliability, intra-class correlation coefficients (ICC) based on a two-way random effects analysis of variance (ANOVA) were used. ICC values vary from 0 to 1, with 1 indicating perfect reliability. Results for ICC were interpreted as follows: (1) reliability of measures with ICC ≥ 0.90 was considered excellent; (2) reliability of measures with ICC ranging from 0.75 to 0.89 was considered good; and (3) reliability of measures with ICC under 0.75 was considered poor to moderate (McGraw and Wong, 1996; Portney and Watkins, 2000; Shrout and Fleiss, 1979).
Because the ICC does not allow us to fully appreciate the magnitude of within-subject variance, we also calculated the standard error of measurement (SEM) and the smallest real difference (SRD) (Beckerman et al., 2001). According to Beckerman et al. (2001) and Stratford (2004), the SEM represents the within-subject reliability of the measure and, consequently, the reliability of the measure (Beckerman et al., 2001; Stratford, 2004). The SEM was determined using the following formula: SEM = √MSE, where MSE = mean square error. The SRD represents the threshold over which an individual change can be considered significant when taking into account the variability associated with both the measurement technique and the experimental sample (Beckerman et al., 2001) and was calculated using the equation SRD = 1.96 * √2 * SEM, where SEM = standard error of measurement. The SEM and SRD were calculated when good to excellent reproducibility was found (ICC>0.75 and/or CV<0.15).
For all the analyses, the results were considered to be significant if p < 0.05 was obtained. All tests were performed using SPSS (version 13.0 for Windows, Chicago, IL, USA).
3. Results
Comparison of MVC values indicated similar levels of muscle contraction across the different sessions. Indeed, paired-sample t-tests revealed no significant differences of MVC values between sessions (all p-values >.30). Pearson’s tests showed good correlations for MVC values obtained at sessions 1 and 2 and for MVC values obtained at sessions 1 and 3 (all r ≥ .89, all p-values <.001).
3.1. Comparison of resting and active measures and their association
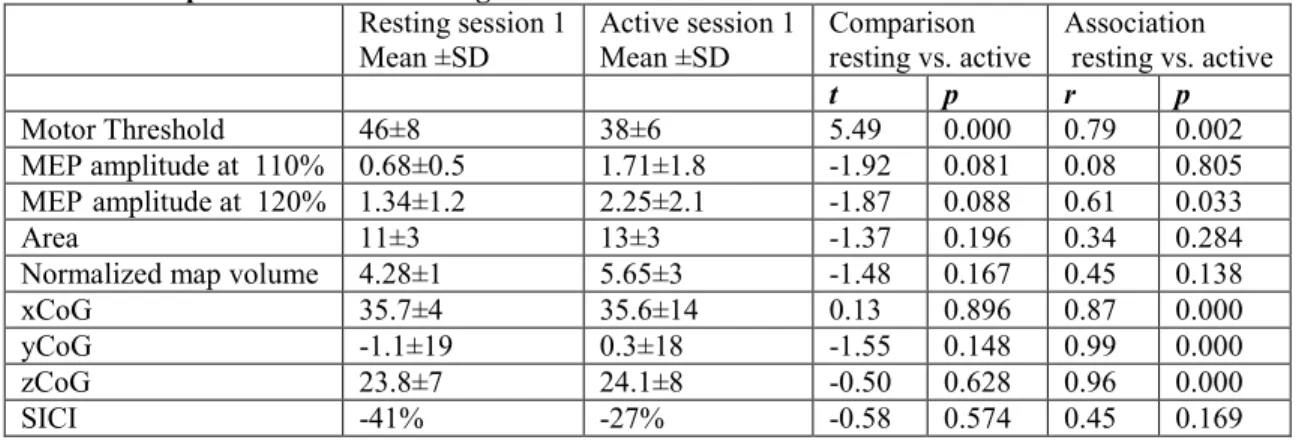
Descriptive statistics for the different TMS measures obtained at rest and during muscle contraction are presented in Table 1. Unsurprisingly, a significant difference was observed between the resting motor threshold (rMT) and active motor threshold (aMT), with the rMT being higher than the aMT. There was also a tendency for MEP amplitude to be larger in active conditions compared to resting
conditions, but the difference did not reach statistical significance (note that intensity of stimulation was adjusted to aMT and rMT respectively). This tendency was observed both for the MEP amplitude obtained with TMS intensity set at 110% of MT and for MEP amplitude obtained with TMS intensity set at 120% of MT. No differences between the active and resting conditions were found for all the other TMS measures (areas, normalized volume, CoG, and SICI).
For the correlation analyses, a positive association was found between the resting and active conditions for MT, MEP amplitude obtained at 120% of MT and CoG values. No significant correlation was found for MEP amplitude obtained at 110%, map area, normalized map volume and SICI. Association between motor thresholds in the resting vs. active conditions is depicted in Figure 2. As this association is of particular interest when comparing paired-pulses or rTMS paradigms (e.g. some authors adjusting intensity of stimulation relative to the rMT while others use the aMT), it is interesting to note that aMT corresponds on average to 82% of rMT.
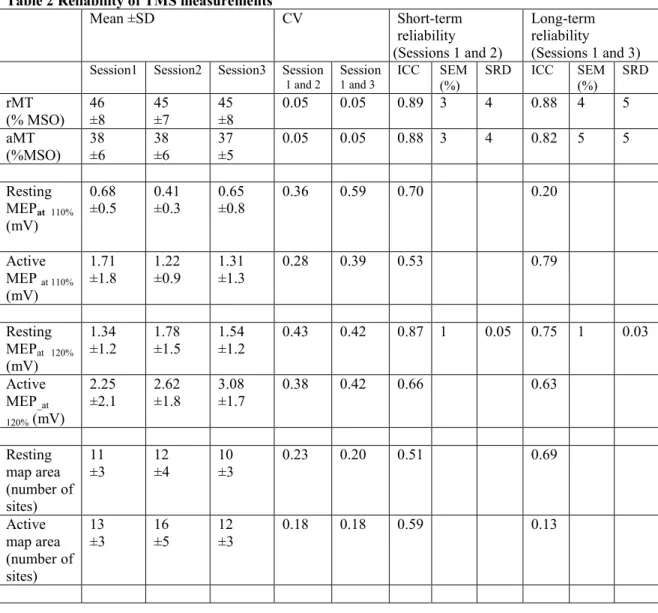
3.2. Reliability of TMS measures
The different reliability indices are presented in Tables 2 and 3. rMT and aMT measures showed good short-term and long-term reliability. Amplitude of the MEP obtained at 120% of the MT showed moderate to good reliability for the two conditions. Moderate short-term and long-term reliability was found for normalized map volume in active conditions. Poor to moderate short-term and long-term reliability were found for normalized map volume at rest, MEP amplitude obtained at 110% of MT (resting and active conditions) and map area (resting and active conditions).
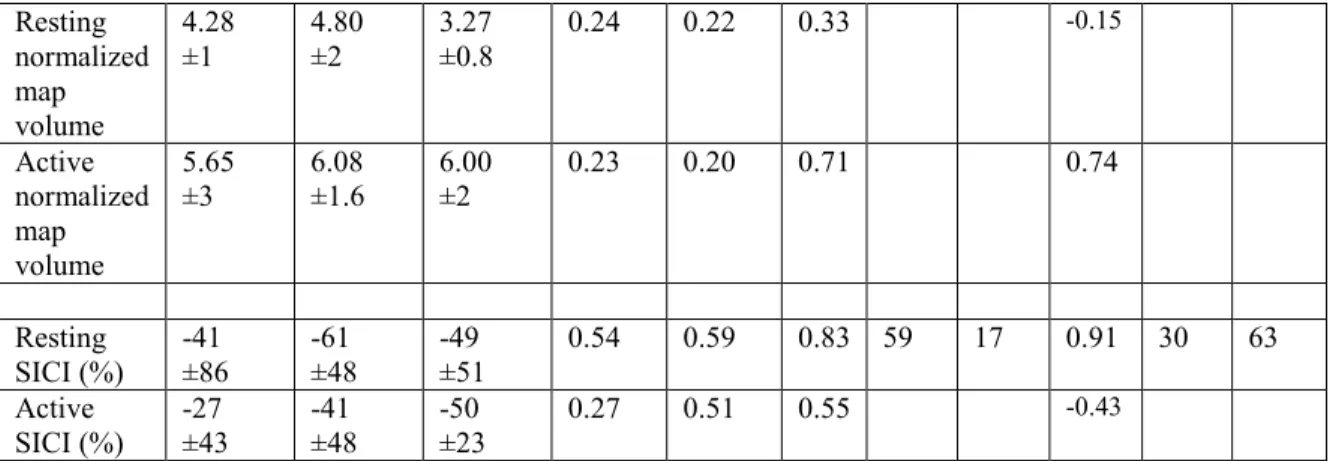
According to the ICC, all CoG measures showed good to excellent short-term and long-term reliability in both resting and active conditions except in the x axis (see Table 3). In particular, the ICC showed poor to moderate reliability in the mediolateral axis (x) and good to excellent reliability in the anteroposterior (y) and inferior-superior (z) axis. For the SEM, all CoG measures showed excellent short-term and long-short-term reliability (in the three axes) in both resting and active conditions. Finally, according to the CV, the between-subject variability of CoG location was relatively high in the anteroposterior axis (y) and relatively low in the two other axes.
Good short-term and long-term reliability was found for the SICI under resting but not under active conditions. Despite the high ICC values obtained in resting conditions, the CV and SEM values were relatively high, suggesting important between- and within-subject variability of SICI, respectively.
4. Discussion
Results of the present study bring new information regarding the comparability of TMS maps obtained at rest and under active conditions. Moreover, although several previous studies have investigated reliability of TMS measures, the present study adds additional information on several important aspects. First, while most of the previous studies assessed the reliability of TMS measures taken only at rest, this study evaluated the reliability of TMS measures under both resting and active conditions. Second, we have systematically investigated within the same study the reliability of various TMS measures (including motor map parameters), with both short-term and long-term intervals, which allow comparisons between different types of measures.
4.1. Comparisons of TMS measures between resting and active conditions and their association Motor threshold. In the present study, intensities of stimulation were adjusted based on the individual motor threshold obtained under the same conditions. In agreement with earlier reports, our results show that the aMT was significantly lower than the rMT (Buccolieri et al., 2004; Quartarone et al., 2006; Wassermann, 2002), and that there is a strong linear association between these two measures (Deblieck et al., 2008; Wassermann, 2002). Our data showed that aMT of the FDI corresponds on average to 82% of rMT. This information can be used to facilitate comparisons between studies. For example it confirms that when performing a SICI protocol, using an intensity of stimulation (for the conditioning stimulus) of 100% of the aMT (Di Lazzaro et al., 2006; Orth et al., 2003) or of 80 % of rMT (Fisher et al., 2002; Maeda et al., 2002) should yield similar results.
MEP amplitude. Several studies have shown that the MEP amplitude is enhanced by muscle contraction (Buccolieri et al., 2004; Christova et al., 2006; Darling et al., 2006; Devanne et al., 1997; Hasegaw et al., 2001; Helmers, 1989; Roshan et al., 2003; Turton and Lemon, 1999). Our results suggested a similar tendency for the active MEPs to be greater than the resting MEPs, but this difference did not reached significance (p<0.09, both at 110% and 120% of MT). This lack of statistically significant difference might be attributable to the small sample size (limited statistical power increasing the probability
of committing a type-II error) and to the considerable trial-to-trial variability in MEP amplitude (Pitcher et al., 2003; Smith et al., 2011)).
The examination of the relationship between resting MEP amplitudes and active MEP amplitudes revealed that there was no significant association when MEPs were obtained at 110% of the MT. Alternately, when the intensity of stimulation was set at 120% of the MT, a significant association between the two conditions was observed. Again, the absence of a significant association between resting and active MEPs for measures obtained at 110% of the MT could reflect the large trial-to-trial variability of MEP amplitude. This variability can be particularly important at lower stimulation intensities (Pitcher et al., 2003). Importantly, the presence of an association for MEP amplitudes obtained at 120% of MT but not for MEPs obtained at 110% of MT (and the better reliability observed for MEP amplitudes obtained at 120%; see reliability section) suggests that higher stimulation intensities should be preferred.
Motor map parameters. To our knowledge, only one group have compared motor maps obtained at rest and during active contraction in healthy subjects, and those two studies have been conducted in five subjects, without a neuronavigation system (Wilson et al., 1995, 1993). These authors reported a medial shift of the optimal stimulus site and/or the CoG between resting and active conditions, suggesting a difference in the location of the map. Results of the present study, performed with MRI-guided TMS and using a larger sample, do not support that view however. Similar results (e.g. comparable CoG location at rest and during contraction) have been reported recently in patients with upper limb amputation (for above-elbow muscles on the amputated and intact side) (Gagné et al., 2011). This suggests that in individuals with high resting motor thresholds, mapping the motor representation with the muscle slightly contracted should yield results (for the CoG) that are comparable to those that would be obtained at rest (although it is still unknown whether this remains true for all muscle groups). Moreover, the present results showed no significant differences between the map area and volume obtained at rest and during active contraction, a finding consistent with previous results (Wilson et al., 1995).
SICI. Lack of difference between the SICI measured at rest and during active conditions is somewhat surprising given that some authors have reported decreased inhibition under active conditions compared to resting conditions (Fisher et al., 2002; Ridding et al., 1995). However, the effect of muscle contractions on intracortical inhibition has been shown to vary according to the intensity of muscle
contractions (SICI decreases as the muscle contractions increase, and a low contraction level (7.5±2.5% of MVC) was used in the present study), to the intensity of the conditioning stimulus as well as to the intensity of the test stimulus (Ortu et al., 2008; Roshan et al. 2003). The fact that a fix stimulation intensity was used in our study (120% of rMT or aMT) resulted in larger test MEPs in the active condition compared to the resting condition. This quick and simple procedure to assess SICI (fix intensities relative to MT and single inter-stimulus interval) was employed because of the focus of this study on motor mapping (a time-consuming procedure). A study focusing exclusively on SICI and systematically investigating these factors would be needed in order to understand better the differences between SICI at rest and during active contraction, and to identify the most reliable approach.
4.2. Reliability of TMS measures
Motor Threshold. Our results corroborate several studies which reported good short- and long-term reliability of MT at rest (Corneal et al., 2005; Kimiskidis et al., 2004; Maeda et al., 2002; Malcolm et al., 2006; Wolf, 2004). In agreement and in extension to a few studies reporting short-term reliability of aMT (Carroll et al., 2001; Kamen, 2004), we observed good to excellent short- and long-term reliability for aMT. Moreover, The SRD were relatively low (≤5% of the MSO), indicating that rMT and aMT are sensitive to change. So, if a change greater than 5 % of the MSO is recorded in an individual after a given intervention, there is a high probability that this represents a real change.
MEP amplitude. Moderate to good reliability has been reported for MEP size of the FDI muscle at rest (ICC = 0.60-0.81) and under active condition (ICC= 0.63-0.73) (Kamen, 2004). In extension to these results, results of the present study suggest that MEP amplitude is more reliable for MEPs obtained at 120% than those obtained at 110%, particularly when taken at rest. This suggests that using higher intensity of stimulation might improve the stability and the reliability of MEPs.
Normalized map volume and area. Previous studies regarding the reliability of TMS measures have provided equivocal results, with some studies demonstrating moderate to good reproducibility for normalized map volume and for map area (Malcolm et al., 2006; Wolf, 2004), and other studies showing poor to moderate reproducibility for the same measures (Kiers et al., 1993; Mortifee et al., 1994). The trial-to-trial variability of MEP amplitude is well known (Kiers et al., 1993; Pitcher et al., 2003; Smith et al.,
2011) and could explain these equivocal results. Our data showed poor reliability for map area either at rest or under active condition, but for map volume a better reliability was observed under active condition.
CoG. In addition to previous studies informing the range of variation for the CoG location at rest for short-term intervals (Miranda et al., 1997; Uy et al., 2002; Wolf et al., 2004), the present study establishes the range of normal variation in CoG location under active conditions and for long-term inter-sessions. The inspection of the ICC values listed in Table 3 could give the impression that the reliability of the CoG in the mediolateral axis (x) is poor. One has nevertheless to remember that ICC are greatly influenced by inter-subject variance (Beckerman et al., 2001). Hence, the low ICC observed in the x axis probably reflects the lack of inter-subject variability in the CoG location, as illustrated in Figure 3. This view is further supported by the low SEM values observed for the x axis. The standard error of measurement (SEM) in the x axis is low in resting and active TMS sessions both at short and long-term interval, demonstrating the within-subject reliability and consequently the good reliability of this measure. Since the resting and active reliability coefficients were similar, our results support the idea that the stability of CoG measures is comparable under active and resting conditions.
SICI. We found good short- and long-term reliability at rest but poor short- and long-term reliability in the active condition. In the past, very few studies evaluated the reliability of SICI (Boroojerdi et al., 2000; Maeda et al., 2002; Orth et al., 2003), and none looked at its reliability under active conditions. The present results corroborate and extend these previous findings by showing that resting - but not active - SICI measures have good test-rest reliability. Importantly, it has to be underlined that reliability of SICI during active contraction might be better using a different paired-pulse paradigm (e.g. a different inter-stimulus interval or a smaller intensity for the conditioning inter-stimulus). However, at this point our results suggest that SICI measures should be taken at rest to ensure good reproducibility. A recommendation that is somewhat dampened by the high SEM values observed for resting SICI, which reminds the experimenter that the information gathered from paired-pulse protocol needs to be carefully interpreted when it comes down to determine clinically significant changes. The higher SRD observed (i.e. 63%) suggests that a change greater than 63% following an intervention represents a real change. Nevertheless, SRD values do not per se indicate undeniable changes. Therefore, it is best to examine SRD in relation to changes in other outcome measurements.
4.3 Limitations
An important limitation of the present study concerns the relatively small number of participants tested. Small sample sizes potentially decrease the power of the analyses, hence increasing the probability of committing a type-II error. Moreover only one intrinsic hand muscle was tested, so at this stage the results cannot be generalized to all muscle groups.
Another limitation concerns the important variability for the time interval between the second and third sessions. Contrary to the time interval between the first and second testing sessions (which was fixed at 4 days for all subjects), the interval between the second and third sessions varied between 35 and 457 days (median interval = 88 days). In order to ensure that these disparities did not affect calculation of the different test-retest coefficients, we performed Pearson correlation analyses between the time interval and the absolute delta scores of the different TMS measures i.e. [delta score = |value obtained at session 1 – value obtained at session 3|]. These analyses showed no significant correlation (all p-values > .05), suggesting that the time interval did not affect the stability/ reliability of the measures.
5. Conclusion
In conclusion, our study provides a systematic comparison between TMS-measures taken in resting and active conditions. It yields novel information on the relationship between resting and active CoG and on the reliability of several TMS measurements (especially motor maps parameters) taken under active conditions (compared to the same measurement taken at rest). Maps obtained at rest and during active contraction were shown to be very similar to each other when the stimulation intensity is adjusted to the MT taken in the corresponding condition. MT and CoGs were found to be the most reliable measures under both resting and active conditions. Other TMS measures presented a better reliability either at rest (SICI) or under active contraction (map volume). Long-term reliability of TMS measures was found to be very similar (e.g. comparable ICC) to the short-term reliability.
Acknowledgments
This study was supported by the Natural Sciences and Engineering Research Council of Canada (NSERC). Research infrastructure was provided by the Canadian Foundation for Innovation (CFI). C. Mercier was supported by the Fonds de la recherche en santé du Québec (FRSQ) and the Canadian Institute for Health
Research (CIHR). S. Ngomo was supported by Centre interdisciplinaire de recherche en réadaptation et en integration sociale (CIRRIS) and the FRSQ. G Léonard was supported by CIHR. Support was provided by the Consortium d’imagerie en neuroscience et santé mentale de Québec (CINQ) for MRI acquisition. The authors wish to thank Maxime Lee-Vézina and Sandra Therrien for help with data collection, and Pierre-Olivier Lauzon for technical support.
References
Anand S, Hotson J. Transcranial magnetic stimulation: Neurophysiological applications and safety. Brain and Cognition 2002; 50: 366-86.
Beckerman H, Roebroeck ME, Lankhorst GJ, Becher JG, Bezemer PD, Verbeek ALM. Smallest real difference, a link between reproducibility and responsiveness. Quality of Life Research 2001; 10: 571-8.
Boroojerdi B, Kopylev L, Battaglia F, Facchini S, Ziemann U, Muellbacher W, Cohen LG. Reproducibility of intracortical inhibition and facilitation using the paired-pulse paradigm. John Wiley & Sons, Inc., 2000: 1594-7.
Buccolieri A, Abbruzzese G, Rothwell JC. Relaxation from a voluntary contraction is preceded by increased excitability of motor cortical inhibitory circuits. The Journal of Physiology 2004; 558: 685-95.
Cacchio A, Cimini N, Alosi P, Santilli V, Marrelli A. Reliability of transcranial magnetic stimulation-related measurements of tibialis anterior muscle in healthy subjects. Clinical Neurophysiology 2009; 120: 414-9.
Carroll TJ, Riek S, Carson RG. Reliability of the input-output properties of the cortico-spinal pathway obtained from transcranial magnetic and electrical stimulation. Journal of Neuroscience Methods 2001; 112: 193-202.
Christova MI, Pondev NG, Christova LG, Wolf W, Dengler R, Kossev AR. Motor cortex excitability during unilateral muscle activity. Journal of Electromyography and Kinesiology 2006; 16: 477-84. Corneal SF, Butler AJ, Wolf SL. Intra- and Intersubject Reliability of Abductor Pollicis Brevis Muscle
Motor Map Characteristics With Transcranial Magnetic Stimulation. Archives of Physical Medicine and Rehabilitation 2005; 86: 1670-5.
Darling W, Wolf S, Butler A. Variability of motor potentials evoked by transcranial magnetic stimulation depends on muscle activation. Experimental Brain Research 2006; 174: 376-85.
Deblieck C, Thompson B, Iacoboni M, Wu AD. Correlation between motor and phosphene thresholds: A transcranial magnetic stimulation study. Human Brain Mapping 2008; 29: 662-70.
Devanne H, Lavoie BA, Capaday C. Input-output properties and gain changes in the human corticospinal pathway. Experimental Brain Research 1997; 114: 329-38.
Di Lazzaro V, Pilato F, Oliviero A, Dileone M, Saturno E, Mazzone P, Insola A, Profice P, Ranieri F, Capone F, Tonali PA, Rothwell JC. Origin of Facilitation of Motor-Evoked Potentials After Paired Magnetic Stimulation: Direct Recording of Epidural Activity in Conscious Humans. J Neurophysiol 2006; 96: 1765-71.
Filipovic SR, Rothwell JC, Bhatia K. Slow (1 Hz) repetitive transcranial magnetic stimulation (rTMS) induces a sustained change in cortical excitability in patients with Parkinson's disease. Clinical Neurophysiology 2010; 121: 1129-37.
Fisher R, Nakamura Y, Bestmann S, Rothwell J, Bostock H. Two phases of intracortical inhibition revealed by transcranial magnetic threshold tracking. Experimental Brain Research 2002; 143: 240-8. Gagné M, Hétu S, Reilly KT, Mercier C. The map is not the territory: Motor system reorganization in
upper limb amputees. Human Brain Mapping 2011; 32: 509-19.
Hasegaw Y, Kasai T, Kinoshita H, Yahagi S. Modulation of a motor evoked response to transcranial magnetic stimulation by the activity level of the first dorsal interosseous muscle in humans when grasping a stationary object with different grip widths. Neuroscience Letters 2001; 299: 1-4.
Helmers S, Chiappa, KH., Cros, D., Gupta, N., Santamaria J. . Magnetic stimulation of the human motor cortex: facilitation and its relationship to a visual motor task. J Clin Neurophysiol. 1989; 6: 321-32.
Kamen G. Reliability of Motor-Evoked Potentials during Resting and Active Contraction Conditions. Med. Sci. Sports Exerc. 2004; 36: 1574-9.
Khedr EM, Ahmed MA, Darwish ES, Ali AM. The relationship between motor cortex excitability and severity of Alzheimer's disease: A transcranial magnetic stimulation study. Neurophysiologie Clinique/Clinical Neurophysiology 2011a; 41: 107-13.
Khedr EM, Ahmed MA, Hamdy A, Shawky OA. Cortical excitability of amyotrophic lateral sclerosis: Transcranial magnetic stimulation study. Neurophysiologie Clinique/Clinical Neurophysiology 2011b; 41: 73-9.
Kiers L, Cros D, Chiappa KH, Fang J. Variability of motor potentials evoked by transcranial magnetic stimulation. Electroencephalography and Clinical Neurophysiology/Evoked Potentials Section 1993; 89: 415-23.
Kimiskidis VK, Papagiannopoulos S, Sotirakoglou K, Kazis DA, Dimopoulos G, Kazis A, Mills KR. The repeatability of corticomotor threshold measurements. Neurophysiologie Clinique/Clinical Neurophysiology 2004; 34: 259-66.
Kujirai T, Caramia MD, Rothwell JC, Day BL, Thompson PD, Ferbert A, Wroe S, Asselman P, Marsden CD. Corticocortical inhibition in human motor cortex. The Journal of Physiology 1993; 471: 501-19.
Maeda F, Gangitano M, Thall M, Pascual-Leone A. Inter- and intra-individual variability of paired-pulse curves with transcranial magnetic stimulation (TMS). Clinical Neurophysiology 2002; 113: 376-82.
Malcolm MP, Triggs WJ, Light KE, Shechtman O, Khandekar G, Gonzalez Rothi LJ. Reliability of motor cortex transcranial magnetic stimulation in four muscle representations. Clinical Neurophysiology 2006; 117: 1037-46.
McGraw K, Wong SP. Forming Inferences About Some Intraclass Correlation Coefficients. Psychological Methods 1996; 1: 30-46.
Mills KR, Nithi KA. Corticomotor threshold to magnetic stimulation: Normal values and repeatability. John Wiley & Sons, Inc., 1997: 570-6.
Miranda PC, de Carvalho M, Conceição I, Sales Luis ML, Ducla-Soares E. A new method for reproducible coil positioning in transcranial magnetic stimulation mapping. Electroencephalography and Clinical Neurophysiology/Electromyography and Motor Control 1997; 105: 116-23.
Mortifee P, Stewart H, Schulzer M, Eisen A. Reliability of transcranial magnetic stimulation for mapping the human motor cortex. Electroencephalography and Clinical Neurophysiology/Evoked Potentials Section 1994; 93: 131-7.
Oldfield RC. The assessment and analysis of handedness: The Edinburgh inventory. Neuropsychologia 1971: 97-113.
Orth M. Transcranial magnetic stimulation in Gilles de la Tourette syndrome. Journal of Psychosomatic Research 2009; 67: 591-8.
Orth M, Snijders AH, Rothwell JC. The variability of intracortical inhibition and facilitation. Clinical Neurophysiology 2003; 114: 2362-9.
Ortu E, Deriu F, Suppa A, Tolu E, Rothwell JC. Effects of volitional contraction on intracortical inhibition and facilitation in the human motor cortex. The Journal of Physiology 2008; 586: 5147-59. Pitcher JB, Ogston KM, Miles TS. Age and sex differences in human motor cortex input-output
characteristics. The Journal of Physiology 2003; 546: 605-13.
Portney LG, Watkins MP. Foundations of clinical research: Applications to practice, 2nd ed. Upper Saddle River, NJ, Prentice-Hall., 2000.
Quartarone A, Rizzo V, Bagnato S, Morgante F, Sant'Angelo A, Girlanda P, Roman Siebner H. Rapid-rate paired associative stimulation of the median nerve and motor cortex can produce long-lasting changes in motor cortical excitability in humans. The Journal of Physiology 2006; 575: 657-70. Ridding MC, Taylor JL, Rothwell JC. The effect of voluntary contraction on cortico-cortical inhibition in
human motor cortex. The Journal of Physiology 1995; 487: 541-8.
Roshan L, Paradiso GO, Chen R. Two phases of short-interval intracortical inhibition. Experimental Brain Research 2003; 151: 330-7.
Rossi S, Hallett, M., Rossini, Paolo M., and Pascual-Leone, Alvaro. Safety, ethical considerations, and application guidelines for the use of transcranial magnetic stimulation in clinical practice and research. Clinical Neurophysiology 2009; 120: 2008-39.
Shrout P, Fleiss J. Intraclass correlations: uses in assessing rater reliability. Psychological bulletin 1979; 86: 420-8.
Smith AE, Sale MV, Higgins RD, Wittert GA, Pitcher JB. Male human motor cortex stimulus-response characteristics are not altered by aging. Journal of Applied Physiology 2011; 110: 206-12.
Stratford PW. Getting more from the literature: estimating the standard error of measurement from reliability studies. Physiother Can 2004; 56: 27-30.
Turton A, Lemon RN. The contribution of fast corticospinal input to the voluntary activation of proximal muscles in normal subjects and in stroke patients. Experimental Brain Research 1999; 129: 559-72.
Uy J, Ridding M, Miles T. Stability of Maps of Human Motor Cortex Made with Transcranial Magnetic Stimulation. Brain Topography 2002; 14: 293-7.
Vacherot F, Attarian S, Eusebio A, Azulay JP. Excitability of the lower-limb area of the motor cortex in Parkinson's disease. Neurophysiologie Clinique/Clinical Neurophysiology 2010; 40: 201-8. van Hedel H, Murer C, Dietz V, Curt A. The amplitude of lower leg motor evoked potentials is a reliable
measure when controlled for torque and motor task. Journal of Neurology 2007; 254: 1089-98. Wassermann E. Variation in the response to transcranial magnetic brain stimulation in the general
population. Clinical Neurophysiology 2002; 113: 1165-71.
Wassermann E, McShane L, Hallett M, Cohen L. Noninvasive mapping of muscle representations in human motor cortex. Electroencephalogr Clin Neurophysiol 1992; 85: 1 - 8.
Wilson SA, Thickbroom GW, Mastaglia FL. Comparison of the magnetically mapped corticomotor representation of a muscle at rest and during low-level voluntary contraction. Electroencephalography and Clinical Neurophysiology/Electromyography and Motor Control 1995; 97: 246-50.
Wilson SA, Thickbroom GW, Mastaglia FL. Transcranial magnetic stimulation mapping of the motor cortex in normal subjects: The representation of two intrinsic hand muscles. Journal of the Neurological Sciences 1993; 118: 134-44.
Wolf SL, Butler AJ, Campana GI, Parris TA, Struys DM, Weinstein SR, Weiss P. Intra-subject reliability of parameters contributing to maps generated by transcranial magnetic stimulation in able-bodied adults. Clinical Neurophysiology 2004; 115: 1740-7.
Wolf SL, Butler, A. J., Campana, G. I., Parris, T. A., Struys, D. M., Weinstein, S. R. and P. Weiss. Intra-subject reliability of parameters contributing to maps generated by transcranial magnetic stimulation in able-bodied adults. Clinical Neurophysiology 2004; 115: 1740-7.
Table 1 Comparison between resting and active TMS measures Resting session 1
Mean ±SD Active session 1 Mean ±SD Comparison resting vs. active Association resting vs. active
t p r p
Motor Threshold 46±8 38±6 5.49 0.000 0.79 0.002
MEP amplitude at 110% 0.68±0.5 1.71±1.8 -1.92 0.081 0.08 0.805 MEP_amplitude at 120% 1.34±1.2 2.25±2.1 -1.87 0.088 0.61 0.033
Area 11±3 13±3 -1.37 0.196 0.34 0.284
Normalized map volume 4.28±1 5.65±3 -1.48 0.167 0.45 0.138
xCoG 35.7±4 35.6±14 0.13 0.896 0.87 0.000
yCoG -1.1±19 0.3±18 -1.55 0.148 0.99 0.000
zCoG 23.8±7 24.1±8 -0.50 0.628 0.96 0.000
Table 2 Reliability of TMS measurements Mean ±SD CV Short-term reliability (Sessions 1 and 2) Long-term reliability (Sessions 1 and 3)
Session1 Session2 Session3 Session
1 and 2 Session 1 and 3 ICC SEM (%) SRD ICC SEM (%) SRD rMT (% MSO) 46 ±8 45 ±7 45 ±8 0.05 0.05 0.89 3 4 0.88 4 5 aMT (%MSO) 38 ±6 38 ±6 37 ±5 0.05 0.05 0.88 3 4 0.82 5 5 Resting MEPat 110% (mV) 0.68 ±0.5 0.41 ±0.3 0.65 ±0.8 0.36 0.59 0.70 0.20 Active MEP at 110% (mV) 1.71 ±1.8 1.22 ±0.9 1.31 ±1.3 0.28 0.39 0.53 0.79 Resting MEPat 120% (mV) 1.34 ±1.2 1.78 ±1.5 1.54 ±1.2 0.43 0.42 0.87 1 0.05 0.75 1 0.03 Active MEP_at 120% (mV) 2.25 ±2.1 2.62 ±1.8 3.08 ±1.7 0.38 0.42 0.66 0.63 Resting map area (number of sites) 11 ±3 12 ±4 10 ±3 0.23 0.20 0.51 0.69 Active map area (number of sites) 13 ±3 16 ±5 12 ±3 0.18 0.18 0.59 0.13
Resting normalized map volume 4.28 ±1 4.80 ±2 3.27 ±0.8 0.24 0.22 0.33 -0.15 Active normalized map volume 5.65 ±3 6.08 ±1.6 6.00 ±2 0.23 0.20 0.71 0.74 Resting SICI (%) -41 ±86 -61 ±48 -49 ±51 0.54 0.59 0.83 59 17 0.91 30 63 Active SICI (%) -27 ±43 -41 ±48 -50 ±23 0.27 0.51 0.55 -0.43 SEM (%): Standard error of measurement; SRD: Smallest real difference in respective units; CV: Coefficient of variation; ICC: Intra-class coefficient.
Table 3 Reliability of CoG position
CoG
Short-term reliability
(Sessions 1 and 2) Long-term reliability (Sessions 1 and 3)
Resting Active Resting Active
x y z x y z x y z x y z
Mean distance from
the vertex (mm)±SD 35 ±4 14 ±11 24 ±8 35 ±5 13 ±11 ±8 24 35 ±4 14 ±10 23 ±8 35 ±4 14 ±10 24 ±8 Mean diff. (mm) 1.42 1.42 0.05 1.66 0.33 0.36 1.21 2.64 1.02 0.83 0.27 0.35 CV 0.08 0.83 0.08 0.10 0.51 0.10 0.10 0.30 0.10 0.09 0.22 0.13 ICC 0.68 0.80 0.95 0.65 0.84 0.92 0.65 0.90 0.96 0.45 0.91 0.91 SEM (%) 5 8 2 6 6 3 4 7 3 4 4 4 SRD (%) 14 21 7 16 17 9 11 21 9 12 12 10 SRD (mm) 5.07 2.96 1.63 5.55 2.15 2.15 3.86 2.89 2.17 4.36 1.72 2.44 SEM: Standard error of measurement; SRD (%): Smallest real difference in percentage;
SRD: Smallest real difference in respective units; CV: Coefficient of variation; ICC: Intra-class coefficient; X: mediolateral axis; Y: antero posterior axis; Z: inferior to superior axis.
Fig. 1 Grid of points on the reconstructed brain. Mapping was performed by successively stimulating the different sites on the grid, starting at the hotspot, until the map was surrounded by inactive sites (number of MEPs≤1 out of six stimulations)
Fig. 2 Relationship between rMT and aMT. y is the regression equation; the dotted line represents perfect similarity; the full line represents the line of best fit
Fig. 3 Position of the resting map CoG in mediolateral (x axis) and in anteroposterior (y axis) across two sessions. This figure illustrates the fact that the lower ICCs obtained for the mediolateral axis compared to the anteroposterior axis are explained more by very small inter-subject variability than by large intra-subject variability across sessions