is an open access repository that collects the work of Arts et Métiers Institute of Technology researchers and makes it freely available over the web where possible.
This is an author-deposited version published in: https://sam.ensam.eu
Handle ID: .http://hdl.handle.net/10985/7464
To cite this version :
Aleksandra BIERLA, Guillaume FROMENTIN, Clotilde MINFRAY, Jean-Michel MARTIN, Thierry LE MOGNE, Nicole GENET - Mechanical and physico-chemical study of sulphur additives effect in milling of high strength steel - WEAR - Vol. 286-287, p.116-123 - 2013
Any correspondence concerning this service should be sent to the repository
MECHANICAL AND PHYSICO-CHEMICAL STUDY OF SULFUR ADDITIVES EFFECT IN MILLING OF HIGH STRENGTH STEEL
ALEKSANDRA BIERLA1, GUILLAUME FROMENTIN1, CLOTILDE MINFRAY2,
JEAN-MICHEL MARTIN2, THIERRY LE MOGNE2, AND NICOLE GENET3
1
LaBoMaP, Arts et Metiers ParisTech Cluny, Rue Porte de Paris, F-71250 Cluny, France
2
LTDS, Ecole Centrale de Lyon, 36 avenue Guy de Collongue, F-69134 Ecully Cedex, France
3
TOTAL France, Centre de Recherche de Solaize, Chemin du canal BP22, F-69360 Solaize
Corresponding author:
Guillaume Fromentin, TEL.: +33 385 595 330, FAX: +33 385 595 370, guillaume.fromentin@ensam.eu
Abstract
Most machining operations require the presence of a cutting fluid in order to ensure their success due to the intensity of thermal and mechanical conditions
generated on the cutting tools. In some cases of severe machining, the fluid contributes to lubrication in a physicochemical way thanks to the additives it contains. This study aims to analyze the tribochemical mechanisms of lubrication during milling operations and subsequently at optimizing the lubricant formulation. The objective of this study is also to identify and to compare, the performance of various Extreme Pressure (EP) sulfur-containing additives, and to understand their action mechanisms in metal cutting. Physico-chemical analyses are carried out by means of Auger Electron Spectroscopy (AES) and X-ray Photoelectron Spectroscopy (XPS) with the purpose of detecting the nature of additive reaction products on the surfaces involved in cutting and correlating them with the milling results. The polysulfide additive is found to exhibit the best efficiency (decrease of specific cutting energy and tool wear) in the tested milling
conditions. A correlation is found between the additive chemical reactivity and the milling test results.
Keywords: Milling, EP sulfur additives, Cutting fluid, Physico-chemical analysis (XPS, AES)
1. Introduction
European regulations have already banned the use of chlorinated or lead-containing compounds and have mandated the progressive decrease in use of certain
molecules in lubricants considered to be toxic, such as phosphorus- or sulfur- containing
compounds. Thus, the optimization of the lubricant formulation is mostly based on the
adjustment of the number and the concentration of the additives, or on the replacement
of commonly used additives by improved ones (products of controlled chemical
synthesis whose stability, toxicity and performances are usually better known). So far, this solution is applied while taking into account the insurmountable difficulty of
substituting sulfur compounds, which have an essential lubricating role in metal cutting: no other chemical agents act as efficiently over the range of thermal and mechanical conditions generated in machining.
Sulfur additives are well-known for their strong extreme-pressure (EP) and anti-wear (AW) characteristics [1-4]. In addition, some of them have anti-oxidation properties. All these qualities essentially depend on the chemical structure of a given additive. The sulfur compounds, under EP conditions, undergo chemical decomposition causing sulfur release (rupture of the R-S bond) and their reaction with the metallic surface that
promotes the formation of an inorganic iron sulfide layer. This chemical breakdown occurs when the friction, and the resulting rise in the temperature, becomes too
significant for the native-iron-oxide layers to protect the two surfaces in contact against seizure or welding; the sulfur compounds show a chemical affinity to non-oxidized and freshly created surfaces (these surfaces possesses a very high chemical reactivity) [5-7].
The long-term objective in lubricant formulation will undoubtedly be to conceive fluids containing the minimum amount of additives but guaranteeing high performance. However, metalworking fluid, consisting of several chemically active additives, has a very complex chemical composition. The individual actions of each component and/or their interactions with each other are not easily identifiable. This fact has a major impact on the power of optimization for future lubricants, particularly for straight cutting oils, whose efficiency only depends on the chemical activity of their additives. Therefore, knowledge of the separate contributions from different types of sulfur additives to the lubrication in metal cutting could be an important step in optimizing some lubricants by selecting only the most efficient molecules for their composition.
The evaluation of the performance of cutting fluids is usually carried out by a tapping test. This method is defined by standards such as ASTM D5619-00 and
NordTest Mech 039. According to this approach, improvement in the chemical
composition of lubricants is obtained by correlating the mechanical results from tapping [8-9] with physico-chemical studies. Nevertheless, machining techniques generate different levels of temperature, pressure and sliding speed; thus, tapping results cannot be directly applied to all cutting techniques.
For example, milling is a machining technique in which the cutting action is not continuous. Indeed, a given tooth on a milling cutter is engaged in the work material less than half of the duration of a revolution (it can reach half of the duration of a revolution in the case of slot milling). The cyclic nature of the technique may be important with
regards to lubrication; the cutting fluid would be in contact with the teeth when they are out of the work material and before they enter again into the matter. However, when compared to external turning, as shown in Fig. 1, milling increases the contact length of the tool flank face with work material. This has a negative impact on the action of the lubricant on the flank contact. In addition, the cutting conditions usually applied in milling differ from those used in tapping.
Thus, the aim of this study is:
to evaluate one by one (specific cutting energy and tool wear measurements) the lubrication efficiency in milling of three sulfur additives (solubilized in paraffinic base oil), representative of different chemical families, and used widely in current lubricant formulations, for metalworking fluids,
to investigate their physico-chemical modes of action by analyzing their reaction products with the chip surfaces and thus to explain their efficiency in milling; X-ray Photoelectron Spectroscopy (XPS) and Auger Electron Spectroscopy (AES) are employed for the surface analysis; Transmission Electron Microscopy (TEM) observations on Focused Ion Beam (FIB) cross section are also performed on the chip in order to visualize the generated tribofilm,
to enhance the knowledge about the lubrication mechanism involving the sulfur compounds in cutting with straight oils.
2. Experimental materials
2.1. Tested procedure and blends preparations
Three different blends are prepared for the milling test; each of them consists of paraffinic base oil mixed with one of the three different sulfur additives studied (S1-pentasulfide, S2-sulfurized and esterified fatty oils and S3-methylene
bis(dibutyl-dithiocarbamate)). The tested sulfur additives are synthesized by various manufacturers and intended for providing EP properties to straight cutting oils. Each additive contains different amounts of sulfur in each molecule (by weight) and the sulfur bonding
mechanism is different in each additive. For example, according to manufacturers data, additives S1 and S3 contain twice as much sulfur as additive S2. Since the primary objective is the comparison of the changes in the chemical structure of the additives during the milling process, the additives are solubilized in the base oil to obtain a similar sulfur content in each mixture, in this case approximately 1% wt.; therefore, the mass concentration of an additive in the blend changes as a function of its sulfur content in the molecule. The paraffinic base oil used as a lubricant base belongs is chemically non-active and highly refined without any sulfur or nitrogen residues. Therefore, the only significant tribochemical reactions are due to the additives. Table 1 shows the available information about the prepared lubricants, their viscosities and their designations used for this study.
2.2. Milling set-up and experimental procedure
A 42CrMoV4 low alloyed steel has been chosen for the milling tests. It has a bainitic structure and its ultimate strength is near 1100 MPa. This steel is very common in the mechanical industry and is an excellent representative of the high strength steels used in machining. Milling tests are conducted using an uncoated solid carbide cutter made of tungsten carbide with a cobalt binder. It is a 10 mm diameter mill with 3 flutes.
Considering its cutting geometry, the rake angle is 6° and the helix angle s is 30°.
Two kinds of milling experiments are made on a 3 axis CNC milling machine equipped with a 18 000 rpm spindle. In the first, milling tests are completed by
measuring cutting forces in order to quantify the ability of the additives to reduce friction. Separately, wear milling tests are carried out to evaluate their anti-wear properties. During all these tests, the milled samples are immersed in a special box filled with the studied cutting fluids. The box capacity is approximately two liters and lubricant
temperature is kept constant during the milling tests. This practice allows a rapid cutting fluid exchange and it makes the cleaning procedure of the experimental material easier.
In order to prevent cross-contamination between the different blends, the box is thoroughly cleaned between each fluid change.
2.2.1 Cutting force experiments
For cutting force measurements, a 9123C Kistler dynamometer is used. This piezoelectric sensor has relatively good sensitivity. Its bandwidth is adapted to the tooth frequency allowing the measurement of cutting force variations during the milling
experiments. The rotating sensor holds the mill and measures 3 forces (Fx, Fy, Fz) and
Mz torque. In order to analyze the effect of fluid on milling, the specific cutting energy (kc)
is considered. It represents the energy needed to remove a given volume of work
material. The specific cutting energy is calculated from the cutting power (Pc) and tge
chip removal rate (Q) as shown in equation (1), and as explained by the ISO 3002-4
standard [10]. The cutting power is obtained from the measured mean torque (Mz) and
the spindle speed ( ), cf. equation (2). The chip removal rate (Q), is deduced from the
feed rate (Vf), the axial depth of cut (adoc) and the radial depth of cut (rdoc), cf. equation
(3). These parameters are detailed in the ISO 3002-3 standard [11].
(1) (2) (3)
During these tests, axial depth of cut (adoc) and radial depth of cut (rdoc) are fixed
to 2 mm. As a result of the radial engagement and the mill diameter, the cutting edges
are working 15% of the time. The impact of cutting speed (Vc) and feed (fz) on the
efficiency of cutting fluids is also studied. The cutting speed was set to 60, 120 and 180 m/min, and the feed was 0.1, 0.2 and 0.3 mm/rev/tooth.
All tests use mills coming from the same batch, and a new mill is used for each fluid. Prior to their use, the cutting edges are optically inspected to check for geometric defaults, which could significantly affect the results. Unfortunately, small differences on micro cutting geometry may have some influence on the cutting forces. In order to measure the effect of the fluid on the cutting forces, each cutter undergoes short dry milling tests.. From these preliminary dry cutting experiments, correction coefficients are evaluated and applied afterwards on the force measurements for each mill used with the tested fluids. Through this method, the micro differences affecting the cutting forces
between mills (less than 5%) are compensated, and therefore they are not involved in the measurement of the fluid efficiency. Another series of tests are subsequently carried out to verify the results of cutting force measurements presented in this paper. These complementary tests show that the variations obtained with the different blends in comparison to dry milling are similar.
2.2.2. Wear experiments
Wear tests are conducted twice in order to appreciate the repeatability of the measurements; the flank wear results presented are the mean values of the two wear tests. The rotating dynamometer is not used anymore and a shorter, more rigid tool holder is employed. This eliminates tool vibration which may affect the wear behaviour of the mills during the tests. For these tests, the cutting speed is fixed to the middle range of previous values, i.e. 120 m/min and the feed to 0.05 mm/rev/tooth.
The flank wear on a mill is evaluated by using the Vb criterion which is optically
measured, as defined by ISO 8688-2 standard [12]. These Vb results are reported as a
function of cutting time in order to quantify the wear resistance of mill linked to the use of a given fluid. The experiment is stopped after 20 minutes of milling for the purpose of minimizing wear during the test. The developed approach consists of comparing the mill
wear, i.e. Vb flank wear, obtained for each fluid after this fixed machining time to
evaluate their efficiency of the fluid in reducing tool wear.
2.3 Surface analysis of chips
The chip surfaces are analyzed by XPS and AES. These two techniques can determine the elemental composition of the extreme surfaces (XPS and AES), and the nature of the chemical bonds existing between the different elements (XPS). For XPS, it is also possible to get semi-quantitative information by taking into account peak area. The combination of AES and ion etching establish the elemental composition in depth.
The XPS analysis is carried out with an Al Kα line excitation source under ultra
_high vacuum conditions (10-6 Pa). The analytical device is also equipped with an
electron gun (FEG1000, Field Emission Gun) for AES analysis and a VG EXO5 ion gun for ion etching and depth profiling. The detection is made by the VG ESCALAB 220i spectrometer. This unit is the same one used in Ref. 8 and 9. XPS and AES spectra are recorded and processed using specialized software (Thermo Avantage®). All XPS features are fitted using a Shirley background and a Lorentzian to Gaussian ratio (L/G) of 60%. The Full Width of Half Maximum (FWHM) was kept equal for each contribution
Scofield sensitivity factors are employed for the determination of atomic percentages. Different parameters influence this semi-quantification results (sensitivity factors, transmission function of spectrometer, sample rugosity etc…) but thanks to previous experiments on our apparatus with model materials, the relative error is estimated to be less than 10%.
All pieces intended for analysis are washed ultrasonically in a bath of pure n-heptane. To avoid modification of the surface, and possible shifting of the sulfur peaks, no ion etching was performed before XPS analyses. AES analysis is used for obtaining
depth profiles of the chips. Their surfaces are etched with Ar+ in the following conditions:
2 kV, 2x2 mm2, 10-4 Pa.
For one fluid (F1), the tribofilm obtained on the chip face in contact with the tool rake face is visualized by TEM observations on FIB cross section. The FIB milling is used to prepare a thin cross section of the chip tribofilm. The TEM observations are performed on a JEOL 2010F.
3. Results
3.1 Milling test results
3.1.1. Effect of fluid on specific cutting energy
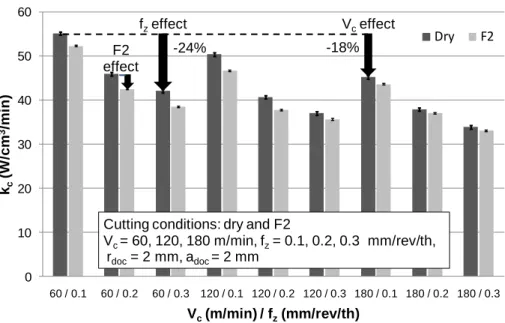
The milling tests show that the specific cutting energy is influenced by several parameters. Whatever the cutting fluid used, an increase in cutting speed leads to a small decrease in specific cutting energy, as shown on Fig. 2 (for dry milling and milling with fluid F2). That observation is commonly explained by the thermal softening of the work material and tool-work material friction reduction during machining. This effect has been reported by T.H.C. Childs [13]. Fig. 2 also shows that an increase in the feed contributes to a large decrease in the specific cutting energy. This second observation is also expected, and it is explained both by the effective evolution of the cutting geometry and by creation of serrated chips, which is related to adiabatic shear bands, when the uncut chip thickness is higher. Furthermore, it can be seen by comparing dry milling and results with F2 that the efficiency of fluid is reduced when cutting conditions become severe.
The effect of cutting fluid on the measured specific cutting energy may be
regarded as the lubrication efficiency of the fluid. A general tendency, valid for any fluid, cannot be inferred from Fig. 3. The use of the paraffinic base oil without any additive does not decrease the specific cutting energy, compared to dry milling. On the contrary,
milling with a cutting fluid containing additives does contribute to a decrease. However, this benefit does not exceed 15% (for fluid F1). The effect of the lubricant on the specific cutting energy diminution may not appear as significant, but it can not be interpreted directly. The major part of the specific cutting energy is linked to plastic strain during chip formation. Thus, the sensitivity of the specific cutting energy to friction is quite low.
Therefore, a small reduction in the specific cutting energy may be the result of a significant reduction in the friction. This assumption is confirmed by cutting force
simulations, as a function of different friction coefficients, using the Merchant model [14]. According to the criterion of specific cutting energy reduction, the S1 additive is considered the most efficient additive. The S2 additive is next. Neither the S3 additive nor the base oil seem to have an effect in terms of friction reduction. However, no definitive statement can be inferred on the effect of the fluid blends on the specific cutting energy. The variation between the effects of the additives is less than 5 %, and even a qualitative conclusion is difficult to obtain. Furthermore, the main interest is the tool wear resistance linked to the use of a fluid, and one additive may increase friction and also preserve from wear.
3.1.2 Effect of fluid on tool wear
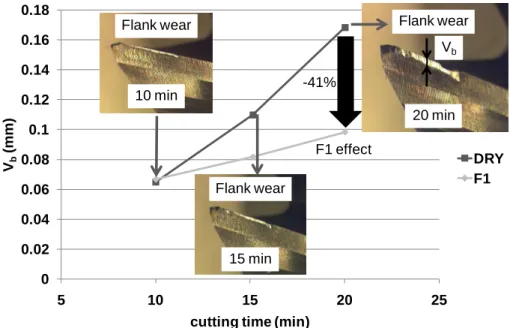
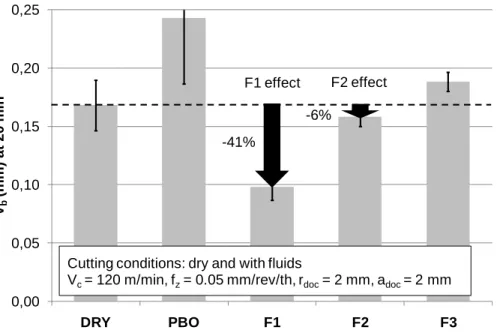
Wear tests lead to very significant results. As shown in Fig. 4, the amount of flank wear is affected by the use of a fluid. In addition, the mill wear is different for each of the fluid blends, cf. Fig. 5. tested. Globally, the cutting fluids have a larger effect (positive or not) on the flank wear than on the specific cutting energy.
For the most efficient fluid - the one containing the additive S1 - the flank wear after 20 minutes of milling is approximately 40% lower than in dry milling. This
demonstrates that the friction reduction may not correspond to the wear reduction. As observed with the cutting force measurement test, milling with paraffinic base oil or with the F3 fluid has no positive effect on the tool wear resistance. With the F2 fluid, there is a relative reduction in the friction compared to dry milling (- 6%), but it does not protect the mill from wear as well as the F1 fluid (- 6% versus -41%).
3.2 Chips surface analysis
In this part of the study, the side of the chip which was in contact with the rake face of the tool is subjected to analysis. This should be the zone in which the action of the lubricant is the most significant, thus presenting significant quantities of the additives’
reaction products. The chips are obtained in the following cutting conditions: Vc = 60
According to AES analysis, the extreme surfaces of the chips obtained while milling with three tested blends (F1, F2 and F3) are essentially composed of carbon,
oxygen, sulfur and iron. Afterwards this technique is combined with Ar+ ion etching and a
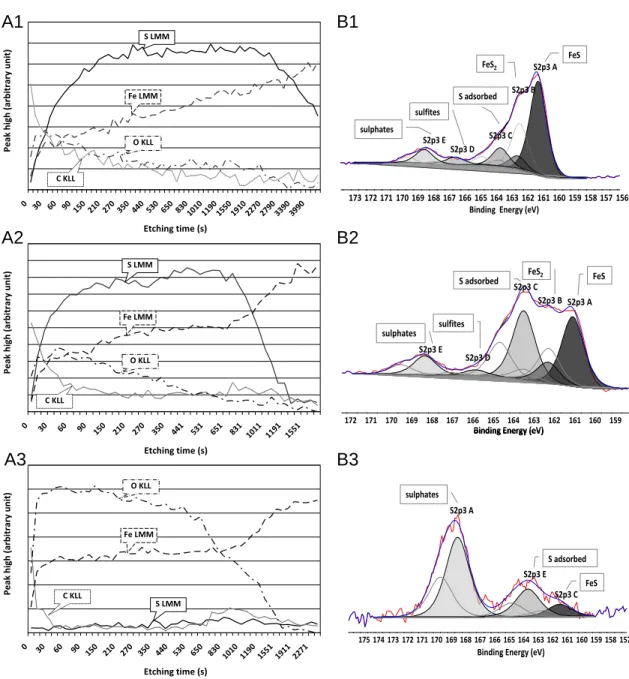
depth profile of the chip is achieved. This allows the determination of the elemental distribution in the depth of the surface, to identify the different zones constituted by these elements, and to compare their thicknesses. Fig. 6(A1) and Fig. 6(A2) show the AES profiles carried out on the chips obtained with F1 and F2 fluids, respectively. These two depth profiles are relatively similar. The adventitious carbon and superficially distributed oxygen compounds (such as metallic oxides or oxidized sulfur compounds) are removed from both surfaces after a few tens of seconds of ion etching; however, given the slow decrease of the curves corresponding to carbon and oxygen content in the surface (cf. Fig. 6(A1) and 6(A2)), their presence through both surfaces can be inferred. Finally, more or less abundant layer made up mainly of sulfur undoubtedly bound to iron is differentiated. The sulfurized layer on the chip surface obtained with F1 blend is probably at least twice as thick as those formed with the F2 fluid; after approximately 1000 s of etching, the layer is still present on the surface obtained with F1 blend while it is removed from the chip surface obtained with F2. AES depth-profile of the chip surface obtained with F3 fluid presented in the Fig. 6(A3) distinguishes itself significantly from both profiles discussed previously. The oxygen and iron are the two most important surface components. This chip surface is obviously covered by a thick layer of iron and other metallic oxides. There is no film essentially composed of sulfur.
The XPS analysis carried out on the new chip surfaces (not etched), obtained with the three tested fluids, and confirms their chemical compositions as determined by AES analysis. It should be noted that trace elements are not taken into account during the analysis. In agreement with the depth-profiles examined previously, the major difference between the chip surfaces obtained with the three tested blends is the
quantity of sulfur observed on their surfaces. The chip surface obtained with F1 is richer in sulfur than those obtained with F2. There is almost no sulfur detected on the chip surface of F3 blend. From here, detailed analysis of the sulfur spectra is performed for the purpose of identifying its chemical nature.
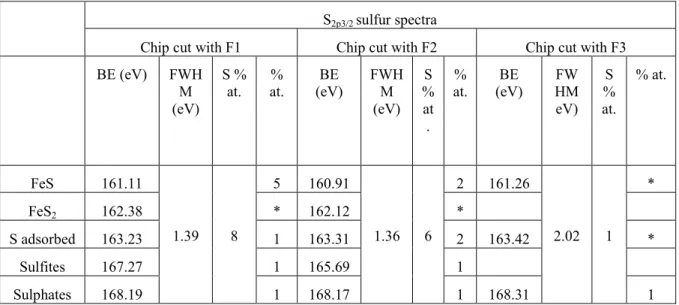
Table 2 presents the chemical nature, the binding energies, the FWHM and the atomic percentages of the various sulfur species identified and detected on the chip surfaces obtained with F1, F2 and F3.
Fig. 6(B1) shows the XPS spectrum of the sulfur peak recorded during the analysis of the chip surface obtained with F1 blend. The main peak at 161.11 eV
corresponds to iron sulphide FeS (approximately 5 at. %), and is confirmed by the
position of the Fe2p3/2 peak. Four other peaks, much less intense (approximately 1 at. %
each), can be attributed to iron sulphide FeS2, adsorbed additive/sulfur, sulfites and
sulphates. The presence of the same sulfur compounds is discerned on the chip surface obtained with F2 (cf. Fig. 6(B2)). However, according to table 2, the total quantity of the sulfur detected on its surface is less than in the case of those obtained with the F1 blend; additionally, there is twice less iron sulphide FeS but more adsorbed compounds compared to the first one (cf. table 2 and Fig. 6(B2)). Fig. 6(B3) displays the sulfur peak on the chip surface obtained with F3. Very little sulfur (1 at. %) is detected on the
surface of this chip (cf. table 2). However, traces of iron sulphide FeS and adsorbed additive/sulfur are noticeable.
In order to complete the results obtained by AES and XPS surface analyses, a FIB cross section is performed on a chip obtained with F1 fluid. TEM observations are carried out on the tribofilm present on the side of the chip in contact with the rake face of the tool. A tribofilm (Fig. 7a) is clearly distinguished between the steel and a protective Platinum layer (layer generated during FIB cross section preparation process). Its
thickness varies between 40 to 70 nm. According to EDS analyses (Fig. 7b), the tribofilm composition correlates with the XPS results: the layer is mainly composed of iron and sulfur atoms but it also contains carbon and oxygen.
4. Discussions
The chip is a very important source of information about tribological phenomena taking place near or inside the cutting zone; the access of the fluid to the cutting zone remains uncertain and it is related to other machining parameters (machining operation, cutting conditions etc.). In consequence, even if the moment of formation for the additive reaction products can not be precisely determined, the chip analysis can determine the behavior of a given additive when it is subjected to very high temperature and pressure conditions. This may allow us to relate the additives’ reactivity to the efficiency in milling.
XPS analysis establishes the chemical composition of the sulfurized film detected on the chip surfaces obtained with F1 and F2 fluids. It is principally composed of iron
sulphides FeS, iron sulphides FeS2 and adsorbed additives; this result is in general
agreement with possible reaction pathways of sulfur additives in EP conditions, as described in the literature [15-18]. The sulphites and sulphates are the oxidation products of the sulfur compounds and have no influence on the lubricant performance
[19]. The generation of iron sulphides such as FeS and FeS2 in tribological contacts
comparison of the tribological behaviour of FeS and FeS2 crystals has shown that an
effect on friction is obtained [21]. FeS has a lower friction coefficient than FeS2; this is
probably related to its lamellar structure. A strong correlation exists between the quantity of sulfur in FeS form (FeS ratio compared to total sulfur detected on the surface), the thickness of the sulfurized layer, and the performance of the lubricant in terms of
generating lower cutting energy and reducing tool wear in comparison to dry cutting: the thicker the sulfurized film on the chip surfaces, the better the performance of the tested blend. Thus, the sulfur additives efficiency in milling is equivalent to the ease with which they deliver sulfur to the surface for the formation of iron sulphide FeS. It can be
deduced that the S1 additive releases sulfur more easily than the S2 additive. In addition, while quantity important, the formation rate of a sulfurized film is much more significant. Contrary to both previous additives, the S3 additive seems to be thermally stable and does not decompose with ease. The sulfur enclosed in the S3 additive
molecule is not very mobile; this leads to very few reactions and a low quantity detected on the chip surface; the chip surface obtained with the F3 blend is covered with an oxide layer. The weak reactivity of the S3 additive explains its low performance in both milling tests (cutting energy and tool wear measurements).
Finally, a correlation between the chemical activity of additives and the milling test results can be made. Polysulfide additive gives the best milling results which is related to its ability to easily provide sulfur atoms. It is still difficult to know if the sulfur atoms (or its reaction products) can enter into the contact area or not. One possible lubrication
mechanism may be via transfer of iron sulfides material onto the mills’ faces. As the milling is a discontinuous cutting technique, the tools’ faces would provide “fresh” iron sulfides products in the contact area at each revolution. However, this needs further investigations to be confirmed.
5. Conclusions
(1) The presented study evaluates the performance of three EP additives in the milling of a high strength steel. The experimental approach is based on measurement of cutting forces and wear tests.
(2) This study proves an advantage of using an efficient fluid in comparison to dry cutting, particularly in terms of tool life. The friction reduction property of sulfur additives seems to be closely connected to their ability to reduce the tool wear.
(3) AES and XPS analyses of the chips’ surfaces clearly show the fundamental
Even if the sulfur content in the three tested blends is the same, the efficiency of additives in milling is markedly different; a deeper understanding of the chemical
structure and the thermal behaviour effects of the additives on the lubricating efficiency during metal cutting is necessary to improve lubricant formulation.
(4) Thanks to TEM observations, the tribofilm obtained on the chip with F1 fluid (side in contact with the tool rake face) is clearly visualized.
(5) A very strong correlation between the results of the fluid efficiency evaluation by milling tests (cutting force and tool wear measurements) and the surface analysis of the pieces involved in the cutting process necessitate interest for such complementary studies.
6. Acknowledgements
The authors would like to express their appreciation to the TOTAL France
Company for the technical and financial contribution to this study and to Béatrice Vacher for TEM images.
7. References
[1] F.P. Bowden, D. Tabor, The friction and lubrication of solids, Oxford Classic texts in the physical Sciences, Ch. 11 Action of extreme-pressure lubricants, Oxford classic series, New York, 2001, pp. 228-246.
[2] E.S. Forbes, The load-carrying action of organo-sulphur compounds – a review, Wear, 15-2 (1970) 87-96.
[3] W. Davey and E.D. Edwards, The extreme-pressure lubricating properties of some sulphides and disulphides in mineral base oil as assessed by the four-ball
machine, Wear, 1 (1957/58) 291-304.
[4] M.N. Najman, M. Kasrai, and G.M. Bancroft, X-ray absorption spectroscopy and atomic force microscopy of films generated from organosulfur extreme-pressure (EP) oil additives, Tribol. Letters, 14-4 (2003) 225-235.
[5] S. Mori, K. Mori, Y. Tamai, "Mechanochemical reaction of extreme pressure additives with mild steel", J. JSLE Int. 4 (1983) 73-76.
[6] S. Mori, Y. Imaizumi, "Adsorption of model compounds of lubricant on nascent surfaces of mild and stainless steels under dynamic conditions", Tribol. Trans. 31-4 (1998) 449-453.
[7] S. Mori, "Tribochemical activity of nascent metal surfaces", Proceedings of
International Tribology Conference, Yokohama (1995).
[8] G. Fromentin, A. Bierla, C. Minfray and G. Poulachon, “An experimental study on the effects of lubrication in form tapping”, Tribology International, 43-9 (2010) 1726-1734.
[9] A. Bierla, G. Fromentin, J.M. Martin, T. Le Mogne, N. Genet, "Tribological
aspect of lubrication in form tapping of high-strength steel", Lubr. Sci. 20-4 (2008)
269-281.
[10] ISO 3002-4 Standard: Basic quantities in cutting and grinding - Part 4: forces, energy, power.
[11] ISO 3002-3 Standard: Basic quantities in cutting and grinding - Part 3: geometric and kinematic quantities in cutting.
[12] ISO 8688-2 Standard: Tool life testing in milling - Part 2: End milling.
[13] T.H.C. Childs, “Friction modelling in metal cutting”, Wear 260-3 (2006) 310-318.
[14] M.E. Merchant, Mechanics of the metal cutting process, J. Appl. Phys. 16 (1945) 318–324.
[15] B.A. Baldwin, "Relationship between surface composition and wear: an X-ray photoelectron spectroscopic study of surfaces tested with organosulfur compounds", ASLE Trans. 19-4 (1975) 335-344.
[16] D.R. Wheeler, "X-ray photoelectron spectroscopic study of surface chemistry of dibenzyl disulfide on steel under mild and severe wear conditions", Wear 47-2 (1978) 243-254.
[17] M.N. Najman, M. Kasrai, G.M. Bancroft, "X-ray absorption spectroscopy and atomic force microscopy of films generated from organosulfur extreme-pressure (EP) oil additives", Tribol. Lett. 14-4 (2003) 225-235.
[18] A.Bierla, "Usinage des aciers prétraités à l’huile entière de coupe - effets
physico-chimiques des additifs soufrés", PhD Thesis Arts et Metiers ParisTech 2009-22
(2009)
[19] A.R. Pratt, I.J. Muir, H.W. Nesbitt, "X-ray photoelectron and Auger electron spectroscopic studies of pyrrhotite and mechanism of air oxidation", Geochimica et Cosmochimica Acta 1994, 58-2 (1994) 827-841
[20] H. Wang, B. Xu, J. Liu, D. Zhang., "Investigationon friction and wear
behaviors of FeS films on L6 steel surface", Appl. Surf. Sci., 252-4 (2005) 1084-1091. [21] J. Tannous, M.I. De Barros Bouchet, T. Le Mogne, J.M. Martin and P.
Charles,Experimental modelisation of organosulfurs tribochemistry by gas phase
lubrication, Procceding of the ASME/STLE International Joint Tribology Conference, 22-24 oct. 2007, (2008) 71-73.
Fluid designation Lubricant viscosity (at 40°C)
Composition and nature of fluids
(R1, R2, R3, and R4 are alkyl group)
PBO 20 mm2/s Chemically non-active paraffinic base oil
F1 20 mm2/s Chemically non-active paraffinic base oil
+ S1 (pentasulfide) at 1% wt of S
F2 22 mm2/s Chemically non-active paraffinic base oil
+ S2 (sulfurized and esterified fatty acids) at 1% wt of S
F3 20 mm2/s Chemically non-active paraffinic base oil
+ S3 (methylene bis(dibutyl-dithiocarbamate)) at 1% wt of S
S2p3/2 sulfur spectra
Chip cut with F1 Chip cut with F2 Chip cut with F3
BE (eV) FWH
M (eV)
S %
at. at. % (eV) BE FWHM
(eV) S % at . % at. (eV) BE HM FW eV) S % at. % at. FeS 161.11 1.39 8 5 160.91 1.36 6 2 161.26 2.02 1 * FeS2 162.38 * 162.12 * S adsorbed 163.23 1 163.31 2 163.42 * Sulfites 167.27 1 165.69 1 Sulphates 168.19 1 168.17 1 168.31 1
Table 2: Chemical nature, binding energy (BE), FWHM, total quantity of sulfur (S % at.) compared to other elements detected on the chip surfaces obtained with the three tested blends and detailed atomic percentages of the various sulfur species identified (% at.) (*traces).
Figures list:
Fig. 1: Comparison of milling versus external turning
Fig. 2: Comparison of cutting parameter effects on specific cutting energy in dry conditions and with F2 fluid
Fig. 3: Effect of tested fluids on specific cutting energy
Fig. 4: Evolution of mill flank wear as a function of cutting time
Fig. 5: Effect of fluids on mill flank wear after 20 minutes of machining
Fig. 6: A) AES depth-profiles and B) XPS sulfur spectra (S2p3/2) obtained on the chip
surfaces while milling with: 1) F1, 2) F2 and 3) F3
Fig 7: a) TEM image of a FIB cross section of a chip (side in contact with the rake face of the tool) obtained with F1 fluid b) EDS analyses of this tribofilm
Fig. 1: Comparison of milling versus external turning rd o c f V M z Milling: concave contact on flank face
External turning: convex contact on flank
face Mill
Tool workpiece
0 10 20 30 40 50 60 60 / 0.1 60 / 0.2 60 / 0.3 120 / 0.1 120 / 0.2 120 / 0.3 180 / 0.1 180 / 0.2 180 / 0.3 kc (W /cm 3/mi n ) Vc(m/min) / fz(mm/rev/th) Dry F2
Cutting conditions: dry and F2
Vc = 60, 120, 180 m/min, fz= 0.1, 0.2, 0.3 mm/rev/th, rdoc= 2 mm, adoc = 2 mm Vceffect fzeffect F2 effect -18% -24%
Fig. 2: Comparison of cutting parameter effects on specific cutting energy in dry conditions and with F2 fluid
0 10 20 30 40 50 60 Dry PBO F1 F2 F3 kc (W /cm 3/mi n )
Cutting conditions: dry and with fluids
Vc = 60 m/min, fz= 0.2 mm/rev/th, rdoc= 2 mm, adoc = 2 mm F2
effect F1
effect
-15% -8%
0 0.02 0.04 0.06 0.08 0.1 0.12 0.14 0.16 0.18 5 10 15 20 25 Vb (mm)
cutting time (min)
DRY F1 F1 effect -41% Flank wear 15 min Flank wear 10 min Flank wear 20 min Vb
0,00 0,05 0,10 0,15 0,20 0,25 DRY PBO F1 F2 F3 Vb (mm ) at 20 mi n
Cutting conditions: dry and with fluids
Vc = 120 m/min, fz= 0.05 mm/rev/th, rdoc= 2 mm, adoc = 2 mm
F1 effect
-41%
F2 effect -6%
Fig. 6: AES depth-profiles (A) and XPS sulfur spectra (S2p3/2) (B) obtained on the chip
surfaces while milling with: 1) F1, 2) F2 and 3) F3 fluid
159 160 161 162 163 164 165 166 167 168 169 170 171 172
Binding Energy (eV) S2p3 A S2p3 B S2p3 C S2p3 E S2p3 D FeS sulphates FeS2 S adsorbed sulfites 159 160 161 162 163 164 165 166 167 168 169 170 171 172
Binding Energy (eV) S2p3 A S2p3 B S2p3 C S2p3 E S2p3 D 159 160 161 162 163 164 165 166 167 168 169 170 171 172
Binding Energy (eV) S2p3 A S2p3 B S2p3 C S2p3 E S2p3 D FeS sulphates FeS2 S adsorbed sulfites 0 30 60 90 150 210 270 350 440 530 650 830 1010 1190 1550 1910 2270 2790 3390 3990 Etching time (s) Peak h igh (ar bitrar y un it) S LMM Fe LMM O KLL C KLL 0 30 60 90 150 210 270 350 441 531 651 831 1011 1191 1551 Etching time (s) Peak h igh (ar bitrar y un it) S LMM Fe LMM O KLL C KLL 0 30 60 90 150 210 270 350 440 530 650 830 1010 1190 1551 1911 2271 Etching time (s) Peak h igh (ar bitrar y un it) S LMM Fe LMM O KLL C KLL 156 157 158 159 160 161 162 163 164 165 166 167 168 169 170 171 172 173
Binding Energy (eV) S2p3 A S2p3 B S2p3 C S2p3 D S2p3 E FeS sulphates FeS2 S adsorbed sulfites 156 157 158 159 160 161 162 163 164 165 166 167 168 169 170 171 172 173
Binding Energy (eV) S2p3 A S2p3 B S2p3 C S2p3 D S2p3 E 156 157 158 159 160 161 162 163 164 165 166 167 168 169 170 171 172 173
Binding Energy (eV) S2p3 A S2p3 B S2p3 C S2p3 D S2p3 E FeS sulphates FeS2 S adsorbed sulfites 157 158 159 160 161 162 163 164 165 166 167 168 169 170 171 172 173 174 175
Binding Energy (eV) S2p3 A S2p3 C S2p3 E FeS sulphates S adsorbed 157 158 159 160 161 162 163 164 165 166 167 168 169 170 171 172 173 174 175
Binding Energy (eV) S2p3 A S2p3 C S2p3 E 157 158 159 160 161 162 163 164 165 166 167 168 169 170 171 172 173 174 175
Binding Energy (eV) S2p3 A S2p3 C S2p3 E FeS sulphates S adsorbed A3 A2 A1 B1 B2 B3
Fig. 7: a) TEM image of a FIB cross section of a chip (side in contact with the rake face of the tool) obtained with F1 fluid b) EDS analyses of this tribofilm.