HAL Id: hal-00397198
https://hal-mines-paristech.archives-ouvertes.fr/hal-00397198
Submitted on 19 Jun 2009HAL is a multi-disciplinary open access archive for the deposit and dissemination of sci-entific research documents, whether they are pub-lished or not. The documents may come from teaching and research institutions in France or abroad, or from public or private research centers.
L’archive ouverte pluridisciplinaire HAL, est destinée au dépôt et à la diffusion de documents scientifiques de niveau recherche, publiés ou non, émanant des établissements d’enseignement et de recherche français ou étrangers, des laboratoires publics ou privés.
The Clean Development Mechanism and the
International Diffusion of Technologies: An Empirical
Study
Antoine Dechezleprêtre, Matthieu Glachant, Yann Ménière
To cite this version:
Antoine Dechezleprêtre, Matthieu Glachant, Yann Ménière. The Clean Development Mechanism and the International Diffusion of Technologies: An Empirical Study. Energy Policy, Elsevier, 2008, 36 (4), pp.1273-1283. �10.1016/j.enpol.2007.12.009�. �hal-00397198�
This paper can be downloaded without charge at: The Fondazione Eni Enrico Mattei Note di Lavoro Series Index: http://www.feem.it/Feem/Pub/Publications/WPapers/default.htm
Social Science Research Network Electronic Paper Collection: http://ssrn.com/abstract=1077151
The opinions expressed in this paper do not necessarily reflect the position of
Fondazione Eni Enrico Mattei
The Clean Development Mechanism
and the International Diffusion of
Technologies: An Empirical Study
Antoine Dechezleprêtre, Matthieu Glachant
and Yann Ménière
NOTA DI LAVORO 105.2007
DECEMBER 2007
CCMP – Climate Change Modelling and Policy
Antoine Dechezleprêtre, Matthieu Glachant and Yann Ménière, CERNA, École Nationale
The Clean Development Mechanism and the International Diffusion of
Technologies: An Empirical Study
Summary
The Clean Development Mechanism (CDM) is expected to stimulate the North-South
transfer of climate-friendly technologies. This paper provides an assessment of the
technology transfers that take place through the CDM using a unique data set of 644
registered projects. It provides a detailed description of the transfers (frequency, type,
by sector, by host country, etc.). It also includes an econometric analysis of their
drivers. We show that transfer likeliness increases with the size of the projects. The
transfer probability is 50% higher in projects implemented in a subsidiary of Annex 1
companies while the presence of an official credit buyer has a lower – albeit positive –
impact. The analysis also yields interesting results on how technological capabilities of
the host country influence technology diffusion in the CDM.
Keywords: Kyoto Protocol, Clean Development Mechanism, International Technology
Transfer
JEL Classification: Q5, Q55
Address for correspondence:
Matthieu Glachant
CERNA École des mines de Paris
60, Boulevard Saint Michel
75272 Paris Cedex 06
France
Phone: +33140 51 92 29
Fax: +33140 51 91 45
E-mail: glachant@ensmp.fr
1. Introduction
The Clean Development Mechanism (CDM) is one of the most innovative tools of the Kyoto Protocol. It allows industrialized countries which have accepted emissions reduction targets to develop or finance projects that reduce greenhouse gas (GHG) emissions in non-Annex 1 countries1 in exchange for emission reduction credits. Since reducing GHG emissions in a less-developed country may be cheaper than doing so domestically, it helps Annex 1 countries to achieve their emission reduction target at a lower cost and it contributes to the sustainable development of the host countries (see Ellis et al., 2007, for an up-to-date discussion on the CDM).
While its primary goal is to save abatement costs, the CDM is also considered by many as a key means to boost technology transfer and diffusion. If the technology used in the project is not available in the host country but must be imported, the project leads, de facto, to a technology transfer. This technology may consist of “hardware” elements, such as machinery and equipment involved in the production process, and/or “software” elements, including knowledge, skills, and know-how (OECD, 2005). Note that the CDM did not originally have an explicit technology transfer requirement in the Kyoto Protocol. This was included later in the 2001 Marrakech Accords.
Expecting international technology transfer through CDM projects sounds reasonable. However whether this is true in practice is an empirical question. In this paper, we use a unique dataset describing the 644 CDM projects registered up to May 1st, 2007 in order to explore this issue. More precisely, we address two types of questions. The first are descriptive. How often do CDM projects
1 Non-Annex 1 countries have also ratified the Kyoto Protocol but do not have any emissions reduction targets.
This group has 148 members and is mainly comprised of developing countries. Large GHG emitters such as China, India, Brazil and Mexico belong to this group.
include a transfer of technology from abroad? In which sectors? Which types of technologies are transferred? Which countries are the main recipients? Who are the technology suppliers?
The second set of questions is more analytical. Using regression analysis, we investigate what drives technology transfer in the CDM. This provides insights into a range of questions. Do the host country’s technological capabilities influence technology transfer? Does the presence of an official credit buyer in the project’s partnership promote transfer? Is a transfer more likely in projects implemented in subsidiaries of companies based in industrialised countries?
The transfer of environmentally sound technologies in the context of climate change mitigation is the subject of an extensive literature (see for example Worrell et al., 2001; Yang and Nordhaus, 2006). In contrast, only two papers deal with technology transfer through CDM projects using a quantitative approach. Based on a limited sample of 63 registered projects, De Coninck et al. (2007) show that imported technologies originate mostly from the European Union and that the investments from industrialized countries associated with the CDM are small when compared to total foreign direct investments. Haites et al. (2006) work on a larger database involving 860 projects. They find that technology transfers occur in one third of the projects, accounting for two thirds of the annual emission reductions. Larger projects and those with foreign participants tend to induce technology transfer. We depart from these papers in two respects. First, our data set provides a richer description of the countries hosting the CDM projects and of the countries supplying the technologies. It also describes in greater detail the participants involved in the projects. Second — and this is related to the previous point — a richer set of independent variables allows to run regressions that explain the technology transfer2. This gives insights into the design variables of the CDM that promote technological transfer, thereby leading to potentially useful policy lessons. More generally, it helps deepen our understanding of the transfer of GHG mitigation technologies, which could be useful in the current debate
surrounding post-Kyoto talks.
The article is organized as follows. In section 2, we describe the data set. Section 3 includes the descriptive results regarding technology transfers. The econometric analysis is carried out in Sections 4 and 5. We investigate what drives not only the transfer but also the type of transfer (equipment or knowledge). Section 6 concludes.
2. Data issues
2.1 Sources
In this section, we describe how we construct the data set. CDM projects that result in real, measurable and long-term climate mitigation benefits in non-Annex 1 countries are registered by the Executive Board of the UNFCCC. Our data describes all the 644 projects registered as of May 1st,
2007. These projects account for an expected 888.5 million tons of CO2-equivalent (MtCO2eq)
emissions reductions by the end of 2012.
We use three main information sources to describe these projects: 1) the UNEP Risoe Center CDM Pipeline database3, 2) the so-called Project Design Documents, and 3) data from international institutions such as the World Bank and the World Trade Organization for country-level economic and technological variables.
For every CDM project, the UNEP Risoe Center CDM Pipeline database includes the host country, the type of technology, the estimated amount of the annual emissions reductions, the cumulative emissions reductions to the end of the Kyoto period (31 December 2012) and the countries that will buy the carbon credits generated by the project (if already available). We have also collected the registration dates of each project and the name of every country involved, on the UNFCCC website dedicated to CDM projects4.
The content of the Project Design Documents (PDD) is our main source of information. They are mandatory standardized documents of about 50 pages submitted to the Executive Board by the project developers for registration. In the PDDs, we have collected information about the technology used, whether there is a transfer or not, the type of transfer, the project implementer (name, business sector and name of parent company) and every foreign partner involved (name, location). We have also retrieved information on the role of the project partners: are they credit buyers, consulting companies, PDD consultants or equipment suppliers?
Host country characteristics, including information on GDP, trade or FDI flows have been obtained from the World Bank’s World Development Indicators 20065. We have completed this information with
2 The paper by Haites et al. (2006) also includes a regression. But its explanatory power is weak as independent
variables are essentially country and sector dummies.
3 The database is available at http://cdmpipeline.org/ 4http://cdm.unfccc.int/Projects/index.html
economic performance indicators from the Earth Trends database of the World Resource Institute6. To proxy the technological capability of a country to import and use advanced technology, we have used the composite index Arco developed by Archibugi and Coco (2004).
2.2 Information on technology transfers
Given our questions, it is worth describing carefully how we encode information on technological transfers. To begin with, we define technology transfer as the import of a technology from abroad. We consider two forms of technology transfer. The first, which we call a knowledge transfer, takes place if the local project developer benefits from the transfer of knowledge, know-how, information or technical assistance from a foreign partner. The second form is an equipment transfer. It consists in importing equipment, such as wind turbines or gas burners, from a supplier located in a foreign country. Of course, a project can involve both a transfer of equipment and a transfer of knowledge. We get this information from the PDDs. In these documents, the technology to be employed in the project activity is described in section A.4.3. The Guidelines for completing the PDD available from UNFCCC indicate that ”this section should include a description of how environmentally safe and sound technology, and know-how to be used, is transferred to the host Party(ies).” But this is not a compulsory requirement, and no section is specifically devoted to technology transfer. Indeed, claims of technology transfer can often be found in other[s] sections such as “Description of the project activity” (A.2) or “Barrier analysis” (B.4). Section G (“Stakeholders' comments”) sometimes contains interesting information on equipment suppliers. Further information on the technology employed may also be displayed in the annex. In order to get relevant information, we have read carefully all the PDDs.7
In order to illustrate how we have proceeded in practice, consider two examples. Project #247 involves a knowledge transfer. It consists in replacing fossil fuel with biomass in the production of cement at Lafarge Malayan Cement Company in Malaysia. The technology to process and use local biomass has been developed by Lafarge Malayan Cement’s parent company, Blue Circle Industries. Their research centre is based in Europe. The PDD makes it clear that “knowledge and expertise have been actively transferred in the development of the project by European expert deployment in Malaysia.”
6http://earthtrends.wri.org/
7 For efficiency purposes, we first searched the PDDs for the words “technology”, “transfer”, “equipment”,
“supplier”, “import”, “manufacturer” and “training”. If no information on technology transfer could be found through this search, we then read through the entire PDD.
Training of local staff and engineers has been provided by experts from Blue Circle as well as from Lafarge Europe (Blue Circle’s parent company).
Project #839 is an example of equipment transfer. It aims at generating electricity from biogas at a landfill in Talia, Israel. The PDD informs us that “the high temperature flare, blower, gas analyzer, industrial computer are all imported from Europe” but does not give any further information on the equipment supplier’s involvement beyond the sale. Technology suppliers certainly transfer some knowledge, at least in the form of an instructions leaflet. Hence an equipment transfer should be seen as a transfer of technology that comes with the minimum possible transfer of knowledge.
How reliable is this information? There are several potential problems which we have tried to mitigate. In some PDDs, a transfer of technology may refer to the simple adoption of a new technology. If the technology provider is clearly located within the country, the project involves no international transfer; consequently our database records no international transfer for that project in that country.
Another difficulty concerns specifically the import of equipment. From a general point of view, the import of goods does not always entail a technology transfer. For instance, importing a DVD player made in China and imported into the U.S. does not. The same is true for CDM projects which might include the import of generic devices. In this regard, we have considered that the import of equipment is associated with a technology transfer whenever the PDD claims that it is.
It remains that PDD editors have an incentive to overstate the existence of technology transfer as it helps project registration. Accordingly, type I errors are unlikely while type II errors could be frequent even if any claim of technology transfer has been justified in the PDD8. Therefore, descriptive statistics regarding technology transfer percentages are probably less reliable than other figures.9 This is a usual difficulty with this type of study. But one can realistically assume that this bias is randomly distributed over the PDD-writing population. Therefore, this problem probably does not damage our econometric results.
8 A type I error consists of wrongly describing a project as not involving any technology transfer. Conversely, a
type II error occurs when a project is wrongly described as involving a technology transfer (when it does not).
9 Haites et al. (2006) find that 33% of the projects involve transfer, compared to 43% in our data set. One possible
3. Descriptive statistics regarding technology transfers
In this section we provide a detailed description of technology transfers occurring in CDM projects.
3.1 Frequency and nature of technology transfers
Table 1 shows that 279 projects out of 644 involve technology transfer. They represent 43% of projects and 84% of the expected annual CO2 emissions reductions. Projects with transfer are thus
larger-scale on average than those without. This discrepancy is partly explained by the fact that all 13 HFC-destruction projects, representing more than 59 million tons of annual CO2eq reductions, involve
technology transfer.
In Table 1, we see that transfers limited to the import of equipment are much less frequent than the transfer of knowledge alone (9% of the projects as opposed to 15%).
The transfer of both equipment and knowledge is observed in 19% of the projects. This illustrates the key role of technical skills in the diffusion of carbon mitigation technologies.
Table 1 – Nature of technology transfer involved in the CDM projects
Nature of technology transfer Number of projects % of projects % of annual emission reductions Average reduction per project (ktCO2eq/yr) Transfer 279 43 % 84 % 403 Equipment 57 9 % 6 % 133 Knowledge 101 15 % 14 % 185 Equipment + Knowledge 121 19 % 64 % 714 No transfer 365 57 % 16 % 59 Total 644 100% 100 % 208
3.2 Transfer by type of technology
Using the 21 technology categories established by the UNEP Risoe Center CDM pipeline, Table 2 shows that the number of projects and the likelihood of transfer vary greatly across types of technology.
Table 2 – Technology transfer by type of technology
Type of technology Number of projects
Percentage of projects involving technology transfer Share of transfers that include equipment Average project size (annual ktCO2eq) Biomass energy 141 19% 81% 56 Hydro power 112 22% 68% 50
Biogas recovery in agriculture
(breeding farms) 104 70% 10% 43
Wind power 80 63% 96% 84
Energy efficiency measures in
industry 65 25% 75% 112
Landfill gas recovery 51 80% 80% 279
Fossil fuel switch 14 43% 100% 34
Biogas recovery (other) 14 29% 75% 45
Reduction of the share of
clinker in cement production 14 7% 0% 144
HFC decomposition 13 100% 92% 4612
Energy efficiency / supply side 7 14% 0% 33
N2O destruction 6 100% 83% 3141
Geothermal power 5 40% 50% 293
Solar power 4 100% 100% 11
Recovery of fugitive gas 3 100% 33% 621
Power generation from coal
mine methane 3 67% 100% 462
Energy efficiency measures in
households (insulation) 3 67% 100% 14
Energy efficiency measures in
the services sector 2 100% 100% 8
Tidal power 1 100% 100% 315
Reforestation 1 0% – 26
Transport 1 0% – 247
All projects aiming at the destruction of HFC-23 entail a transfer. HFC-23 is a by-product of HCFC-22, a widely used ozone-friendly refrigerant. The global warming potential of HFC-23 gas is 12,000 times higher than that of carbon dioxide (IPCC, 2001). Projects mitigating HFC thus generate very large amounts of CERs and are extremely profitable. A few companies located in Europe and in Japan have
developed technologies to destroy HFC. They are key partners in any HFC decomposition CDM project. Projects avoiding the emission of nitrous oxide (N2O) in the chemicals industry and recovering
methane (CH4) in landfills and farms also exhibit a very high transfer rate.
In the energy sector, equipment for solar and wind power generation are usually imported from Annex 1 countries. More precisely, about 60% of wind power projects import turbines which are of higher capacity than locally produced ones. This is not surprising as local companies like Goldwind in China and Suzlon in India only produce small-capacity turbines. This explains why projects using imported turbines have an average total capacity of 53 MW in comparison with 28 MW for projects using local devices.
A large share of projects recovering biogas in breeding farms also involves technology transfer. The purpose of this type of project is to mitigate and recover biogas resulting from the decomposition process of animal effluents. Each project includes the installation of covered lagoons and a combustion system that destroys the captured biogas. Although the technologies are not very elaborate, knowledge transfer is frequent because these projects are mainly initiated by developers located in Annex 1 countries like AgCert. This Irish company provides farmers with turnkey solutions, including training sessions on how to operate the technology. The offered service includes
specification and design of the complete technology solution, identification of appropriate technology providers, supervision of the project installation, farm staff training and ongoing monitoring.
Conversely, technology transfers are limited in certain areas. Power generation using hydro power or biomass is an example. Biomass power plants are similar to fossil-fuel fired power plants and use a very common technology. So do hydro power plants: most projects are located in Brazil, India and China, which have been mastering hydro power technology for decades.
Table 3 gives an aggregate view of these results by sector. Excepting the chemicals sector with HFC and N2O destruction projects, the industrial sector surprisingly does not yield many technology
Table 3 – Technology transfer by sector
Sector Number of projects Percentage of projects involving technology transfer
% of equipment transfer in projects with transfer
Waste 51 80% 80%
Agriculture (incl. reforestation) 105 70% 10%
Energy 264 39% 87%
Industry 223 27% 79%
Transport 1 0% !
3.3 Transfer by mitigation mechanism
Table 4 distinguishes different mitigation mechanisms. Transfers largely concern end-of-pipe technologies that remove gaseous pollutants from effluent streams at the end of the production process. The “new units” category describes the setting up of new production units with reduced GHG emissions. It gathers biomass-fired and hydro power plants that essentially use local technology as well as wind farms that often benefit from technology transfer. In contrast, projects that modify existing production processes involve far less transfers. Input switch refers to projects involving a change of production inputs (e.g., biomass instead of coal in a power plant).
Table 4 – Technology transfer by mitigation mechanism
Mechanism Number of projects % of technology transfer
End-of-pipe 205 69%
New unit 286 36%
Input switch 39 33%
Change in the production process 111 20%
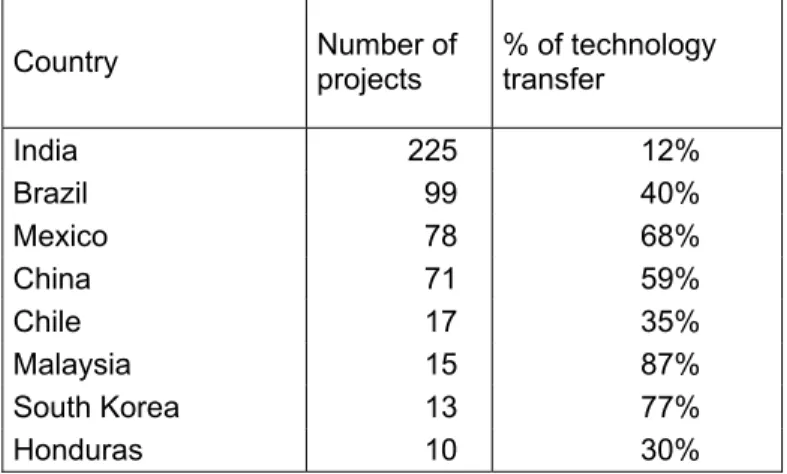
3.4 Technology transfer by host country
While CDM projects are located in 44 non-Annex 1 countries, 73% of them are located in Brazil, China, India and Mexico, with 35 % in India alone. 24 countries host 3 projects or less and among these, 12 countries host only one.
Table 5 shows technology transfers in the main host countries. They appear very heterogeneous in their capability to attract technology transfers.
Table 5 – Technology transfer for selected host countries
Country Number of projects % of technology transfer
India 225 12% Brazil 99 40% Mexico 78 68% China 71 59% Chile 17 35% Malaysia 15 87% South Korea 13 77% Honduras 10 30% 3.5 Technology suppliers
In 71% of the 154 projects that explicitly mention the origin of imported equipment, it comes from European suppliers. Within Europe, the main exporting countries are Germany, Spain and Denmark, which accounted for 45% of the exported machinery. Non-European suppliers are mostly located in the USA (19%) and Japan (10%).
This means that the money spent by Annex 1 countries to finance CDM projects – through the purchase of carbon credits – is only marginally used to buy machinery from countries that have not ratified the Kyoto Protocol. Does it mean that each country subsidizes its own technologies through the Clean Development Mechanism? This argument has been widely used by CDM opponents. But a closer look at our data invalidates this assertion: an Annex 1 country hosts both the credit buyer and the equipment supplier in only 2% of the projects.
Table 6 reports the main countries of origin and of destination by technology. Spain mainly exports wind turbines manufactured by Gamesa Eolica. Other wind turbine exporters include Vestas in Denmark and Enercon in Germany. The French company Vichem is the main technology provider for HFC decomposition projects. Technologies for N2O destruction are provided by Japanese companies
Table 6 – Main countries of origin and of destination by type of technology
Type of technology Main countries of origin Main countries of destination Biomass energy Belgium, Denmark, Japan Malaysia, India, Brazil, Indonesia Wind power Denmark, Germany, Spain, USA China, India, Brazil, Mexico Landfill gas Italy, UK, France, USA, Ireland, Netherlands Brazil, Mexico, Argentina, Chile, China HFC decomposition France, Germany, Japan China, India
Hydro power France, Germany, UK, Spain Ecuador, Panama, Honduras, South Korea, Mongolia Agriculture Ireland, Canada, UK Mexico, Brazil, Philippines, Ecuador Energy efficiency in industry Japan, Italy, USA India, China, Malaysia N2O destruction Germany, Japan, France South Korea
3.6 Partnerships
Initially, it was thought that CDM projects could be initiated by companies from Annex 1 countries to cut emissions at a lower cost through technological partnerships that would also benefit developing countries. An example in line with these expectations is Project # 526. The Heidelberg group — a German cement company — has developed this project to cut carbon emissions in its Indonesian subsidiary, Indocement. The project aims at producing a new type of blended cement which reduces CO2 emissions. It has benefited from research and development activities conducted in Europe by
Heidelberg Cement.
However, if we look at the data, a limited number of projects follow a similar pattern. Only 8% are implemented in subsidiaries of companies located in Annex 1 countries. Among these projects, only 21 parent companies offered technical assistance to their local subsidiary. This means that, in total, less than 5% of all CDM projects involve a transfer from an Annex 1 country company to its subsidiary. Instead, the CDM business has generated unexpected forms of technological partnership. Companies such as AgCert, EcoSecurities, Carbon Resource Management, Agrinergy or Carbon Asset Services Sweden are now key players in the production and sale of carbon credits. We refer to these
companies as CDM project designers. They manage the whole CDM project cycle, from PDD writing to credit sale. Their diversified portfolio of CDM projects allows risk minimization and exploitation of economies of scale in administrative tasks. Some of them directly transfer the technology to local project developers. For example, AgCert transfers know-how in Animal Waste Management Systems
to livestock farms in Brazil and Mexico. Others simply help local firms with finding technology suppliers and assessing their technologies.
As shown by Table 7, nearly 50% of the credit buyers are CDM project designers. Carbon traders — either banks like ABN AMRO or companies involved in commodity trading like Nuon Energy or EDF Trading — are not very active on the primary market, although the Noble group has created a dedicated subsidiary, Noble Carbon Credits. Private companies also frequently buy credits.
Table 7 – Types of credit buyer
Type of credit purchaser Number of projects (percentage)
CDM project designer 179 (47%)
Carbon trader (mostly banks) 18 (4.7%)
Private company 96 (25.1%)
Private fund 5 (1.3%)
Government fund 45 (11.8%)
Public-private fund 9 (2.4%)
World Bank fund 29 (7.6%)
TOTAL 381 (100%)
Note: a project may have more than one credit buyer involved.
4. The determinants of technology transfers: an econometric analysis
In the previous section, we have presented statistics describing technology transfers through the CDM. They give a detailed view on these issues but do not help us to understand what drives the transfer. For instance, we know from Table 5 that 69% of the Chinese projects involve a transfer while the percentage is only 12% in India. Why is this? Is it because the technological capability of India is less than that of China? Or is it due to sector composition effect, Indian projects may take place in economic sectors where a transfer is less likely? Is it due to project characteristics? For instance, is it because Chinese projects are implemented more frequently in subsidiaries of Annex 1 companies, assuming that this type of partnership increases the likeliness of transfer?
Understanding the rationale underlying the technology transfer through CDM projects is necessary to derive policy implications and, more generally, to give a clearer view of the diffusion of GHG mitigation technologies. In this section, we rely for this on econometric analysis.
4.1 The econometric model
Let TECH_TRANSFER denote a binary variable equal to 1 if a project involves a technology transfer (regardless of the nature of this transfer), and to 0 otherwise. To examine the relationship between
TECH_TRANSFER and a set of explanatory variables, the following logit equation is estimated:
Pr(
_
1)
1
e
TECH TRANSFER
e
! !" "
#
with: 0 1 2 3 4 5 6 7 8 9 10(
)
(
_
)
(
)
(
_
)
(
)
(
_
)
(
_
)
(
_
)
(
_
)
(
_
)
i i j jLOGSIZE
CREDIT BUYER
SUBSIDIARY
SIMILAR PROJECTS
TRADE
FDI INFLOWS
GDP GROWTH
TECH CAPACITY
LOG POPULATION
GDP PERCAPITA
SECTOR
COUNTRY
$ $
$
$
$
$
$
$
$
$
$
$
$
%
! "
#
#
#
#
#
#
#
#
#
#
#
#
#
!i is a vector of coefficients to be estimated and
%
is a random term identically independentlydistributed following a Gumbel extreme distribution.
We now discuss in depth the different explanatory variables. LOGSIZE10 is the log of the project size,
as measured by its annual emissions reduction. The underlying hypothesis is that CDM projects entail transaction costs that are fixed and that are likely to be higher when some technology transfer is involved (Maskus, 2004). Such transaction costs are an impediment to small projects. It may be assumed that the larger a project, the higher its probability to involve technology transfer.
CREDIT_BUYER is a dummy variable indicating the participation of one or more credit buyers in the project. Before the project developer can sell the credits, the UNFCCC must first certify, issue and register the emission reduction and this administrative process takes time. Selling credits through a forward contract can be of great help. It reduces the risk surrounding the investments by adding a guaranteed revenue stream. Most credit buyers are not pure financial actors as shown in Table 7.11 One can assume that they also give advice and bring expertise that may ease technology transfer. SUBSIDIARY is a dummy variable indicating whether the project is implemented in the subsidiary of a company located in an Annex 1 country. In this case, the local project developer can probably benefit from the expertise or from the technology of the parent company (Jahn et al., 2004).
The number of other CDM projects using the same technology within the host country is described by the variable SIMILAR_PROJECTS. We see this variable as a proxy for the local availability of the
10 Using the logarithm of the size ensures that the few very large HFC projects do not have a disproportionate
technology in the country. Accordingly, the higher the number of similar projects, the lower the probability of transfer.
We also include country variables. In this regard, there is empirical evidence in the general economic literature that international trade and Foreign Direct Investments (FDI) promote the transfer of
technology across countries (Coe et al., 1997). Accordingly, we use the variable TRADE, which is the sum of exports and imports of merchandise divided by GDP. FDI_INFLOWS is the level of incoming FDI divided, again, by the host country’s GDP.
As richer and larger countries are likely to have more technologies already available locally, we include the country size (LOG_POPULATION) and the per capita GDP (GDP_PERCAPITA) as control variables. In order to take into account the possible influence of economic dynamism, we also use GDP_GROWTH, the average annual rate of GDP growth 2000 to 2004.
Furthermore, empirical evidence indicates that the adoption of a new technology is strongly associated with human capital, supporting infrastructure and research and development activities (Blackman, 1997). In order to measure this technological capability (TECH_CAPABILITY), we use the ArCo technology index developed by Archibugi and Coco (2004). This composite indicator captures three aspects determining technological capabilities: the creation of technology (number of patents and number of scientific articles), the technological infrastructures (internet penetration, telephone penetration and electricity consumption) and the development of human skills (percentage of tertiary science and engineering enrolment, mean years of schooling and literacy rate).
TECH_CAPABILITY may have contrasting effects on technology transfers. On the one hand, the influence may be positive as the establishment of a new technology in a country may require technical competencies and a skilled workforce. On the other hand, high technological capabilities mean that many technologies are already available locally, thereby reducing the probability of transfers through CDM projects. These antagonistic effects may have different weights across sectors. This leads us to estimate two variants of the model:
& In Model A, we simply use the index TECH_CAPABILITY, thereby assuming that the effect of technological capability does not vary across sectors.
11 Only 18 credit buyers are banks.
& In Model B, the variable TECH_CAPABILITY interacts with 11 sector dummies allowing differentiated effects across sectors. We use AGRICULTURE, ENERGY, WASTE12 and 8 other dummies describing industrial sectors.
Finally, SECTORi and COUNTRYi are vectors of sector dummies and country dummies, respectively.
They control for sector- and country-specific characteristics that are not captured by the other variables.
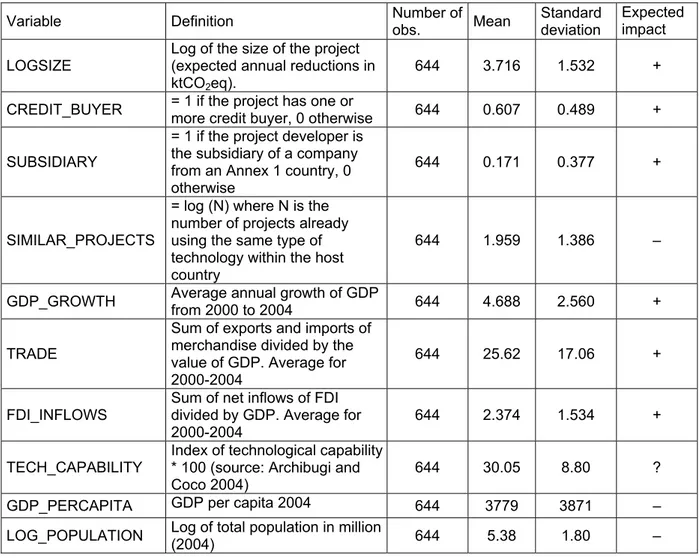
Table 8 yields precise definitions, summary statistics and the expected signs of the coefficients.
Table 8 – Definition of variables and summary statistics
Variable Definition Number of obs. Mean Standard deviation Expected impact LOGSIZE Log of the size of the project (expected annual reductions in
ktCO2eq).
644 3.716 1.532 +
CREDIT_BUYER = 1 if the project has one or more credit buyer, 0 otherwise 644 0.607 0.489 + SUBSIDIARY
= 1 if the project developer is the subsidiary of a company from an Annex 1 country, 0 otherwise
644 0.171 0.377 +
SIMILAR_PROJECTS
= log (N) where N is the number of projects already using the same type of technology within the host country
644 1.959 1.386 –
GDP_GROWTH Average annual growth of GDP from 2000 to 2004 644 4.688 2.560 + TRADE
Sum of exports and imports of merchandise divided by the value of GDP. Average for 2000-2004
644 25.62 17.06 +
FDI_INFLOWS Sum of net inflows of FDI divided by GDP. Average for
2000-2004 644 2.374 1.534 +
TECH_CAPABILITY Index of technological capability * 100 (source: Archibugi and Coco 2004)
644 30.05 8.80 ?
GDP_PERCAPITA GDP per capita 2004 644 3779 3871 –
LOG_POPULATION Log of total population in million (2004) 644 5.38 1.80 –
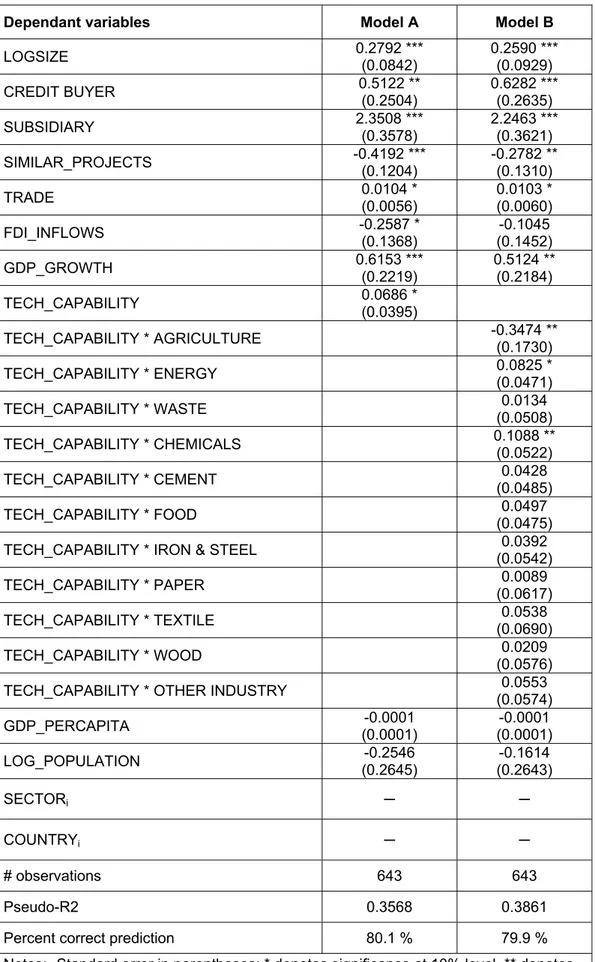
4.2 Results
Empirical results are displayed in Table 9. The overall quality of the estimations is reasonably good. The McFadden pseudo R-squared is around 0.35-0.4 depending on the model. The model correctly predicts 80 % of the observations and the results are robust across the two specifications (models A and B).
We now interpret the influence of the different variables. To begin with, technology transfer positively depends on the size of the project (LOGSIZE). This is in line with the expectation that larger projects are better able to exploit economies of scale in technology transfer.
Having a credit buyer also increases the likelihood that the project involves technology transfer. But calculations show that the marginal effect of CREDIT_BUYER is low: a project with a credit buyer has only a 16% higher probability of involving a technology transfer.
Being the subsidiary of a company from an Annex 1 country clearly favors the transfer of technology. The coefficient is highly significant in all specifications and much larger than that of CREDIT_BUYER. In marginal terms, the transfer likeliness of a project located in the subsidiary of an Annex 1 company is 50% higher. This confirms the conjecture that pre-existing capital links strongly promote the import of a new technology.
As expected, the probability of technology transfer decreases with the number of projects using the same type of technology in the country (SIMILAR_PROJECTS).
Turning next to country variables we confirm that, all other things being equal, the openness of the economy positively influences transfer probability. In contrast, the share of FDI inflows in GDP does not have any significant impact. This is not all that surprising, since capital links are already captured by the variable SUBSIDIARY.
Results regarding technological capabilities are very interesting. First, Model A tells us that
technological capability has a positive overall effect on technology transfer. However, introducing the possibility of differentiated effects across sectors (Model B) modifies this finding. In fact,
TECH_CAPABILITY has a positive influence only in the energy sector and in the chemicals industry. The effect is strongly negative in agriculture and not significant in most industry sectors and in waste management.
Recall the two antagonistic effects of technological capabilities. One the one hand, they promote transfer as local implementers have skills to use the technology. On the other hand, high technological
capabilities increase the local availability of technologies. Our results suggest that the latter effect dominates the former in agriculture, while the opposite is true in the energy sector and the chemicals industry. The interpretation is that technologies transferred in the agriculture sector are not very elaborate, implying that they might be introduced without high technical skills. In contrast with this, wind turbines, solar panels in the energy sector or abatement devices in the chemicals industry would require technically qualified manpower to be built and operated. In the other sectors in which
coefficients are not significant, the two effects might compensate each other.
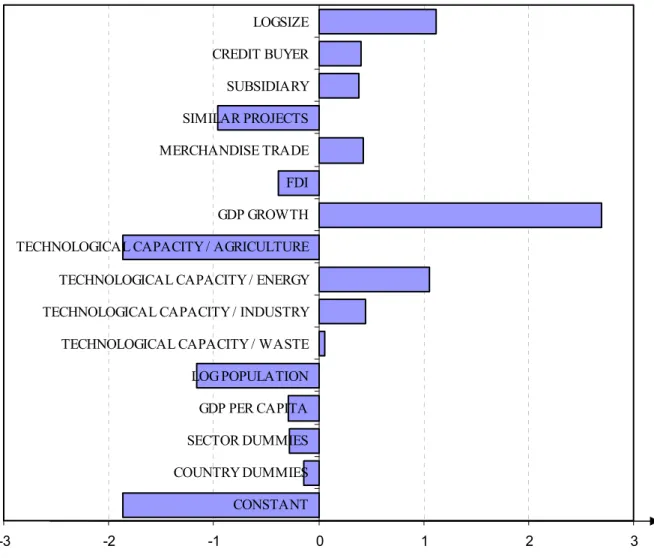
In order to compare the size of the effects of different explanatory variables, we draw Figure 1 using model B’s results. Using the same metric, each bar measures the impacts of the variable on an average CDM project.
Figure 1 is based on the following calculation. Let
x
i be the average value of the variablex
i in the data set and let'
i denote the value of its coefficient. Then, the product'
i ix
represents the average impact ofx
ion the linear predictor ". Calculating the value of'
i ix
for every variable allows setting the average weight of each variable against the decision to transfer technology. Figure 1 represents these weights.This representation shows that, among project variables, the size of the project and the number of similar projects within the host country have the most important impact on technology transfer. CREDIT_BUYER and SUBSIDIARY have similar effects but for different reasons. SUBSIDIARY increases the transfer probability by 50%, but only 8% of the projects are implemented in subsidiaries of Annex 1 companies. CREDIT_BUYER has a weaker marginal effect (+16%), but credit buyers participate in 61% of the projects.
At the country level, GDP growth exerts a stronger influence than economic openness. The
technological capability has a strong effect — either negative in agriculture or positive in the energy sector. We also find that the overall impact of project-level variables is smaller than that of country-level variables. This is a very significant finding because it suggests that the incentives to transfer technology given specifically by the CDM are low compared to usual economic and infrastructure-related incentives.
Table 9 – Regression results of models explaining TECH_TRANSFER
Dependant variables Model A Model B
LOGSIZE 0.2792 *** (0.0842) 0.2590 *** (0.0929) CREDIT BUYER 0.5122 ** (0.2504) 0.6282 *** (0.2635) SUBSIDIARY 2.3508 *** (0.3578) 2.2463 *** (0.3621) SIMILAR_PROJECTS -0.4192 *** (0.1204) -0.2782 ** (0.1310) TRADE 0.0104 * (0.0056) 0.0103 * (0.0060) FDI_INFLOWS -0.2587 * (0.1368) (0.1452) -0.1045 GDP_GROWTH 0.6153 *** (0.2219) 0.5124 ** (0.2184) TECH_CAPABILITY 0.0686 * (0.0395) TECH_CAPABILITY * AGRICULTURE -0.3474 ** (0.1730) TECH_CAPABILITY * ENERGY 0.0825 * (0.0471) TECH_CAPABILITY * WASTE (0.0508) 0.0134 TECH_CAPABILITY * CHEMICALS 0.1088 ** (0.0522) TECH_CAPABILITY * CEMENT (0.0485) 0.0428 TECH_CAPABILITY * FOOD (0.0475) 0.0497
TECH_CAPABILITY * IRON & STEEL (0.0542) 0.0392
TECH_CAPABILITY * PAPER (0.0617) 0.0089
TECH_CAPABILITY * TEXTILE (0.0690) 0.0538
TECH_CAPABILITY * WOOD (0.0576) 0.0209
TECH_CAPABILITY * OTHER INDUSTRY (0.0574) 0.0553 GDP_PERCAPITA (0.0001) -0.0001 (0.0001) -0.0001 LOG_POPULATION (0.2645) -0.2546 (0.2643) -0.1614 SECTORi ! ! COUNTRYi ! ! # observations 643 643 Pseudo-R2 0.3568 0.3861
Percent correct prediction 80.1 % 79.9 %
Notes: Standard error in parentheses; * denotes significance at 10% level, ** denotes significance at 5% level, and *** denotes significance at 1% level.
Fig. 1. Comparative impacts of the independent variables in a representative project -3 -2 -1 0 1 2 3 CONSTANT COUNTRY DUMMIES SECTOR DUMMIES GDP PER CAPITA LOG POPULATION TECHNOLOGICAL CAPACITY / WASTE TECHNOLOGICAL CAPACITY / INDUSTRY TECHNOLOGICAL CAPACITY / ENERGY TECHNOLOGICAL CAPACITY / AGRICULTURE GDP GROWTH FDI MERCHANDISE TRADE SIMILAR PROJECTS SUBSIDIARY CREDIT BUYER LOGSIZE
5. Explaining the type of transfer
In this section, we concentrate on the projects involving a technology transfer and we seek to identify what drives the type of transfer project developers engage in: the transfer of equipment or the transfer of knowledge.
Let HARD_TRANSFER denote the binary variable that indicates whether or not the technology transfer concerns equipment. A straightforward solution would be to estimate a standard logit model on the sample of projects involving transfers. But results would be biased because this sub-sample is not random. In technical terms, there is a so-called sub-sample selection bias. The reason is that
unobserved factors may influence both the probability of transfer – and thus the probability for a project to belong to the sub-sample – and the type of transfer.
A solution to this problem has been suggested by Heckman (1976). This is a two-step estimation procedure. In a first phase, the probability that a project leads to technology transfer is estimated. This is the sample selection equation: it allows us to set up a selection hazard index which is included as a regressor to estimate the type of transfer in the second phase (for more details on the Heckman model, see for instance Greene, 2003).
We have implemented the Heckman procedure: Table 10 reports the results of the second stage. In comparison with the previous models, we have excluded some dependent variables, either because there was no reason to assume they would influence the type of transfer (for example,
GDP_GROWTH) or because they were not significant.
Results show interesting patterns. First of all, the probability that the transfer concerns equipment decreases with the number of projects using the same type of technology in the country
(SIMILAR_PROJECTS). A developer who needs a technology has two options: either to buy it locally or to import it. In the economic literature, the first is termed horizontal diffusion and the second vertical
diffusion. Our results suggest that horizontal diffusion dominates when the technology is equipment.
As regards technological capabilities, Models C and D show that the pro-transfer effect dominates for equipment in the energy and waste management sectors. Agriculture is still specific, confirming that the equipment used in agricultural projects do not require significant technological skills.
Table 10 – Estimation results of the Heckman model’s for HARD_TRANSFER Dependant variables C D LOGSIZE (0.0638) 0.0132 (0.0667) 0.0021 SIMILAR_PROJECTS -0.3108 *** (0.0982) -0.2417** (0.1136) TRADE (0.0028) 0.0030 (0.0030) 0.0031 TECH_CAPABILITY 0.0227 ** (0.0114) TECH_CAPABILITY * AGRICULTURE -0.9387 * (0.5051) TECH_CAPABILITY * ENERGY 0.0427 ** (0.0197) TECH_CAPABILITY * INDUSTRY (0.0142) -0.0018 TECH_CAPABILITY * WASTE 0.0510 * (0.0283) SECTORi ! ! COUNTRYi ! ! Uncensored observations 279 279
Standard error in parentheses; * denotes significance at 10% level, ** denotes significance at 5% level, and *** denotes significance at 1% level.
6. Conclusion
This paper focuses on transfers of GHG mitigation technologies induced by the Clean Development Mechanism. We have examined technology transfers in the 644 CDM projects registered up to May 2007.
From a descriptive point of view, the data shows that technology transfers take place in more than 40% of CDM projects. Very few projects involve the transfer of equipment alone. Instead, projects often include the transfer of knowledge and operating skills, allowing project implementers to appropriate the technology.
Technology transfers mainly concern two areas. The first is end-of-pipe destruction of non-CO2
greenhouse gas with high global warming potentials, such as HFCs, CH4 and N2O. This concerns the
chemicals industry, the agricultural sector and the waste management sector. The second is wind power. Other projects, such as electricity production from biomass or energy efficiency measures in
the industry sector, mainly rely on local technologies. Moreover, Mexican and Chinese projects more frequently attract technology transfers while European countries are the main technology suppliers. We have also developed econometric models in order to characterize the factors underlying these patterns. They show that there are economies of scale in technology transfer: all other things being equal, transfers in large projects – in terms of emissions reductions – are more likely. Furthermore, the probability of transfer is 50% higher when the project is developed in a subsidiary of an Annex 1 company. Having an official credit buyer in the project also exerts a positive influence on transfer likeliness, albeit much smaller (+16%).
As regards the host countries’ features, the most interesting econometric findings involve technological capabilities. In theory, this factor has ambiguous effects. On the one hand, high capabilities may be necessary to adopt a new technology. On the other hand, high capabilities imply that many technologies are already available locally, thereby reducing transfer likelihood. Our estimations show that the first effect strongly dominates in the energy sector and in the chemicals industry. By contrast, the second effect is stronger for agricultural projects. This suggests that the agricultural technologies transferred in these projects tend to be simple.
What are the policy implications? First, these results suggest policy lessons for CDM design. Encouraging large projects – or project bundling – allows exploitation of increasing returns in technology transfer. Promoting projects in subsidiaries of Annex 1 companies could also be of great use to foster technology transfer. In practice, one could imagine different ways of providing incentives for companies to do so (e.g. additional credits, simplified administrative procedures). To a lesser extent, credit buyers, which are generally not pure financial actors, can also play a positive role. Our analysis may also give lessons regarding general measures. In particular, the study suggests that programs of technological capacity building would be particularly profitable in the energy sector and in the chemicals industry.
Last, let us pinpoint some limitations of this exercise. First, the data describes projects registered during a very short period (about 2 years). This prevents using this information to characterize the dynamic aspects of diffusion. Second, the data does not permit investigation of the diffusion of technology within host countries, which may be as significant as international transfers. Other
variables and country-specific variables, and the fact that information on technology transfer may be biased as it is self-reported by the project developers in the PDD.
References
Archibugi, D., Coco, A., 2004. A new indicator of technological capabilities for developed and developing countries (ArCo), World Development 32 (4), 629–654.
Blackman A., 1999. The Economics of technology diffusion: implications for climate policy in developing countries, Discussion Paper 99-42, Resources For the Future, Washington DC.
Coe, D.T., Helpman, E., Hoffmaister, A.W., 1997. North–South R&D spillovers, The Economic Journal 107 (440), 131–149.
De Coninck, H.C., Haake, F., van der Linden, N.H., 2007. Technology transfer in the Clean
Development Mechanism, ECN (Energy Research Center of the Netherlands) Working Paper, ECN-E--07-009.
Ellis, J., Winkler, H., Corfee-Morlot, J., Gagnon-Lebrun, F., 2007. CDM: taking stock and looking forward, Energy Policy 35 (1), 15–28.
Greene, W.H., 2003. Econometric Analysis, fifth ed. Upper Saddle River, NJ: Prentice Hall. Haites, E., Duan, M., Seres, S., 2006. Technology Transfer by CDM projects, Climate Policy, 6(3), 327–344.
Heckman, J.J., 1976. Sample selection bias as a specification error, Econometrica 47, 153–161. Intergovernmental Panel on Climate Change, 2001. Climate Change 2001: The Scientific Basis. Contribution of Working Group I to the Third Assessment Report of the Intergovernmental Panel on Climate Change, Cambridge University Press, Cambridge, United Kingdom and New York, NY, USA. Jahn, M., Michaelowa, A., Raubenheimer, S., Liptow, H., 2004. Measuring the Potential of Unilateral CDM - A Pilot Study, HWWA Discussion paper 263.
Maskus, K. E., 2004. Encouraging international technology transfer, UNCTAD/ICTSD Issue Paper, Geneva.
OECD, 2005. Achieving the successful transfer of environmentally sound technologies: trade-related aspects, COM/ENV/TD(2004)33/FINAL, Paris.
Worrell, E., van Berkel, R., Fengqi, Z., Menke, C., Schaeffer, R., Williams, R. O., 2001. Technology transfer of energy efficient technologies in industry: a review of trends and policy issues, Energy Policy 29 (1), 29–43.
Yang, Z., Nordhaus, W. D., 2006. Magnitude and direction of technological transfers for mitigating GHG emissions, Energy Economics 28 (5-6), 730-741.
NOTE DI LAVORO DELLA FONDAZIONE ENI ENRICO MATTEI Fondazione Eni Enrico Mattei Working Paper Series
Our Note di Lavoro are available on the Internet at the following addresses: http://www.feem.it/Feem/Pub/Publications/WPapers/default.htm
http://www.ssrn.com/link/feem.html http://www.repec.org http://agecon.lib.umn.edu http://www.bepress.com/feem/
NOTE DI LAVORO PUBLISHED IN 2007
NRM 1.2007 Rinaldo Brau, Alessandro Lanza, and Francesco Pigliaru: How Fast are Small Tourism Countries Growing?
The 1980-2003 Evidence
PRCG 2.2007 C.V. Fiorio, M. Florio, S. Salini and P. Ferrari: Consumers’ Attitudes on Services of General Interest in the EU:
Accessibility, Price and Quality 2000-2004
PRCG 3.2007 Cesare Dosi and Michele Moretto: Concession Bidding Rules and Investment Time Flexibility
IEM 4.2007 Chiara Longo, Matteo Manera, Anil Markandya and Elisa Scarpa: Evaluating the Empirical Performance of
Alternative Econometric Models for Oil Price Forecasting
PRCG 5.2007 Bernardo Bortolotti, William Megginson and Scott B. Smart: The Rise of Accelerated Seasoned Equity
Underwritings
CCMP 6.2007 Valentina Bosetti and Massimo Tavoni: Uncertain R&D, Backstop Technology and GHGs Stabilization
CCMP 7.2007 Robert Küster, Ingo Ellersdorfer, Ulrich Fahl (lxxxi): A CGE-Analysis of Energy Policies Considering Labor
Market Imperfections and Technology Specifications
CCMP 8.2007 Mònica Serrano (lxxxi): The Production and Consumption Accounting Principles as a Guideline for Designing
Environmental Tax Policy
CCMP 9.2007 Erwin L. Corong (lxxxi): Economic and Poverty Impacts of a Voluntary Carbon Reduction for a Small
Liberalized Developing Economy: The Case of the Philippines
CCMP 10.2007 Valentina Bosetti, Emanuele Massetti, and Massimo Tavoni: The WITCH Model. Structure, Baseline, Solutions
SIEV 11.2007 Margherita Turvani, Aline Chiabai, Anna Alberini and Stefania Tonin: Public Policies for Contaminated Site
Cleanup: The Opinions of the Italian Public
CCMP 12.2007 M. Berrittella, A. Certa, M. Enea and P. Zito: An Analytic Hierarchy Process for The Evaluation of Transport
Policies to Reduce Climate Change Impacts
NRM 13.2007 Francesco Bosello, Barbara Buchner, Jacopo Crimi, Carlo Giupponi and Andrea Povellato: The Kyoto
Protocol and the Effect of Existing and Planned Measures in the Agricultural and Forestry Sector in the EU25 NRM 14.2007 Francesco Bosello, Carlo Giupponi and Andrea Povellato: A Review of Recent Studies on Cost Effectiveness of
GHG Mitigation Measures in the European Agro-Forestry Sector
CCMP 15.2007 Massimo Tavoni, Brent Sohngen, and Valentina Bosetti: Forestry and the Carbon Market Response to Stabilize
Climate
ETA 16.2007 Erik Ansink and Arjan Ruijs: Climate Change and the Stability of Water Allocation Agreements
ETA 17.2007 François Gusdorf and Stéphane Hallegatte: Compact or Spread-Out Cities: Urban Planning, Taxation, and the
Vulnerability to Transportation Shocks
NRM 18.2007 Giovanni Bella: A Bug’s Life: Competition Among Species Towards the Environment
IEM 19.2007 Valeria Termini and Laura Cavallo: “Spot, Bilateral and Futures Trading in Electricity Markets. Implications for
Stability”
ETA 20.2007 Stéphane Hallegatte and Michael Ghil: Endogenous Business Cycles and the Economic Response to Exogenous
Shocks
CTN 21.2007 Thierry Bréchet, François Gerard and Henry Tulkens: Climate Coalitions: A Theoretical and Computational
Appraisal
CCMP 22.2007 Claudia Kettner, Angela Köppl, Stefan P. Schleicher and Gregor Thenius: Stringency and Distribution in the
EU Emissions Trading Scheme –The 2005 Evidence
NRM 23.2007 Hongyu Ding, Arjan Ruijs and Ekko C. van Ierland: Designing a Decision Support System for Marine Reserves
Management: An Economic Analysis for the Dutch North Sea
CCMP 24.2007 Massimiliano Mazzanti, Anna Montini and Roberto Zoboli: Economic Dynamics, Emission Trends and the EKC
Hypothesis New Evidence Using NAMEA and Provincial Panel Data for Italy
ETA 25.2007 Joan Canton: Redealing the Cards: How the Presence of an Eco-Industry Modifies the Political Economy of
Environmental Policies
ETA 26.2007 Joan Canton: Environmental Taxation and International Eco-Industries
CCMP 27.2007 Oscar Cacho and Leslie Lipper (lxxxii): Abatement and Transaction Costs of Carbon-Sink Projects Involving
Smallholders
CCMP 28.2007 A. Caparrós, E. Cerdá, P. Ovando and P. Campos (lxxxii): Carbon Sequestration with Reforestations and Biodiversity-Scenic Values
CCMP 29.2007 Georg E. Kindermann, Michael Obersteiner, Ewald Rametsteiner and Ian McCallcum(lxxxii): Predicting the Deforestation–Trend Under Different Carbon–Prices
CCMP 30.2007 Raul Ponce-Hernandez (lxxxii): A Modelling Framework for Addressing the Synergies between Global
Conventions through Land Use Changes: Carbon Sequestration, Biodiversity Conservation, Prevention of Land Degradation and Food Security in Agricultural and Forested Lands in Developing Countries
ETA 31.2007 Michele Moretto and Gianpaolo Rossini: Are Workers’ Enterprises Entry Policies Conventional
KTHC 32.2007 Giacomo Degli Antoni: Do Social Relations Affect Economic Welfare? A Microeconomic Empirical Analysis
CCMP 33.2007 Reyer Gerlagh and Onno Kuik: Carbon Leakage with International Technology Spillovers
CCMP 34.2007 Richard S.J. Tol: The Impact of a Carbon Tax on International Tourism
CCMP 35.2007 Reyer Gerlagh, Snorre Kverndokk and Knut Einar Rosendahl: Optimal Timing of Environmental Policy;
Interaction Between Environmental Taxes and Innovation Externalitie
SIEV 36.2007 Anna Alberini and Alberto Longo: Valuing the Cultural Monuments of Armenia: Bayesian Updating of Prior
Beliefs in Contingent Valuation
CCMP 37.2007 Roeland Bracke, Tom Verbeke and Veerle Dejonckheere: What Distinguishes EMAS Participants? An
Exploration of Company Characteristics
CCMP 38.2007 E. Tzouvelekas, D. Vouvaki and A. Xepapadeas: Total Factor Productivity Growth and the Environment: A Case
for Green Growth Accounting
CCMP 39.2007 Klaus Keller, Louise I. Miltich, Alexander Robinson and Richard S.J. Tol: How Overconfident are Current
Projections of Anthropogenic Carbon Dioxide Emissions?
CCMP 40.2007 Massimiliano Mazzanti and Roberto Zoboli: Environmental Efficiency, Emission Trends and Labour
Productivity: Trade-Off or Joint Dynamics? Empirical Evidence Using NAMEA Panel Data
PRCG 41.2007 Veronica Ronchi: Populism and Neopopulism in Latin America: Clientelism, Trade Union Organisation and
Electoral Support in Mexico and Argentina in the ‘90s
PRCG 42.2007 Veronica Ronchi: The Neoliberal Myth in Latin America: The Cases of Mexico and Argentina in the ‘90s
CCMP 43.2007 David Anthoff, Cameron Hepburn and Richard S.J. Tol: Equity Weighting and the Marginal Damage Costs of
Climate Change
ETA 44.2007 Bouwe R. Dijkstra and Dirk T.G. Rübbelke: Group Rewards and Individual Sanctions in Environmental Policy
KTHC 45.2007 Benno Torgler: Trust in International Organizations: An Empirical Investigation Focusing on the United Nations
CCMP 46.2007 Enrica De Cian, Elisa Lanzi and Roberto Roson: The Impact of Temperature Change on Energy Demand: A
Dynamic Panel Analysis
CCMP 47.2007 Edwin van der Werf: Production Functions for Climate Policy Modeling: An Empirical Analysis
KTHC 48.2007 Francesco Lancia and Giovanni Prarolo: A Politico-Economic Model of Aging, Technology Adoption and
Growth
NRM 49.2007 Giulia Minoia: Gender Issue and Water Management in the Mediterranean Basin, Middle East and North Africa
KTHC 50.2007 Susanna Mancinelli and Massimiliano Mazzanti: SME Performance, Innovation and Networking Evidence on
Complementarities for a Local Economic System
CCMP 51.2007 Kelly C. de Bruin, Rob B. Dellinkand Richard S.J. Tol: AD-DICE: An Implementation of Adaptation in the DICE
Model
NRM 52.2007 Frank van Kouwen, Carel Dieperink, Paul P. Schot and Martin J. Wassen: Interactive Problem Structuring with
ICZM Stakeholders
CCMP 53.2007 Valeria Costantini and Francesco Crespi: Environmental Regulation and the Export Dynamics of Energy
Technologies
CCMP 54.2007 Barbara Buchner, Michela Catenacci and Alessandra Sgobbi: Governance and Environmental Policy
Integration in Europe: What Can We learn from the EU Emission Trading Scheme?
CCMP 55.2007 David Anthoff and Richard S.J. Tol: On International Equity Weights and National Decision Making on Climate
Change
CCMP 56.2007 Edwin van der Werf and Sonja Peterson: Modeling Linkages Between Climate Policy and Land Use: An
Overview
CCMP 57.2007 Fabien Prieur: The Environmental Kuznets Curve in a World of Irreversibility
KTHC 58.2007 Roberto Antonietti and Giulio Cainelli: Production Outsourcing, Organizational Governance and Firm’s
Technological Performance: Evidence from Italy
SIEV 59.2007 Marco Percolo: Urban Transport Policies and the Environment: Evidence from Italy
ETA 60.2007 Henk Folmer and Pierre von Mouche: Linking of Repeated Games. When Does It Lead to More Cooperation
and Pareto Improvements?
CCMP 61.2007 Arthur Riedacker (lxxxi): A Global Land Use and Biomass Approach to Reduce Greenhouse Gas Emissions,
Fossil Fuel Use and to Preserve Biodiversity
CCMP 62.2007 Jordi Roca and Mònica Serrano: Atmospheric Pollution and Consumption Patterns in Spain: An Input-Output
Approach
CCMP 63.2007 Derek W. Bunn and Carlo Fezzi (lxxxi): Interaction of European Carbon Trading and Energy Prices
CTN 64.2007 Benjamin Golub and Matthew O. Jackson (lxxxiii): Naïve Learning in Social Networks: Convergence, Influence
and Wisdom of Crowds
CTN 65.2007 Jacob K. Goeree, Arno Riedl and Aljaž Ule (lxxxiii): In Search of Stars: Network Formation among
Heterogeneous Agents
CTN 66.2007 Gönül Do!an, M.A.L.M. van Assen, Arnout van de Rijt, and Vincent Buskens (lxxxiii): The Stability of
Exchange Networks
CTN 67.2007 Ben Zissimos (lxxxiii): Why are Trade Agreements Regional?
CTN 68.2007 Jacques Drèze, Michel Le Breton, Alexei Savvateev and Shlomo Weber (lxxxiii): «Almost» Subsidy-free Spatial
Pricing in a Multi-dimensional Setting
CTN 70.2007 Andrea Galeotti and Sanjeev Goyal (lxxxiii): A Theory of Strategic Diffusion
IEM 71.2007 Francesco Bosello, Enrica De Cian and Roberto Roson: Climate Change, Energy Demand and Market Power in
a General Equilibrium Model of the World Economy
ETA 72.2007 Gastón Giordana and Marc Willinger: Fixed Instruments to Cope with Stock Externalities An Experimental
Evaluation
KTHC 73.2007 Oguzhan Dincer and Eric Uslaner: Trust and Growth
CCMP 74.2007 Fei Teng and Alun Gu: Climate Change: National and Local Policy Opportunities in China
KTHC 75.2007 Massimiano Bucchi and Valeria Papponetti: Research Evaluation as a Policy Design Tool: Mapping
Approaches across a Set of Case Studies
SIEV 76.2007 Paolo Figini, Massimiliano Castellani and Laura Vici: Estimating Tourist Externalities on Residents: A Choice
Modeling Approach to the Case of Rimini IEM 77.2007 Irene Valsecchi: Experts and Non-experts
CCMP 78.2007 Giuseppe Di Vita: Legal Families and Environmental Protection: is there a Causal Relationship?
KTHC 79.2007 Roberto Antonietti and Giulio Cainelli: Spatial Agglomeration, Technology and Outsourcing of Knowledge
Intensive Business Services Empirical Insights from Italy KTHC 80.2007 Iacopo Grassi: The Music Market in the Age of Download
ETA 81.2007 Carlo Carraro and Alessandra Sgobbi: Modelling Negotiated Decision Making: a Multilateral, Multiple Issues,
Non-Cooperative Bargaining Model with Uncertainty
CCMP 82.2007 Valentina Bosetti, Carlo Carraro, Emanuele Massetti and Massimo Tavoni: International Energy R&D
Spillovers and the Economics of Greenhouse Gas Atmospheric Stabilization
CCMP 83.2007 Sjak Smulders and Edwin van der Werf. Climate Policy and the Optimal Extraction of High- and Low-Carbon
Fossil Fuels
SIEV 84.2007 Benno Torgler, Bruno S. Frey and Clevo Wilson: Environmental and Pro-Social Norms: Evidence from 30
Countries
KTHC 85.2007 Elena Bellini, Ugo Gasparino, Barbara Del Corpo and William Malizia: Impact of Cultural Tourism upon
Urban Economies: An Econometric Exercise
NRM 86.2007 David Tomberlin and Garth Holloway: Trip-Level Analysis of Efficiency Changes in Oregon’s Deepwater
Trawl Fishery
CTN 87.2007 Pablo Revilla: Many-to-One Matching when Colleagues Matter
IEM 88.2007 Hipòlit Torró: Forecasting Weekly Electricity Prices at Nord Pool
ETA 89.2007 Y. Hossein Farzin: Sustainability and Optimality in Economic Development: Theoretical Insights and Policy
Prospects
NRM 90.2007 P. Sarfo-Mensah and W. Oduro: Traditional Natural Resources Management Practices and Biodiversity
Conservation in Ghana: A Review of Local Concepts and Issues on Change and Sustainability
NRM 91.2007 Lorenzo Pellegrini: The Rule of The Jungle in Pakistan: A Case Study on Corruption and Forest Management in
Swat
NRM 92.2007 Arjan Ruijs: Welfare and Distribution Effects of Water Pricing Policies
ETA 93.2007 Jean-Marie Grether, Nicole A. Mathys and Jaime de Melo: Trade, Technique and Composition Effects: What is
Behind the Fall in World-Wide SO2 Emissions 1990-2000?
PRCG 94.2007 Bernardo Bortolotti, Carlo Cambini, Laura Rondi and Yossi Spiegel: Capital Structure and Regulation: Does
Ownership Matter?
CCMP 95.2007 Valentina Bosetti, Carlo Carraro, Emanuele Massetti and Massimo Tavoni: Optimal Energy Investment and
R&D Strategies to Stabilise Greenhouse Gas Atmospheric Concentrations
CCMP 96.2007 Xavier Pautrel: Pollution, Health and Life Expectancy: How Environmental Policy Can Promote Growth
KTHC 97.2007 Roberto Antonietti and Davide Antonioli: Production Offshoring and the Skill Composition of Italian
Manufacturing Firms: A Counterfactual Analysis
CTN 98.2007 Miyuki Nagashima and Rob Dellink: Technology Spillovers and Stability of International Climate Coalitions
ETA 99.2007 Eftichios S. Sartzetakis and Panagiotis D. Tsigaris: Uncertainty and the Double Dividend Hypothesis
CTN 100.2007 Andrew J. Dowell, Michael Wooldridge and Peter McBurney: The Computational Difficulty of Bribery in Qualitative Coalitional Games
ETA 101.2007 Alessandra Sgobbi and Carlo Carraro: A Stochastic Multiple Players Multi-Issues Bargaining Model for the Piave River Basin
SIEV 102.2007 Helen Ding, Paulo A.L.D. Nunes and Laura Onori: An Economic Model for Bioprospecting Contracts
IEM 103.2007 Bruno Bosco, Lucia Parisio, Matteo Pelagatti and Fabio Baldi: A Robust Multivariate Long Run Analysis of European Electricity Prices
CCMP 104.2007 Giulio Cainelli, Massimiliano Mazzanti and Roberto Zobol: Environmentally-Oriented Innovative Strategies and Firm Performances in Services. Micro-Evidence from Italy
CCMP 105.2007 Antoine Dechezleprêtre, Matthieu Glachant and Yann Ménière: The Clean Development Mechanism and the International Diffusion of Technologies: An Empirical Study
(lxxxi) This paper was presented at the EAERE-FEEM-VIU Summer School on "Computable General Equilibrium Modeling in Environmental and Resource Economics", held in Venice from June 25th to July 1st, 2006 and supported by the Marie Curie Series of Conferences "European Summer School in Resource and Environmental Economics".
(lxxxii) This paper was presented at the Workshop on “Climate Mitigation Measures in the Agro-Forestry Sector and Biodiversity Futures”, Trieste, 16-17 October 2006 and jointly organised by The Ecological and Environmental Economics - EEE Programme, The Abdus Salam International Centre for Theoretical Physics - ICTP, UNESCO Man and the Biosphere Programme - MAB, and The International Institute for Applied Systems Analysis - IIASA.
(lxxxiii) This paper was presented at the 12th Coalition Theory Network Workshop organised by the Center for Operation Research and Econometrics (CORE) of the Université Catholique de Louvain, held in Louvain-la-Neuve, Belgium on 18-20 January 2007.
2007 SERIES
CCMP Climate Change Modelling and Policy (Editor: Marzio Galeotti )
SIEV Sustainability Indicators and Environmental Valuation (Editor: Anil Markandya) NRM Natural Resources Management (Editor: Carlo Giupponi)
KTHC Knowledge, Technology, Human Capital (Editor: Gianmarco Ottaviano) IEM International Energy Markets (Editor: Matteo Manera)
CSRM Corporate Social Responsibility and Sustainable Management (Editor: Giulio Sapelli) PRCG Privatisation Regulation Corporate Governance (Editor: Bernardo Bortolotti) ETA Economic Theory and Applications (Editor: Carlo Carraro)