HAL Id: hal-01472865
https://hal.archives-ouvertes.fr/hal-01472865
Submitted on 21 Feb 2017
HAL is a multi-disciplinary open access
archive for the deposit and dissemination of
sci-entific research documents, whether they are
pub-lished or not. The documents may come from
teaching and research institutions in France or
abroad, or from public or private research centers.
L’archive ouverte pluridisciplinaire HAL, est
destinée au dépôt et à la diffusion de documents
scientifiques de niveau recherche, publiés ou non,
émanant des établissements d’enseignement et de
recherche français ou étrangers, des laboratoires
publics ou privés.
Copyright
How Data Workers Cope with Uncertainty
Nadia Boukhelifa, Marc-Emmanuel Perrin, Samuel Huron, James Eagan
To cite this version:
Nadia Boukhelifa, Marc-Emmanuel Perrin, Samuel Huron, James Eagan. How Data Workers Cope
with Uncertainty: A Task Characterisation Study. CHI 2017, ACM, May 2017, Denver, United States.
�10.1145/3025453.3025738�. �hal-01472865�
How Data Workers Cope with Uncertainty:
A Task Characterisation Study
Nadia Boukhelifa
1,4Marc-Emmanuel Perrin
1,2Samuel Huron
3James Eagan
11
LTCI, CNRS, Telecom ParisTech, Université Paris-Saclay
2
LRI, Univ. Paris-Sud, CNRS, Inria, Université Paris-Saclay
3
I3, CNRS, Telecom ParisTech, Université Paris-Saclay
4
UMR GMPA, AgroParisTech, INRA, Université Paris-Saclay
{firstname.lastname}
1,2,3@telecom-paristech.fr
4@inra.fr
ABSTRACT
Uncertainty plays an important and complex role in data anal-ysis, where the goal is to find pertinent patterns, build robust models, and support decision making. While these endeavours are often associated with professional data scientists, many do-main experts engage in such activities with varying skill levels. To understand how these domain experts (or “data workers”) analyse uncertain data we conducted a qualitative user study with 12 participants from a variety of domains. In this paper, we describe their various coping strategies to understand, min-imise, exploit or even ignore this uncertainty. The choice of the coping strategy is influenced by accepted domain practices, but appears to depend on the types and sources of uncertainty and whether participants have access to support tools. Based on these findings, we propose a new process model of how data workers analyse various types of uncertain data and con-clude with design considerations for uncertainty-aware data analytics.
ACM Classification Keywords
H.5.m. Information Interfaces and Presentation (e.g. HCI): Miscellaneous
Author Keywords
uncertainty; data analysis; data science; qualitative study.
INTRODUCTION
Data scientists are professionals whose primary function is to extract knowledge or insight from structured and unstructured data. One of the key challenges they face is how to deal with uncertainty that could arise from, e.g., missing values, impre-cision, and noise. In today’s age of digital footprints, experts from various domains equally engage in data science activi-ties with varying levels of skills. These non-professional data scientists, or data workers, acquire and generate datasets that
Nadia Boukhelifa, Marc-Emmanuel Perrin, Samuel Huron & James Eagan. How Data Workers Cope with Uncertainty: A Task Characterisation Study. In Proceedings of the 35th international conference on Human factors in computing systems (CHI ’17), 12 pages, ACM, May 2017. To appear.
©ACM, 2017. This is the authors’ version of the work. It is posted
here by permission of the ACM for your personal use. Not for redistri-bution. The definitive version will be published in CHI 2017, May 6-11, 2017, Denver, CO, USA. ISBN 978-1-4503-4655-9/17/05 ...$15.00. http://dx.doi.org/10.1145/3025453.3025738
they then need to explore, in order to find pertinent patterns, build robust models, and construct supporting arguments for decision making. Whereas professional data scientists may have formal training to deal with uncertainty (e.g. uncertainty modelling, propagation, and visualization techniques), it is not clear how data workers deal with this uncertainty in practice. Uncertain data may require special types of analysis tasks and exploration strategies, but little work has looked at how data workers manage uncertainty.
Existing work that has looked at data analysis in the wild did not necessarily focus on uncertainty [16] or only examined one aspect of the analysis such as the uncertainty categories [32]. Work that has considered the whole analysis pipeline has gen-erally focused on specific domains or on trained data scien-tists [31]. In addition, related user-studies on uncertain data analysis have largely dealt with simplified low-level tasks, making it unclear how applicable the results of these studies are in the real-world [29]. When high level tasks are used, few authors justify their choice [19]. Recent reviews [19, 18, 3] on the exploration of uncertain data show an existing, large body of work that focuses on communication [17, 12], collaboration [35, 8] and user evaluations [4, 34]. These re-views also highlight the need to focus on enabling reasoning and sense-making under uncertainty [25]. Although there are established general data analysis and sense-making models, few frameworks explicitly consider uncertainty at all stages of analysis.
To better understand how data workers analyse uncertain data in practice, we conducted a qualitative user study to identify the various sources and types of uncertainty that our study participants encounter in their daily work; the tasks that they engage in when they are confronted with uncertainty; the dif-ferent uncertainty coping strategies they deploy; and other factors that may affect analysis under uncertainty. Our con-tributions are (1) a characterisation of uncertainty-aware data analysis in practice, highlighting sources and types of uncer-tainty, specific tasks and processes, strategies to manage and exploit this uncertainty, and human and technical factors affect-ing the analysis; (2) a process model that describes common uncertainty-aware data analysis tasks and workflows; and (3) a set of design considerations and open research questions for further research in the analytics of uncertainty.
RELATED WORK
A variety of research has focused on understanding how ana-lysts work with uncertain data, including defining typologies, task taxonomies, coping strategies, and creating analysis and sense-making models. We contribute to this body of work an analysis of how real-world data workers think about, under-stand, and deal with uncertainty.
The Diversity of Uncertainty Concepts and Terms
There is no unified single definition of uncertainty across all domains. The general consensus is that there are different meanings and that the term itself encapsulates many concepts. For example, in information theory, Klir et al. [22] describe uncertainty as a source of deficiencies such as incompleteness or as imprecise, unreliable, vague or contradictory information. With some overlap to Klir et al.’s taxonomy, Pang et al. [27] define uncertainty for the scientific visualization domain to include “statistical variations or spread, errors and differences, minimum-maximum range values, and noisy or missing data”. In Geographic Information Science (GIScience), MacEachren et al. [26] built on existing models of information uncertainty to produce a topology of geospatial uncertainty with the goal of supporting visualization. Their conceptualisation delineates nine components of information uncertainty including error, precision, completeness, consistency, and subjectivity. To further characterise information uncertainty, a number of authors have looked at sources of uncertainty. Pang et al. [27] discuss how uncertainty can be introduced to the visualization pipeline from models, measurements, data transformations, and the visualization process itself. Taking the decision-maker into account, Kahneman and Tversky’s [15] taxonomy for what they call variants of uncertainty describes two sources of uncertainty: internal attributed to the human thinker, and ex-ternal relating to the outside world. In the same spirit, Schunn and Trafton [31] divide sources of information uncertainty in scientific data analysis into four classes related to physics, computation, visualization, and cognition.
These efforts to conceptualise uncertainty can have different goals in mind (e.g. support data analysis, visualization or deci-sion making), which may explain their differences. However, there are also some commonalities. Gershon [7] proposed a high level taxonomy of causes for imperfect knowledge where uncertainty becomes one source of this imperfection, with the remaining causes: corrupted data and information, incompleteness, inconsistency, complexity and imperfect pre-sentation. Skeels et al. [32] also looked at common uncertainty categories across domains. Their classification captures two uncertainty dimensions: types and levels of uncertainty; where measurement uncertainty lives at the low level of the taxon-omy, completeness at the mid level, inference at the high level, and credibility and disagreement span all levels.
Strategies and Tasks to Cope with Uncertainty
Although not the focus of their study, Skeels et al. [32] looked at how domain experts deal with information uncer-tainty. Their participants decided to either “live with the un-certainty” or “try to become more certain”. The choice of which strategy to adopt was the result of balancing the costs
and benefits of accounting for the uncertainty. A more detailed description of uncertainty coping strategies in scientific data analysis can be found in [31]. Based on longitudinal observa-tions of experts in the field, Shunn and Trafton described two categories for dealing with informational uncertainty: diag-nosis and reduction. They illustrated each strategy with tasks they observed from cognitive anthropological work that they carried out over several years for specific scientific domains. Like our work, they conducted interviews and real-world obser-vations. Our focus in this work, however, is on understanding how data workers, or what we could call non-professional data scientists, think about, manage, and interpret uncertainty. As such, while we use similar methods, our participants come from a wider variety of domains and would not necessarily associate with the job title of “[data] scientist.”
The closest work in spirit to ours is perhaps the study by Lip-shitz and Strauss [23]. Their work is also concerned with the understanding of uncertainty, coping strategies, and the rela-tionship between the two. However, our contexts, methods and results differ. Lipshitz and Strauss focus on decision makers in the context of military defense. In contrast, our participants are data workers from a variety of domains and they engage in data-driven decision support; they are not necessarily decision makers. Further more, Lipshitz and Strauss use self reports of decision making scenarios drawing on participants’ long term memory. We use interviews and think aloud walkthroughs and look specifically at user interactions with support tools.
Uncertainty-Aware Sensemaking Models
Various authors have proposed design guidelines for empir-ical evaluation studies that take into account pain points in the sense-making process (such as hypothesis management, reasoning, and decision making) and their associated cogni-tive biases [28]. Klein et al.’s data-frame theory of sense-making [21, 20] proposes a closed-loop to track anomalies, gauge data quality and infer new data that could be suitable to manage uncertainty in the sense-making process and on the user’s mental model. These models suggest that analysts maintain a mental representation of what data should be like, allowing them to filter uncertain data from their workflows. The use of uncertainty in the decision making process is not new and impacts various domains, types of data, and kinds of analysis [11]. Focusing on the human analyst, Grolemund and Wickham [9] propose a cognitive model and interpreta-tion of the data analysis process that describes the effects of cognitive bias inherited from sense-making processes, with a goal of improving current data-analysis. Other work has exam-ined relationships between uncertainty and human trust [30] to propose guidelines and challenges aiming to handle uncer-tainty, and to expose frameworks for uncertainty-aware visual analytics systems [6, 25]. By better understanding the role of uncertainty in the analytic process, we can provide data workers with much-needed tools to facilitate reflection over the relationships in a whole data set [1] and to provide support for decision-making in the face of uncertainty [2].
STUDY DESIGN
We conducted semi-structured interviews and think-aloud de-mos with domain experts to better understand their workflows
when they analyse uncertain data. In particular, we wanted to investigate the following aspects of analysis under uncertainty: [A1] The types & sources of uncertainty affecting analysis. [A2] The tasks data workers engage in.
[A3] The strategies they deploy to cope with uncertainty. [A4] The role of expertise & automatic tools in the analysis.
Participants
We interviewed 12 domain experts (9 female) aged 26–56 (mean 38) from 11 different organisations (2 enterprise, 7 research and 3 mixed units). The organisations where from different sectors including healthcare, marketing, history and GIScience (Table 1). Participants were self identified as work-ing with uncertainty describwork-ing it as an important aspect to consider during the analysis and decision making. They held a number of job titles, including “researcher”, “historian”, “medical surgeon”, “consultant” and “chief data officer”. Parti-ciants ranged from PhD. students in their second year of work to chief data officer with over 14 years of experience. In this paper, we use the term “data worker” to refer to anyone whose primary job function includes working with data to answer questions that inform business [16] or research decisions. We recruited participants by email contacts at organisations within our personal and professional networks.
Study Procedure
The study was conducted in the following steps. First, we care-fully prepared a recruitment email paying attention not to bias potential participants. For instance, we did not provide a defi-nition of what uncertainty means. However, when prompted, we gave this definition: “uncertainty is when you are not sure about one or more aspects of your data”. Data was defined as any artifact used for the analysis such as text documents, data tables, images and maps. We asked our participants to pre-pare an analysis scenario from a recent project. We arranged to meet our participants in their workplace whenever possi-ble (three participants were interviewed by means of video conferencing because they were travelling or due to visitor restrictions at their workplaces). Interviews were one-to-one and lasted from 45 minutes to 2 hours. They were conducted in the participant’s native language (10 participants) or the second language to facilitate verbalisation. We began each in-terview with a quick introduction describing the purpose of the study: “to understand how domain experts explore and anal-yse uncertain data”. The rest of the interview was conducted in a semi-structured fashion. Whenever possible, we asked participants to show us the tools and data sets they use within their current organisation and walk us through their scenario in a think-aloud demo style. All interviews were video recorded to better capture user interactions with the tools. Throughout the interview, we took extensive notes.
Interviews and Think-Aloud Demos
We asked open-ended questions and encouraged participants to describe their lived experiences, such as “walk us through a recent analysis scenario” or “if you had a magic wand, what would you change to improve the analysis described in your scenario?”. The interview was structured in three parts. In the first part, we asked questions about what uncertainty means to the participant and their community’s general approach for
handling uncertainty [A1,A3]. In the second part, we asked participants to think of a recent project or scenario where they had to analyse data for their work, e.g. to report on their findings or to make a decision, and where taking uncertainty into account was important. After describing the context of the scenario, datasets and tools, we wanted to understand how the analysis is undertaken by asking participants to break down their workflow into three to six main steps. For each step, we asked participants questions to clarify the high level goals, specific tasks and uncertainty coping strategies [A2,A3]. In addition, we paid special attention to the different analysis stages affected by uncertainty, and the role of expertise and automatic tools at each step [A4]. Whenever possible, this part of the interview was run as a think-aloud demo session (7 out of 12 participants prepared a demo). Here, we asked the participants to proceed with their analysis while speaking out loud about what they are thinking of. The interviewer observed, asked questions and took extensive notes. In the final part, we had an open discussion about the main challenges data workers face today when exploring uncertain data and their views on how these could be addressed.
Data Collection and Analysis
We collected 681 minutes of recordings in total, which were transcribed by one author. The resultant data set contained 92,151 words. Two authors independently open coded the tran-scripts, highlighting interesting snippets of text and key ideas. We then crossed checked the selected excerpts before extract-ing 805 snippets, we call “notes”, into a data table. After filtering, we analysed 787 notes using iterative coding based on the grounded theory [5] method and digital affinity diagram-ming. We grouped common types and sources of uncertainty; tasks and strategies; and tools and expertise into high level categories. We iterated and refined these categories in separate affinity diagrams as we gathered more data. An analysis of affinity diagramming log data for theoretical saturation found conceptual stability after ⇡23of the data analysis. Whenever
possible, we went back to our participants for validation. In total we produced four independent affinity diagrams covering the different aspects of uncertainty: types and sources [A1], tasks and strategies [A2,A3], human and technical factors [A4], in addition to a global diagram containing all the notes. A second type of analysis was carried out to extract work-flows from participants’ scenarios. This was achieved in the following steps: (a) two independent authors analysed the video and transcript data, and drew a process diagram for each participant’s scenario; (b) each diagram was sent to the corre-sponding participant for validation; (c) two authors open coded participants’ activities using, as much as possible, the task la-bels that emerged from the affinity diagramming (there were 161 tasks in total); (d) these domain-specific tasks were open coded by the same authors and mapped into five high-level categories, we call processes (Figure 1).
Apparatus
To facilitate the exploration of our notes, we prototyped an affinity diagramming tool to use on a multi-touch wall-size display. Whereas analog affinity diagramming provides rich interactions and material affordances [10], we found that when
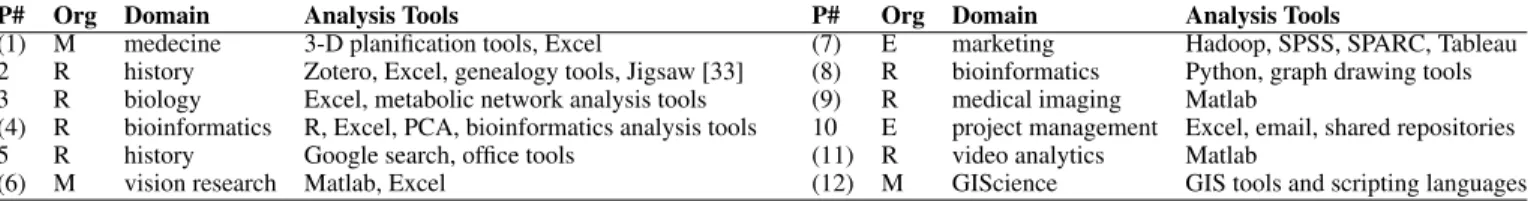
P# Org Domain Analysis Tools P# Org Domain Analysis Tools
(1) M medecine 3-D planification tools, Excel (7) E marketing Hadoop, SPSS, SPARC, Tableau
2 R history Zotero, Excel, genealogy tools, Jigsaw [33] (8) R bioinformatics Python, graph drawing tools
3 R biology Excel, metabolic network analysis tools (9) R medical imaging Matlab
(4) R bioinformatics R, Excel, PCA, bioinformatics analysis tools 10 E project management Excel, email, shared repositories
5 R history Google search, office tools (11) R video analytics Matlab
(6) M vision research Matlab, Excel (12) M GIScience GIS tools and scripting languages
Table 1. Participants by domain of expertise. Organisation: R:research, E:enterprise and M:mixed. Participant IDs between brackets indicate data workers with scripting or programming skills. Tools refer to software packages and libraries used for the data analysis scenario.
dealing with a large set of notes, digital affinity diagramming is a more effective approach to accommodate our emerging hypotheses. It also helped to save time and avoid digitisation and note transfer errors.
FINDINGS
In this section we report on our main findings, covering sources and types, processes and workflows, uncertainty coping strate-gies, and human and technical factors. As much as possible, we will give example statements from participants.
Our participants contributed their own definitions of what un-certainty means for their respective domains. We found that most of these definitions covered two important aspects of uncertainty: type and source. Uncertainty types refer to un-knowns and imperfections that are often measurable in some way, qualitatively or quantitatively. Uncertainty sources refer to the causes of uncertainty. We note that although some partic-ipants referred to established taxonomies (e.g. in GIScience) to define precisely what uncertainty means for their domain, others used the term “uncertainty” more broadly.
Generally speaking, sources and types of uncertainty do not form a perfect dichotomy: some sources of uncertainty can also be considered as categories of uncertainty and vice versa, whereas some sources and types of uncertainty are indepen-dent. These terms fall generally into one of four layers: data, model, interface, and cognitive. At the data layer, uncertainty pertains to the data set itself, such as uncertainty about particu-lar values in the data. At the model layer, uncertainty pertains more to processing applied to the underlying data, such as to fit them to a particular model. The interface layer deals with the software that acts as an interface between the data and the user. Finally, uncertainty at the cognitive level relates to how the user interprets and makes sense of the data.
Source and types of uncertainty do not cleanly partition into individual categories. For example, ambiguity may enter in at the data level or it may pertain to reasoning. As such, individ-ual source-types of uncertainty may figure in at multiple levels. (Note: quotations indicated with a†have been translated.)
Types of Uncertainty
In this section, we describe the types of uncertainty that we identified in participant interviews. These types are not in-tended to provide an exhaustive taxonomy of the different kinds of uncertainty that exist. Rather, our intent is to provide a characterisation of the kinds of uncertainty that arose from our interviews.
Uncertainty arose at all layers of the data analysis model: at the data, model, interface, and cognitive layers. At thedata
layer, we identified five such types of uncertainty: Errors; im-precise or inaccurate data; inconsistency; missing or unknown data; and vagueness, ambiguity, and fuzziness. Errors pertain to captured data that might not accurately reflect ground truth, such as might be introduced by transcription errors; impre-cision may be due to sensor error or historical artifacts. For example, one participant dealt with historical manuscripts that date from somewhere in the “13th or 14th century” (P5†).
Am-biguity or fuzziness may derive from inexact naming: “The catch is that, in [this country], a city is not unique. There can be two [city-name]s in [this country]” (P7†). Finally,
miss-ing data pertains to values that might not have been recorded in the data set. Regardless of which kind of uncertainty is present, uncertainty at the data level relates to uncertainty that exists in the underlying captured data and its relationship to the phenomena they are intended to represent.
Model uncertainty is that which is related to the models that are used to, e. g., fit or analyze the data by automated means. This kind of uncertainty generally consists of inaccuracy and error, wherein the model may be an approximation of pro-cesses described by the data.
Interface uncertainty relates to the software interface used to process, visualise, or interact with the data. It is differ-ent from modelling types in that the software does not try to interpret or model the data. We identified two types of interface uncertainty: algorithmic errors and inconsistency between the system and interface. Algorithmic errors are those introduced by data processing algorithms, such as when OCR might misinterpret an 18th-century long “s” as an “f” (P5). Finally,cognitive uncertainty pertains to the human reason-ing process, such as sense-makreason-ing or inter-personal dynamics. For example, one participant would try to reason about missing data by making several categories of possible values, carry-ing those possibilities throughout the different phases of the analysis process (P12).
Sources of Uncertainty
As with types of uncertainty, we have identified a variety of sources of uncertainty at the data, model, interface, and cognitive levels. Sources of uncertainty at the data level pertain to uncertainty that manifests itself directly in the data set itself. These sources thus pertain to uncertainty in the source data under consideration. We have identified the following kinds ofdata sources of uncertainty among our participants: variability, temporality, inconsistency, missing data, and bias. One such example is when meaning may change over time: “[City A] is today a part of the city of [City B], but back then it was an independent parish” (P2†). These kinds of sources
Process Goal Typical Tasks Process Goal Typical Tasks
Acquire collect and enrich data generate, measure, store Reason derive meaning infer, hypothesise, compare, validate
Manipulate transform data transform, correct, remove Present share findings plot, write a report, make a presentation
Characterise* generate info on uncertainty annotate, compute, model
Table 2. The five processes of data analysis under uncertainty. Characterise uncertainty being a key process.
Model sources are not directly related to the data themselves but to applied models, such as by using sampling on a continu-ous data model (P6).Interface sources introduce uncertainty that is not necessarily present in the underlying data or the model, but rather in the tools used to communicate them to the user.
Finally,cognitive sources of uncertainty come from
reason-ing about the data or other similar cognitive, human fac-tors, rather than uncertainty intrinsic to the data. We iden-tified three primary cognitive sources of uncertainty: ambi-guity/communication, subjectivity, and more general human factors. For example, a historian reported that when “read-ing the same article, . . . , I understood one th“read-ing, and [my colleague] understood something else” (P2†).
Processes in Uncertain Data Analysis
In this section we describe abstract tasks that our participants engaged in when they analysed uncertain data. Our approach is similar to [14] for collaborative visual analysis and [13] for visualization construction, where we also focus on meta-level processes rather than low level tasks. We then use these pro-cesses as building blocks to illustrate participants’ workflows from which we generate a process model that characterises uncertain data analysis. We illustrate this process model with a use case from participant P12 (Figure 3).
Our analysis revealed five processes frequently used by our participants when analysing uncertain data (summarised in Ta-ble 2): acquire, manipulate, reason, characterise and present. Key to data analysis are the manipulate, characterise and rea-son processes. We differentiate between these processes by the output they each produce: manipulate generates data; char-acterise generates meta-data and reason generates thoughts. The characterise process being particular to uncertain data analysis. We note that these sensemaking processes are not strictly delineated in practice. In many cases, we observed overlaps between processes. In our analysis, we characterised these processes by the dominant process or by a transition between overlapping processes. We describe each process and provide real examples drawn from our study, discussing when relevant, the type and source of uncertainty, participants’ tasks and any collaboration with other parties.
Acquire: Most participants start their analysis by acquiring data (11/12) and half of them would repeat this process at least once during the analysis. The acquisition process comprises activities involving collecting, generating, enriching and stor-ing data. The result of this process is often a database. Our participants acquired images (P1,2), sensor data (P6,9,11,12), log data (P12), DNA sequencing tables (P3,4,8), and docu-ments (P2,5,10). They either generated these datasets them-selves or received them from a third party or a combination of both. Data acquisition in itself, was considered a source of
uncertainty, often generating errors, imprecisions, vagueness, inconsistencies and missing values.
Manipulate: The manipulation process consists of applying computerised tools that transform data. We have observed four groups of data manipulations: transform by application of statistical operations (e.g. normalisation) and aggregation; correct often to clean data or correct known biases; remove such as for filtering outliers; and enrich through data fusion, extrapolation, duplication and estimation. We consider op-erations that change models of data as part of this category. These operations can be manual or automatic and the output is typically a transformed or a new database or model. All our participants manipulated data or models of it; and used one or more of the aforementioned data manipulation tasks.
Characterise Uncertainty: This process involves any
op-eration which tries to qualify or quantify uncertainty, thus generating information about uncertainty. We found this pro-cess to be characteristic of uncertainty-aware data analysis, and all our participants engaged in this activity. Characterisa-tion tasks are either informal via annotaCharacterisa-tions, or more formal to compute or model the uncertainty. When annotating, partic-ipants assigned notes to data, to describe their thoughts, doubts and their own or collaborative informal assessments of data quality. The output of this task are often annotations and com-ments, stored as metadata in a database (P1,2,3,4,10). This method was most used for annotating the following data level uncertainties: ambiguity (P1,2,10), imprecisions (P1,2,12) and inconsistency (P10). Computing the uncertainty was often carried out through statistical assessments of data quality (e.g. calculating the mean and standard deviation (P1,4,7)), or by defining a quality threshold manually (P1) or through learning and clustering algorithms (P7,9,12). This method was applied to a variety of uncertainty categories: variability (P1,4,7,9,12), missing data (P1,9), imprecision (P9,12), error (P7), noise (P9) and inconsistency (P12). Modelling is the most formal way to characterise uncertainty. A few participants engaged in this activity where they tried to build a model that takes uncertainty into account (P8,9,12) or model the uncertainty in itself (P12). All these models had a confidence attribute to characterise predictions or estimations. This method was most used for missing data (P8) and ambiguity (P12).
Reason: Reasoning encapsulates all tasks that result in the generation of thoughts, insights or decisions. This could be an individual or a collaborative task. The outcome of this process is currently not stored or exploitable in an automatic process. In this category, we include the following re-occurrent tasks within our participants: infer, interpret, make a hypothesis, cross check, compare, search, derive insight, conclude and validate with experts. All of our participants reasoned about their data and with uncertainty during their analysis.
P1AcquircharaReas Reaschara charaData Annot AnnotPreseAcquirReas P2AcquirReas ReasData Reas ReasAnnotReas
P3AcquircharaDataData chara AnnotReas Reas Reas Reas Reas Reas ReasPrese
P4AcquircharaReasData ReascharaData DatacharaReasDataAnnotReas Reas Reas P5AcquirDataAcquirReas ReascharaReasAcquirAnnot Link ( charaReas
P6Acquir AcquirDatacharaReasDatacharaReascharaReascharaReas ReascharaDataPrese
P7Reas ReasAcquirReascharaAcquirData DataDataData chara chara charaReasPrese PreseData
P8AcquirDataReaschara charaReas
P9AcquirDataDataData DataReaschara chara charaReas ReasCharaDataReas P10AcquircharaDatacharaAcquirchara chara chara chara charaPrese PresecharaData Reas P11AcquirDatachara charaDataAcquirData
P12AcquirReaschara charaDatachara charaReas Reas ReasAcquirDataPrese
Reasoning Present Present Present Present Reasoning Reasoning Present Reasoning Reasoning ACQUIRE DATA MANIPULATE DATA CHARACTERIZE UNCERTAINTY REASON PRESENT
Figure 1. Analysis workflows for all participants using the five uncer-tainty processes: acquire, manipulate, characterise, reason and present.
Present: In the present process, participants produced arte-facts such as written reports, presentations and plots for the purpose of exploration, communication and dissemination. All participants used this process, usually towards the end of their analysis workflow. However, only a few participants used the present process to explore intermediate results. Amongst these participants, (P9) was interested in visualising two categories of uncertainty: noise and variability. This participant produced histograms to understand data distribution, and used Fourier transfom visualizations, to understand the quality of measured signals. Other participants, used graph based visualizations to explore ambiguous entity relationships (P2).
Sequences of Processes and Workflows
To understand how the five processes of analysis under uncer-tainty relate to one another, we created a process workflow for each participant using our process labels (Figure 1). The visual analysis of these processes shows no common overall sequencing between participants. What is shared, however, is that many participants started their analysis with data acqui-sition and finished with a presentation of their findings (six participants). Starting with data acquisition seems a standard practice (11/12), however, what is interesting is that it could occur at any time during the analysis process itself. Indeed, participants often needed to enrich their data from external sources (P2,7), even towards the end of the analysis for com-parison with initial views e.g. P1 who compared a 2D scan acquired at the beginning of the analysis with another one performed after a surgical operation.
Data manipulation, is at the core of the analysis, interleaved with reasoning and uncertainty characterisation. Similar to data acquisition and manipulation, but with a higher frequency is the uncertainty characterisation process. It appears that the majority of participants used this process extensively, often using two or more characterisation operations in a row. For instance, participant P10 recorded various types of annotations when resolving conflicts related to software versioning. P5 adopted a similar approach for characterising ambiguous links between paragraphs in a manuscript. Interestingly, uncertainty characterisation is never at the end of the analysis (like data acquisition). This is because for all of our participants, man-aging uncertainty was an aspect of analysis and not the goal. Reasoning also happens at various places in the analysis. This is understandable, as participants form hypotheses that inform all other steps of data analysis.
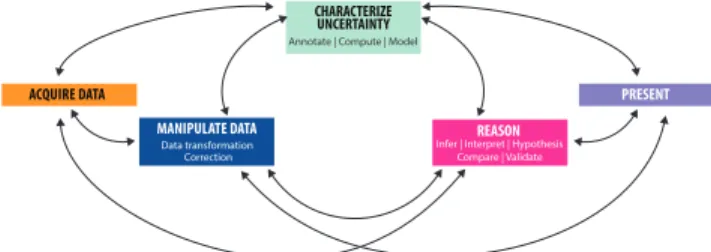
We translated these findings about the process sequences into the process model in Figure 2. The diagram illustrates our
ACQUIRE DATA PRESENT CHARACTERIZE
UNCERTAINTY Annotate | Compute | Model
MANIPULATE DATA Data transformation Correction
REASON Infer | Interpret | Hypothesis
Compare | Validate
Figure 2. A flow-diagram describing the variety of ways data workers interact with uncertainty information during data analysis and sense-making. Characterising uncertainty is a distinctive step in uncertainty-aware data analysis and can happen at any stage.
observation that the five data analysis processes can occur at anytime during the analysis. The links between the process boxes indicate possible sequence paths.
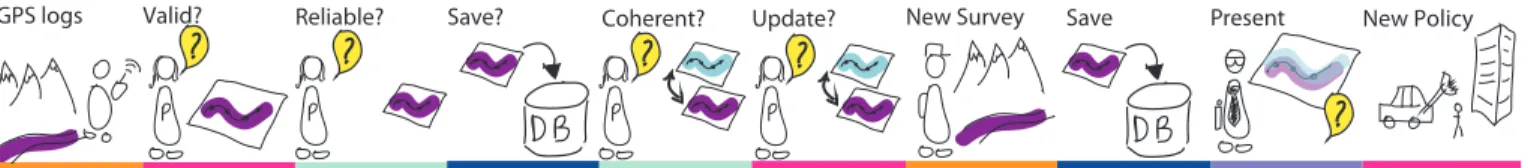
Use case
Participant (P12) is a GIScience expert working at a state agency. P12’s employer plans a new update to the company’s database. One source of information they are currently us-ing are crowd-sourced GPS logs that walkers publish online. However the acquisition of these GPS logs could generate errors, noise, and incoherent data(>acquire data). The first analysis step undertaken by P12 is to interpret the new data to locate the geospatial features described in the logs. P12 then tries to assess whether the new data is valid and meets the company’s standards(>reason). This can be done automati-cally or manually, and involves multiple sub-tasks: filtering outliers and aberrant values, and verifying whether the GPS logs have the expected scales, distances, directions and speed (>characterise uncertainty). The outcome of this step deter-mines whether or not P12 will save the crowdsourced data (> manipulate data). If this data is not reliable, P12 tries to find more appropriate sources. Next, P12 compares logs with existing models(> characterise) based on multiple criteria, in order to produce a trust score. P12 then tries to identify the new changes required to update their database(> reason), for instance, adding a new path that has emerged in the forest due to incidents. If the changes are important and P12 is unsure, a surveyor is sent to the field toacquire data. P12 goes through the identification process again, and then finally saves the data (> manipulate data) along with a trust score. Finally, the new data and the computed/modelled uncertainty are presented to decision makers. Based on this information, decision makers create new policies and construction plans.
Next, we go deeper into the analysis of uncertainty pro-cesses, by considering how data workers combine operations to achieve goals with respect to uncertainty management.
Strategies to Cope with Uncertainty
The analysis of our data revealed two categories of uncertainty coping strategies: active and tacit. Active strategies involve methods that participants employed to understand, minimise or exploit the underlying uncertainties. We add to this cate-gory the ignore strategy, where participants chose to explicitly ignore uncertainty either because it was not relevant to the analysis or business need, or because it was difficult to con-trol. Tacit strategies reflect accepted domain practices and perceptions with regards to uncertainty.
Save
Update? New Survey Present New Policy
Reliable? Save? Coherent?
Valid? GPS logs
Figure 3. A simplified process diagram of participant P12. The coloured line under the sketch corresponds to the steps of the flow diagram analysis for that participant. Yellow bubbles represent the analysis steps affected by uncertainty information, as reported in our participant’s scenario.
In the following sections we summarise active user strategies for coping with uncertainty at the data level, before discussing tacit coping strategies. We do not discuss active strategies relating to non-data levels as we do not have enough notes related to this aspect of analysis. For each strategy, we discuss key component tasks and relate them to the five analysis pro-cesses (Acquire, Manipulate, Characterise, Reason, Present), as well as uncertainty types and sources.
Active Data-Level Strategies
All participants used one or more active strategies for their analysis scenario. What is noticeable is that all participants deal with more than one category of uncertainty (min 2, max 6), with nine participants dealing with four or more types and sources of data uncertainty (Table 3).
Ignoring Uncertainty: Although seven participants declared having ignored a known uncertainty in their data at some point during the analysis, this is not a common strategy (P2,4,5,6,7,11,12). Our participants ignored known uncertain-ties when the category of uncertainty itself was not relevant to the analysis or when dealing with it was outside the scope of their role or expertise. There are also cases where uncertainty was too difficult to control, e.g. or due to technical limitations, e.g. “We cannot do anything with the first [technical bias], which is the viewpoint of the camera.” (P11†).
Ignoring ambiguity in data can involve taking actions such as excluding all ambiguous objects from the analysis, or dupli-cating objects: “... may be that [name of a historical person] in my database is the right one. I prefer to make a duplicate ... It is always yes or no. There is never a middle ground. And this is what I really need.” (P2†). For inconsistency due to
conflicting data sources, the ignore strategy involves propagat-ing the conflict down the analysis pipeline rather than dealpropagat-ing with it at the source. Ignoring missing data, refers to making hypotheses or assumptions about an incomplete dataset. We noticed that ignoring uncertainty at later stages of the anal-sis does not mean that the data worker did not deploy active strategies to understand, minimise or exploit this uncertainty earlier (e.g. at acquisition). Even within the same analysis stage, participants could choose to ignore uncertainty in one aspect of their data and try to minimise it for others. For in-stance, P7 who needed to send a marketing campaign based on a customer database having missing data: “Knowing where the person is based is primordial to the business [...]. The age and the postal address are the two subjects that interest us. For the rest, there is missing data but we don’t care.” (P7†).
Understanding Uncertainty: This category of strategies aims primarily to improve participants’ understanding as well as others awareness of uncertainty. It does not necessarily act
as an immediate step before minimising or exploiting uncer-tainty. Seven participants reported scenarios where they used nderstanding as their primary coping strategy for the uncer-tainty types they were dealing with (P1,2,7,8,9,10,12). Both application users and programmers deploy this strategy. Un-derstanding uncertainty might be an end in itself, rather than a means, for different reasons similar to those behind the ignore strategies, i.e. low priority at a particular stage of the analysis, or difficulty in taking the analysis further due to the intrinsic nature of uncertainty or technical limitations.
The understand strategies are important for bookkeeping, mon-itoring and communication purposes. Apart from acquire, all analysis processes feature in this category. However, un-certainty characterisation was the most frequently applied, including all three levels (ordered by frequency): annotate, compute and model. Annotate often involved adding free text or comments to describe participant’s confidence in the data or its quality, e.g. P10†: “there are things which are uncertain
[...] we created a column to put our comments [...] when we have comments, kind of a doubt about an application that is impacted, or a document, we try to put a comment.”. Charac-terise: involved computing summary statistics or algorithms to quality of quantify the uncertainty, e.g. P9†: “we have our
four positions and our 20 measurements per position, and so we will do classical things, like average, and standard deviation, or median before showing histograms, to have an idea of whether what we did are reproducible or not [... ] ”. Modelling involved using theory to formalise the uncertainty, e.g. P12†: “[...] there are fuzzy logic theories, probability and
evidence theory that will allow us to store these imprecisions and even to present them afterwards.”.
Unsurprisingly, participants who modelled data/uncertainty or computed a quality measure (P1,8,9,12) had higher tech-nical expertise, whereas annotations were added by both groups (P1,2,7,10,12). These processes appeared sometimes in chained pairs. More frequent however, was the reason-characterise sequence. We also had cases where participants used uncertainty characterisation tasks in a row, for instance computing the variability of data then writing notes about the confidence in the results. There are understand strategies for each uncertainty category except for bias. Coincidently, this is the least handled uncertainty category amongst our par-ticipants (together with inconsistency). Bias as a source of uncertainty, appears to be well understood by our participants (e.g. camera setting bias reported by P10 above) or well docu-mented by trusted parties who generated the data, e.g. P3 who receives a document explaining data provenance including transformations and known biases at data acquisition. Minimising Uncertainty: This is by far the most widely used strategy, with all participants deploying one or more
uncer-tainty minimisation processes at some point in their analysis. Processes used in this strategy are, in order of frequency: manipulate, characterise uncertainty, reason, and acquire. In-terestingly, the present process was not used for the aim of minimising uncertainty. The manipulate process applies to all uncertainty categories. Common data manipulation tasks include filtering of outliers, removal of (uncertain) data, correc-tions of known errors, data aggregation to reduce imprecisions, and data enrichments from algorithmic or external data sources. The characterise process, as part of a minimisation strategy, applies to all uncertainty categories with the exception of bias and imprecision. Typically participants used annotations to reduce ambiguity, e.g. P2†: “Uncertainty comes to mind
au-tomatically in my secondary sources. In my case, when I transcribe, my transcription becomes a secondary source [...] here I try to put a link to the digitised register [...] to reduce this uncertainty [referring to ambiguity in the identity of peo-ple, dates and places]”. Specifically for ambiguity, modelling, which can also be used as an understand strategy, is consid-ered a minimisation strategy as it addressed the problem of fuzzy object classification (P12). This process, however, was more often used in combination with other tasks, typically with an acquisition process when data is missing, in order to record provenance or confidence in the new data, e.g. P7†: “all
those who bought a train ticket without telling us their age, we estimate age, and then we put a low probability/confidence.”. In other cases, uncertainty characterisation was followed by a data manipulation process to filter noise and errors, or remove erroneous models. However, only half the participants stated that they removed uncertain data (P4,6,8,9,11,12). P7†noted:
“For each type of data [estimated values from tests] we add a new column [to the database]. We never remove data.”. The reason process affected six out of eight uncertainty sources and types and were mostly to compare and contrast different data sources and to validate with colleagues and other experts. Participants always followed this process with a data manipulation or uncertainty characterisation tasks. Finally, the acquire process affects primarily three types of uncertainty categories: missing data, error and variability. This process was sometimes followed by a characterisation task (often an-notation) or a data manipulation (e.g. data correction). Exploiting Uncertainty: In some cases, uncertainty was not considered as a burden, instead, it was viewed as a valuable source of information. Only P12 used this strategy for missing and imprecise data. This participant was technically skilled and familiar with formal theories to quantify and represent uncertainty. P12’s approach was to extract value from un-certainties in the data using inferences, model building and testing: “[...] For example, two objects that do not have an attribute, but the fact that there is no attribute gives me an information. May be that this object, [...], in our database, objects who are not important do not have attributes [...] so re-ally, the lack of information, could be a source of information. I exploited this like that.” (P12†).
Tacit Strategies
Besides the active strategies that participants articulated, there were overarching perceptions that appear to come from
ac-cepted domain practices. We call these, tacit strategies and loosely place them on a continuous uncertainty scale from attitudes considering uncertainty to be permanently present (P2,5,7), to the other extreme where relevant aspects of the analysis undertaken by the participant are regarded free of un-certainty (P3,4,9). P4, on the high unun-certainty end, considers uncertainty to be not pertinent to her task. Considering the overall context, this participant (a biologist) receives data that has been already cleaned to remove known biases and reduce variability. P2†, on the other end of the scale, a historian who
is confronted with uncertainty all the time: “in social history, uncertainty is present all the time.”, her general method in-volves making hypotheses and trusting authoritative sources (and conversely, being skeptical about less reliable ones). Some participants appear to be on or close to both ends of the scale. This can be attributed to the variety of uncertainty categories that data workers are confronted with at the same time, necessitating different practices. For instance, P7, a data officer, considers current automatic tools to handle missing postal addresses for their customers too error-prone, and there-fore a huge source of uncertainty. In the other direction, other attributes in their database are not sensitive (or important to the business) and thus their related uncertainties can be ignored. We observed that most participants take a nuanced, and less extreme, attitude towards uncertainty (seven participants), e.g. P1, a medical surgeon, takes a general accepting attitude since uncertainty is intrinsic to their domain, improvising when nec-essary as advanced planning is not always possible, combined with being explicit when communicating uncertainty to others.
Human and Technical Factors
The uncertainty coping strategies adopted by our participants involve both manual and automatic processes. It appears that expertise plays an important role in deciding what types and sources of uncertainty to ignore, and how to help understand, minimise or exploit them. For example, P1: “The 2-D tech-nique [for surgery planification] seems to be not accurate enough, [...] and in this case it is better to deal with an ex-perienced surgeon who may be able to find solutions at the time of surgery, to improvise something at the time of surgery”. With regards to manually judging the source and date of a
manuscript, P5†commented: “We know well if a manuscript
has an Italian writing, done in Rome, Venice or Naples”. More-over, data analysis workflows often involve multiple actors. For analysis under uncertainty, we observed a strong link be-tween our participants, data providers and facilitators. This was particularly true for validation processes, where some participants lacked specific expertise to evaluate the output of their analysis (e.g. P8), or direct access to primary data sources (e.g. P6). In such collaborative settings, human ex-pertise plays an important role in explaining, validating and communicating known uncertainties. However, coordination sometimes comes at a cost, e.g. P8†noted: “we cannot just
look at [our model/results] and say, this is OK. We have to ask, verify etc. This takes time.”.
Visualization tools were used by nine participants to support different tasks, e.g. P2 used Jigsaw [24] to explore entity rela-tionships; P7 used Tableau to communicate analysis findings to the marketing team, and P8 used open source tools to
visu-Ignore Understand Minimise Ambiguity
(11 participants) M: duplicate or removeambiguous object from
analysis; do nothing
(P2,4,5,6,11)
C: annotate, e.g. references and confidence; R:
evaluate source reliability or quality;R: make
a hypothesis ^ M: test (P1,2,8,10)
C: annotate to disambiguate; R: compare to other sources ^ M: enrich _ M: correct ; R: discuss with experts to decide on identity or class ^ C: annotate _ M: remove; C: compute a quality threshold ^ M: remove; C: model uncertainty (P2,5,6,7,8,9,12)
Inconsistency
(3 participants) (P12)M: propagate conflictR: compare to other sources; C: annotateprovenance of data and versioning (P2,10) M: data fusion ^ C: compute a quality threshold ^ R: create andapply rules for data fusion (P12)
Missing data
(8 participants) R: hypothesise (P6,7) C: compute data quality measures; C: modelmissingness (P1,8) A: new experiment; R: compare to related sources ^ M: data fusion;M: estimate or extrapolate; A: collect data ^ C: annotate confi-dence _ M: correct; R: infer from surrogate model ^ M: enrich (P1,2,3,5,6,7,8,12)
Bias
(3 participants) do nothing (P11) f M: apply statistical transformation, e.g. normalise; M: filter uncer-tain data (P3,4)
Variability
(6 participants) f C: compute variability ^ P: plot; R: interpret^ C: annotate (P7,9,12) A: take new measurements; C: identify a quality threshold ^ M: filter(P1,4,6,12)
Error
(8 participants) do nothing (P7) C: annotate to prevent data usage of erroneousrecords (P7) M: filter uncertain data; M: delete model that generates errors; A:improve acquisition source and tools;A: acquire data from multiple
sources;R: group discussions ^ M: manual correction; C: set task
constraints (P1,3,5,6,7,8,11,12)
Imprecision
(8 participants) do nothing (P5) C: model uncertainty ; C: annotate data qual-ity, confidence or possible range; R: com-pare to literature ^ C: set quality threshold (P1,2,9,12)
M: filter imprecise data; M: enrich with better quality data ^ A: improve acquisition ^ R: human expertise; M: aggregate data; R: prevent error propagation (P1,3,7,9,11,12)
Noise
(4 participants) f P: plot data with uncertainty (P9) R: discuss with experts to identify noise ^ M: remove noise; C:compute threshold level ^ M: remove noise (P4,6,9,11) Table 3. Data uncertainty coping strategies by high level goals: Ignore, Understand and Minimise (Exploit is not shown as it only applies to missing data & imprecision). Strategies can combine multiple processes and are exemplified using process_label:task notation, where process_label is A, M, C, R or P for Acquire, Manipulate, Characterise, Reason and Present. Symbol ^ denotes a chained process and _ an alternative process.
alise large metabolic networks for presentations and research publications. We note that some participants constructed their own visualizations, sometimes manually, such as P5 using post-it notes and highlighter pens (to show plagiarism patterns in a historical manuscript). Apart from P2 who did some ex-ploration, visualization was mostly used for presentation and communication purposes. However, a number of participants expressed their need for advanced visualization tools to better present, explore and exploit uncertainty information.
Relating The Various Aspects of Uncertainty Analysis
So far, we have identified categories of uncertainty and strate-gies used in analysis under uncertainty. Drawing upon these observations, we have proposed a five-block process model of how data workers analyse uncertain data in their own domains. In this section, we try to link these categories, processes, and strategies (Table 3). Our aim is not to find correlations, but to highlight some trends based on the intuition that the studied aspects of analysis are not independent.
What strategies are used for which categories of uncertainty? Our participants generally employed different coping strate-gies for different categories of uncertainty. For example, we only observed participants attempting to exploit uncertainty with missing or imprecise data. When confronted with ambigu-ity, participants tried to understand it more often than for any other category of uncertainty. For all other categories, partici-pants tried to minimise uncertainty more than they attempted to ignore, understand, or exploit it (in that order).
How do strategies relate to the identified processes?
There is also evidence in our data that participants used differ-ent analysis processes depending on their uncertainty coping strategies. No single strategy involves all of our analysis processes. The strategy that involves the most processes is understand (MCRP). Ignore (MR) and exploit (AR) involve only two processes each. Reason is employed by all types of
strategies, which indicates the importance of human-thinking and intervention in data analysis. We note that participants who tried to ignore uncertainty primarily used the manipulate process and, to a much lesser extent, the reason process. The understand strategy involves all processes except for acquire. It is also the strategy where the characterise process is used ex-tensively. The minimise strategy involves all processes except for present. Finally, exploiting uncertainty seems to primarily involve the reason and acquire processes.
Which processes operate on what categories of uncertainty? Looking at Table 3, it appears that variability is the only uncer-tainty category where all analysis processes are employed by our participants (AMCRP). Moreover, variability and noise are the only uncertainty categories that our participants tried to present. Missing data, error and imprecision are fairly com-mon types of uncertainty within our participants pool (eight participants each). For these categories, participants employed four processes (AMCR), but surprisingly, they never tried to present the uncertainty. Finally, ambiguity is the least anal-ysed category of uncertainty, with only three processes (MCR), albeit the most common uncertainty category (11 participants).
DISCUSSION
In this section, we compare the different aspects of our findings and results to prior work. Our study supports existing findings, in particular the idea that uncertainty is multifaceted [27, 26, 31, 3]. Our participants deal with a variety of sources and types of uncertainty related to the data, models, interfaces and cognition. What we contribute are new observations on how real-world data workers adopt one or more strategies aiming to ignore, understand, minimise or exploit these uncertainties. A subset of the uncertainty strategies we identified have been observed by other researchers who did similar studies. The two strategies mentioned by Schunn and Trafton’s [31] for the diagnosis and reduction of uncertainty, directly map to our understand and minimise strategies. Moreover, Skeel’s
et al. [32] strategies to ‘live with the uncertainty’and ‘try to become more certain’, correspond to our ignore and minimise strategies. Our exploit strategy, however, is a new addition to the list of existing strategies and highlights the potential of making useful inferences from imperfect data.
Pirolli and Card [28] provide a high-level model of human activity called the “Sense-Making Cycle” where the goal is to gain insights from data with regards to a given task. This model includes five main components: foraging for data, searching for a schema, instantiating a schema, problem solv-ing, and authorsolv-ing, deciding or acting. Processes from this model relate well to our components, for example, “foraging for data” maps to our acquire process and “solving a problem” refers to our data manipulation process. We also share the same interactive approach. However, such general models do not specifically focus on the analysis of uncertain data. Our framework is more specific to uncertainty analytics as it exposes the different notions of uncertainty through a “char-acterisation” process. We think our framework would enrich existing models with the observed evidence from our study.
DESIGN IMPLICATIONS AND FUTURE DIRECTIONS
We discuss design implications and future directions for uncertainty-aware analytics, promoting tools and studies that consider uncertainty at various stages of the sensemaking loop: 1. Support different uncertainty strategies and processes: Our study showed that data workers adopt different strate-gies depending on the uncertainty categories they are working with. As data workers often deal with many sources and types of uncertainty at the same time, there is need for tools that combine different types of uncertainty analysis and processes, whether aiming to ignore, understand, minimise or exploit the uncertainty. In particular, we highlight the need to develop tools that exploit uncertainty, making it an additional valuable source of information.
2. Capture and exploit analysts’ uncertainty: We found
that a great deal of uncertainty characterisation was manual. Data workers used domain knowledge to asses data quality, disambiguate objects and remove outliers or errors in their data. We join McEachren [25] and Kandel et al.’s [16] calls to create tools that capture and encode analysts’ annotations, par-ticularly with regards to uncertainty. Some of our participants already noted that there is no value in using an annotation tool if it does not provide the means to exploit annotations (P2†: “it
is interesting [referring to annotating uncertainty]. However, it should not just stay an annotation [...] because often this gets lost if we do not have a way to exploit it.”).
3. Support uncertainty propagation in an integrated reasoning process: In our study, participants did not always have ade-quate tools to handle the complexity of uncertain data analysis. They often used separate tools in different parts of the anal-ysis. Integrating the results of this conjoint processes, often manually, could in itself add uncertainty. We saw that passing provenance information from one step of the analysis to the next was rarely supported by existing tools. Tools that support uncertainty analysis should be integrated to the iterative pro-cess of sense-making, taking into account the different types, sources and levels of uncertainty (i.e. data, model, interface
and cognitive) and uncertainty propagation. In real world con-texts, where uncertainty has a high, often measurable, impact on decision making, the biggest challenge is to make sure that the analysis tools we build enable reasoning processes. 4. Support uncertainty-aware collaboration: Data workers rarely work in isolation. They are usually part of a team, co-located or remote. Their part of the analysis fits in a larger organisational context. They collaborate with other data work-ers, data providwork-ers, managwork-ers, and other parties. Each of them has a different role in the analysis workflow. Responsibilities are assigned with regards to processes, tasks and data. Such collaborations could help reduce uncertainty, but could also generate new ones due to compounded cognitive and relational factors. We envision uncertainty-aware data analysis tools that facilitate collaborative analysis of uncertain data by taking into account sources of uncertainty in the data as well as at the cognitive and relational levels.
5. Support decision makers through visualization: We saw a need for advanced visualization tools to better present, explore, and exploit uncertainty information, taking into account the various categories of uncertainty. More importantly, these visualizations need to support decision makers, e.g. P12†:
“[decision makers] are not used to [uncertainty visualization]. And it makes the interpretation task heavy-weight”.
6. Investigate the effect of tacit strategies on the analy-sis: Kahneman and Tversky [15] found that the perceived source or reason for uncertainty determines the selected coping strategy. In our study we observed some differences between participants who came from domains where uncertainty is the ‘norm’, and participants where uncertainty is more ‘con-trolled’using formal theory and modelling. More studies are needed to understand the effect of domain practices and user perceptions on the analysis of uncertain data.
Study Limitations
Our participants have different technical skill levels which may have had an impact on their behaviour and coping strate-gies. Moreover, our recruitment scheme may have introduced potential bias due to snowball and social network effects (e.g. 11 participants out of 12 were based in France).
CONCLUSION
This paper presented the results of interviews with 12 domain experts within commercial and academic organisations. For our participants, data analysis was not their primary job. We presented findings that characterise how this type of “ana-lysts”, we coined data workers, explore uncertain data. Our participants had to deal with heterogeneous uncertainty cat-egories operating at the data, model, interface and cognitive levels. They deployed four uncertainty management strategies: ignore, understand, minimise and exploit, at various stages of the analysis. Our study allowed to identify five key high level tasks which were the building blocks of a process model for uncertainty-aware data analysis. Finally, we proposed future directions for further research.
ACKNOWLEDGEMENTS
This work was funded in part by Digitéo and the French Na-tional Research Agency (ANR).
REFERENCES
1. Robert Amar and John Stasko. 2004. A Knowledge Task-Based Framework for Design and Evaluation of Information Visualizations. In Proceedings of the IEEE Symposium on Information Visualization (INFOVIS ’04). IEEE Computer Society, Washington, DC, USA, 143–150. DOI:
http://dx.doi.org/10.1109/INFOVIS.2004.10
2. Jacques Bertin. 1981. Graphics and Graphic Information Processing, Berlin, Walter de Gruyter, being a translation of Bertin, J. La Graphique et le Traitement Graphique de l’information, Paris, 1977. Flammarion.
3. Georges-Pierre Bonneau, Hans-Christian Hege, Chris R. Johnson, Manuel M. Oliveira, Kristin Potter, Penny Rheingans, and Thomas Schultz. 2014. Scientific Visualization: Uncertainty, Multifield, Biomedical, and Scalable Visualization. Springer London, London, Chapter Overview and State-of-the-Art of Uncertainty Visualization, 3–27. DOI:
http://dx.doi.org/10.1007/978-1-4471-6497-5_1
4. Nadia Boukhelifa, Anastasia Bezerianos, Tobias Isenberg, and Jean-Daniel Fekete. 2012. Evaluating Sketchiness as a Visual Variable for the Depiction of Qualitative Uncertainty. IEEE Transactions on Visualization and Computer Graphics 18, 12 (December 2012), 2769–2778. 5. Kathy Charmaz. 2006. Constructing Grounded Theory: A
Practical Guide through Qualitative Analysis. Sage, Thousand Oaks, CA.
6. C. D. Correa, Y. H. Chan, and K. L. Ma. 2009. A framework for uncertainty-aware visual analytics. In Visual Analytics Science and Technology, 2009. VAST 2009. IEEE Symposium on. 51–58. DOI:
http://dx.doi.org/10.1109/VAST.2009.5332611
7. Nahum D. Gershon. 1998. Visualization of an Imperfect world. IEEE Computer Graphics and Applications 18, 4 (1998), 43–45.
8. Nitesh Goyal, Gilly Leshed, Dan Cosley, and Susan R. Fussell. 2014. Effects of Implicit Sharing in Collaborative Analysis. In Proceedings of the SIGCHI Conference on Human Factors in Computing Systems (CHI ’14). ACM, New York, NY, USA, 129–138. DOI:
http://dx.doi.org/10.1145/2556288.2557229
9. Garrett Grolemund and Hadley Wickham. 2014. A Cognitive Interpretation of Data Analysis. International Statistical Review 82, 2 (2014), 184–204. DOI:
http://dx.doi.org/10.1111/insr.12028
10. Gunnar Harboe and Elaine M. Huang. 2015. Real-World Affinity Diagramming Practices: Bridging the
Paper-Digital Gap. In Proceedings of the 33rd Annual ACM Conference on Human Factors in Computing Systems (CHI ’15). ACM, New York, NY, USA, 95–104.
DOI:http://dx.doi.org/10.1145/2702123.2702561
11. Geoffrey Hill, Pratim Datta, and William Acar. 2015. Shifting Perspectives: A Process Model for Sense
Making Under Uncertainty. Int. J. Strateg. Decis. Sci. 6, 1 (Jan. 2015), 33–52. DOI:
http://dx.doi.org/10.4018/ijsds.2015010103
12. Jessica Hullman, Paul Resnick, and Eytan Adar. 2015. Hypothetical Outcome Plots Outperform Error Bars and Violin Plots for Inferences about Reliability of Variable Ordering. PLoS ONE 10, 11 (16 Nov. 2015). DOI:
http://dx.doi.org/10.1371/journal.pone.0142444
13. Samuel Huron, Yvonne Jansen, and Sheelagh Carpendale. 2014. Constructing Visual Representations: Investigating the Use of Tangible Tokens. IEEE Transactions on Visualization and Computer Graphics 20, 12 (Aug. 2014), 1. DOI:http://dx.doi.org/10.1109/TVCG.2014.2346292
14. Petra Isenberg, Anthony Tang, and Sheelagh Carpendale. 2008. An Exploratory Study of Visual Information Analysis. In Proceedings of the SIGCHI Conference on Human Factors in Computing Systems (CHI ’08). ACM, New York, NY, USA, 1217–1226. DOI:
http://dx.doi.org/10.1145/1357054.1357245
15. Daniel Kahneman and Amos Tversky. 1982. variants of uncertainty. cognition 11, 2 (1982), 143–157.
16. Sean Kandel, Andreas Paepcke, Joseph Hellerstein, and Jeffrey Heer. 2012. Enterprise Data Analysis and Visualization: An Interview Study. In IEEE Visual Analytics Science & Technology (VAST).http://vis. stanford.edu/papers/enterprise-analysis-interviews
17. Matthew Kay, Tara Kola, Jessica R. Hullman, and Sean A. Munson. 2016. When (Ish) is My Bus?: User-centered Visualizations of Uncertainty in Everyday, Mobile Predictive Systems. In Proceedings of the 2016 CHI Conference on Human Factors in Computing Systems (CHI ’16). ACM, New York, NY, USA, 5092–5103. DOI:
http://dx.doi.org/10.1145/2858036.2858558
18. Christoph Kinkeldey, Alan M. MacEachren, Maria Riveiro, and Jochen Schiewe. 2015. Evaluating the effect of visually represented geodata uncertainty on
decision-making: systematic review, lessons learned, and recommendations. Cartography and Geographic Information Science (2015), 1–21. DOI:
http://dx.doi.org/10.1080/15230406.2015.1089792
19. C. Kinkeldey, Alan M. MacEachren, and J. Schiewe. 2014. How to Assess Visual Communication of Uncertainty? A Systematic Review of Geospatial Uncertainty Visualization User Studies. Cartographic
Journal 51 (2014), 372–386.http://www.maneyonline.
com/doi/pdfplus/10.1179/1743277414Y.0000000099
20. G. Klein, B. Moon, and R. R. Hoffman. 2006. Making Sense of Sensemaking 2: A Macrocognitive Model. IEEE Intelligent Systems 21, 5 (Sept 2006), 88–92. DOI:
http://dx.doi.org/10.1109/MIS.2006.100
21. G. Klein, J. K. Phillips, E. L. Rall, and D. A. Peluso. 2003. A Data/Frame Theory of Sense Making". In Expertise out of context: proceedings of the sixth International Conference on Naturalistic Decision Making. 113–155.
22. George J. Klir and Bo Yuan. 1995. Fuzzy Sets and Fuzzy Logic: Theory and Applications. Prentice-Hall, Inc., Upper Saddle River, NJ, USA.
23. Raanan Lipshitz and Orna Strauss. 1997. Coping with Uncertainty: A Naturalistic Decision-Making Analysis. Organizational Behavior and Human Decision Processes 69, 2 (1997), 149 – 163. DOI:
http://dx.doi.org/10.1006/obhd.1997.2679
24. Zhicheng Liu and John T. Stasko. 2010. Mental Models, Visual Reasoning and Interaction in Information
Visualization: A Top-down Perspective. IEEE Trans. Vis. Comput. Graph. 16, 6 (2010), 999–1008.
25. Alan M. MacEachren. 2015. Visual Analytics and Uncertainty: Its Not About the Data. In EuroVis Workshop on Visual Analytics (EuroVA), E. Bertini and J. C. Roberts (Eds.). The Eurographics Association. DOI:
http://dx.doi.org/10.2312/eurova.20151104
26. Alan M. MacEachren, Anthony Robinson, Steven Gardner, Robert Murray, Mark Gahegan, and Elisabeth Hetzler. 2005. Visualizing geospatial information uncertainty: What we know and what we need to know. Cartography and Geographic. Information Science 32 (2005), 160.
27. Alex Pang, Craig Wittenbrink, and Suresh Lodha. 1997. Approaches to Uncertainty Visualization. The Visual Computer 13, 8 (Nov 1997), 370–390.
28. Peter Pirolli and Stuart Card. 2005. The sensemaking process and leverage points for analyst technology as identified through cognitive task analysis. (2005), 2–4.
https://analysis.mitre.org/proceedings/Final_Papers_ Files/206_Camera_Ready_Paper.pdf
29. P. Samuel Quinan, Lace M. Padilla, Sarah H. Creem-Regehr, and Miriah Meyer. 2015. Towards Ecological Validity in Evaluating Uncertainty. In Proceedings of Workshop on Visualization for Decision
Making Under Uncertainty (VIS ’15).http://vdl.sci.
utah.edu/publications/2015_vdmu_ecological-validity/
30. Dominik Sacha, Hansi Senaratne, Bum Chul Kwon, Geoffrey Ellis, and Daniel A. Keim. 2016. The Role of Uncertainty, Awareness, and Trust in Visual Analytics. IEEE Transactions on Visualization and Computer Graphics (Proceedings of the Visual Analytics Science and Technology) 22, 01 (Jan. 2016), 240–249. DOI:
http://dx.doi.org/10.1109/TVCG.2015.2467591
31. Christian D. Schunn and J. Gregory Trafton. 2012. Handbook of the Psychology of Science. Springer-Verlag, Chapter The Psychology of Uncertainty in Scientific Data Analysis.
32. Meredith Skeels, Bongshin Lee, and George Robertson Greg Smith. 2010. Revealing Uncertainty for Information Visualization. Information Visualization 9, 1 (2010), 70–81.
33. John T. Stasko, Carsten Görg, and Zhicheng Liu. 2008. Jigsaw: supporting investigative analysis through
interactive visualization. Information Visualization 7, 2 (2008), 118–132. DOI:
http://dx.doi.org/10.1057/palgrave.ivs.9500180
34. Jo Wood, Petra Isenberg, Tobias Isenberg, Jason Dykes, Nadia Boukhelifa, and Aidan Slingsby. 2012. Sketchy Rendering for Information Visualization. IEEE
Transactions on Visualization and Computer Graphics 18, 12 (2012), 2749–2758. DOI:
http://dx.doi.org/10.1109/TVCG.2012.262
35. Pawel Wozniak, Nitesh Goyal, Przemyslaw Kucharski, Lars Lischke, Sven Mayer, and Morten Fjeld. 2016. RAMPARTS: Supporting Sensemaking with
Spatially-Aware Mobile Interactions. In Proceedings of the 2016 CHI Conference on Human Factors in Computing Systems (CHI ’16). ACM, New York, NY, USA, 2447–2460. DOI: