_____________________________________________________________________________________________________ *Corresponding author: E-mail: rpposse@gmail.com;
(Past name:American Journal of Experimental Agriculture,Past ISSN: 2231-0606)
Basal Temperature and Thermal Constant for the
Production of Cacao Tree Seedlings
Robson Prucoli Posse
1*, Francielly Valani
1, Carlos Alberto Spaggiari Souza
2,
Sheila Cristina Prucoli Posse
3, Ramom Amaro de Sales
4,
Evandro Chaves de Oliveira
1, Waylson Zancanella Quartezani
5and Marta Cristina Teixeira Leite
11
Federal Institute of Espírito Santo – Campus Itapina, Highway BR-259, Km 70, Countryside, Post Office Box 256, CEP: 29709-910, Colatina, Espírito Santo, Brazil. 2
Cacao Research Station “Filogônio Peixoto” - CEPLAC, Highway BR 101 N, Km 150, CEP: 29900-000, Linhares, Espírito Santo, Brazil. 3Instituto Capixaba de Pesquisa, Assistência Técnica e Extensão Rural – INCAPER, Street Afonso Sarlo, 160, CEP: 29052-010, Vitória, Espírito Santo, Brazil. 4
Center for Agrarian Sciences and Engineering – Federal University of Espírito Santo, Alto Universitário Street, S/No, Guararema, CEP: 29500-000, Alegre, Espírito Santo, Brazil. 5Federal Institute of Espírito Santo – Campus Montanha, Highway ES 130, Km 01, CEP: 29890-000,
Montanha, Espírito Santo, Brazil.
Authors’ contributions
This work was carried out in collaboration between all authors. Author RPP designed the study, conducted the experiment in the field with authors FV and RAS managed the writing of the manuscript. Authors RPP, CASS, SCPP, ECO and WZQ managed the analyses of study. Author RPP performed the statistical analysis. Authors MCTL and RPP performed translation of the manuscript. All authors read and approved the final manuscript.
Article Information
DOI: 10.9734/JEAI/2018/43321 Editor(s): (1)Slawomir Borek, Professor, Department of Plant Physiology, Adam Mickiewicz University, Poland.
Reviewers: (1)Shadrack Kinyua Inoti, Egerton University, Kenya. (2)Mehmet Serhat Odabas, University of Ondokuzmayis, Turkey. (3)Francesca Ugolini, National Research Council of Italy, Italy. Complete Peer review History:http://www.sciencedomain.org/review-history/25867
Received 5th June 2018 Accepted 9th August 2018 Published 13th August 2018 Original Research Article
ABSTRACT
The temperature is one of the climatic factors of greater importance in the physiological processes of the plants, being directly related to its growth and development, which need a thermal accumulation to complete its phenological cycles. The objective of this work was to evaluate the contribution of temperature to cacao tree seedlings (genotype TSH1188) development, thus determining its lower basal (Tb) and upper (TB) temperature as well as the thermal sum in degree-day (DD) required for its production with quality. The study was carried out in the Horticulture sector of the Federal Institute of Espirito Santo - Campus Itapina, Colatina/ES, conducted under a completely randomized design in three planting seasons with different climatic conditions. For the estimation of Tb, four different estimation methods were used: standard deviation in degree-day (SDdd), the standard deviation in days (SDd), the coefficient of variation in degree-day (CVdd) and relative development (RD). The upper basal temperature (TB) was estimated similarly to Tb, with the exception of the RD method. The basal temperatures (Tb and TB) were estimated by means of the average values obtained in the methods used and the thermal sum, obtained in each planting season, using the mean Tb value, from the emergence of the seedlings, by the sum of the degree-days. The estimated values of lower and upper basal temperature were respectively 10°C and 37°C and the mean thermal sum for a quality cacao tree seedling production is 1018°C. In order to obtain a production of quality cacao tree seedlings in different climatic conditions, it is possible to evaluate the development of the variables height, stem diameter and number of leaves of the cacao tree seedlings as a function of accumulated degrees. The time required for the production of cacao tree seedlings varies according to the season of the year. Cacao tree seedlings conducted in periods with higher temperatures took less time to form with quality.
Keywords: Theobroma cacao L.; degree-days; vegetative development; heat units; genotype TSH1188; phenology.
1. INTRODUCTION
The genus Theobroma, belonging to the family Malvaceae, which is made up of 22 species, has the greatest economic relevance in the cacao tree (Theobroma cacao L.). From its centre of origin, including the region of the Alto Amazonas and Alto Orinoco basins, the first reference of cacao tree cultivation in Brazil was in 1677. With natural habitat under the canopy of the forests, the crop is strongly influenced by climatic factors, which stand out the temperature and the precipitation [1].
The main commercial product of cacao tree is the seed, already fermented and dried, for the production of chocolate, but also the butter and pulp, used in the manufacture of cosmetics, jellies, juice, wine, among others [2].
Brazil was once one of the largest cacao producers in the world, but it showed a marked drop in production due to the appearance of the Witch's Broom disease, caused by the fungus
Moniliophthora perniciosa, whose name in the
old nomenclature was Crinipellis perniciosa [3]. According to IBGE data, in the 2017 harvest in a total planted area of 696,319 hectares, 214,348 tons of dried cacao seeds were produced in Brazil, of these 116,536 tons in Pará, 83,869
tons in the state of Bahia and 6,700 tons in the Espirito Santo [4].
One of the cultivars resistant to the fungus
Moniliophthora perniciosa is TSH1188, from the
island of Trinity. It presents an adaptation to regions of humid tropical climate, with
self-incompatible pollination, red fruits when
immature, moderately rough, with medium deep grooves, with an elongated shape, and average productivity of 1.453 kg per plant [5].
Plant metabolism is affected by solar radiation, the primary source of energy for photosynthesis, and by temperature, which alters the speed of chemical reactions and activity of the enzymes involved in the process [6]. During the growth phase of a plant almost all of the organic compounds produced, about 95% of its dry matter, comes from the fixation of atmospheric
carbon through photosynthesis [7]. In
photosynthesis the reduction of carbon dioxide occurs slowly in low temperatures, it gradually increases with increasing temperature, until it reaches the apex of velocity when reaching a temperature considered optimal, temperatures above this promotes a considerable reduction of carboxylation of Ribulose-1,5-Biphosphate and reduction of photosynthetic yield in favour of
optimum temperature ranges have a higher quantum yield, by not having their physiology significantly compromised due to temperature variations [6].
Oliari et al. [6], studying the restriction of sunlight and temperature increase in the growth of radishes showed that, at higher temperatures, there was a significant increase of dry matter, considering that the higher temperature could have caused an increase in the photosynthetic activity, since the temperatures during the experiment did not exceed the optimum range considered for the crop.
Within the climatic factors, the temperature has a great value in the physiological processes of the plants, being not different for the cacao tree, acting in the development cycle and harvest
season, influencing the growth and the
development because it is linked directly to the evapotranspiration processes and metabolic reactions [10].
For the phenological development of the plants it is necessary to accumulate degree-day (°C day), also known as thermal sum, which consists of the thermal accumulation comprised between the lower basal temperature (Tb), minimum energy value that activates the metabolic mechanisms, and upper basal temperature (TB), a value that promotes stagnation of metabolic activities and impairs development. Both values (Tb and TB) are suitable for each genotype at each stage of its cycle [10,11].
The determination of the duration of the phenological cycle of a plant using accumulated degree-day is important and advantageous because it is related to the meteorological conditions and not to the chronological time (days, months) that can undergo climatic changes for a same period of time. In this way, the thermal sum can be used to optimize the management strategies, in the planning of the activities, an an indication of the climatic potential of the region capable of generating the best production [10].
Very low or, on the contrary, very high temperatures, promote damages in both growth and development and production. Normally, the various studies of basal temperatures only emphasize the calculation and determination of the lower basal temperature, due to the fact that they are conducted in regions where the upper basal temperature is generally not reached, but this is contrary to the reality observed in regions
of tropical climates, thus also showing its relevance [12].
Due to the scarcity of studies and researches on the influence of temperature on the cacao tree crop and aiming to contribute to a better understanding of the factors involved in plant-environment interaction, the present study aimed to determine the minimum (Tb) and maximum (TB) temperature and the thermal sum in degree-days (DD) required for the production of quality seedlings of the cacao tree genotype TSH1188. 2. MATERIALS AND METHODS
The study was developed in the horticulture sector of the Federal Institute of Espírito Santo - Itapina Campus, located in the municipality of Colatina, Espírito Santo state (19°29' S, 40°45' W; 62 m altitude), Brazil. The climate of the region is Tropical Aw, according to the Köppen classification [13]. The region is characterized by the irregularity of the rains and the occurrence of high temperatures.
The experiment was carried out with cacao tree seedlings (Theobroma cacao L.), genotype TSH1188, in three different planting seasons, according to the seasons of the year for the Southern Hemisphere. The first planting was carried out in the period from 03/16/2017 to 05/12/2017 (Autumn), the second planting from 08/01/2017 to 10/06/2017 (Winter) and the third planting from 10/20/2017 to 15/12/2017 (Spring). The three plantations were carried out in an agricultural greenhouse with linear dimensions of 25 m x 5 m and 3 m height, with transparent plastic film and polypropylene mesh black with 50% shading.
Inside the greenhouse, seedlings were kept in an individualized environment, 2.20 m long and 1.10 m wide, where six NaanDanJain® GREEN MIST brand anti-mist nebulizers were installed one meter above the seedlings and spaced between at 0.8 m, with a watering frequency controlled individually by electronic controllers and by a centrifugal pump of 0.5 hp, which operated by frequent pulses distributed for 10 h per day, at a
working pressure of 2.0 kgf.cm-2, in order to
apply irrigation water depth 8 mm day-1.
For the production of TSH1188 cacao
tree seedlings, a completely randomized
experimental design (DIC) was used, consisting of 36 useful plants per treatment in the 1st planting and 20 useful plants per treatment in the 2nd and 3rd planting. The seedlings were
produced in tubes with a diameter of 53 mm, 190 mm in height and 280 ml of volumetric capacity. The tubes were kept in supports with capacity for 54 cells, however, they were distributed in alternating cells in the support so as not to limit the arrival of light in the seedlings, according to the growth, which could cause estiolation of the seedlings. All tubes were prewashed and sterilized with 2% sodium hypochlorite diluted in water. The tubules were filled with Tropstrato HT Vegetable substrate plus Osmocote Plus 15-9-12
(3M), at the dosage of 3 g tube-1, which had the
following chemical composition: N = 15%, (7%
ammoniacal and 8% nitrate), P2O5 = 9%, K2O =
12%, Mg = 1.3%, S = 5.9%, Cu = 0.05%, Fe = 0.46%, Mn = 0.06% and Mo = 0.02%. No additional fertilization was done.
The TSH1188 (Theobroma cacao L.) cacao tree seeds were obtained from the Experiment Station "Filogônio Peixoto" - belonging to CEPLAC, in Linhares County, Espírito Santo state, Brazil. The mature fruits were sectioned horizontally and the seeds were removed for extraction of the mucilage, which was removed by friction in sawdust powder. After extraction, the seeds were planted, one per tube, to a depth of approximately 2 cm.
Variations in temperature and relative humidity
within the greenhouse were monitored
throughout the seedling production period by a WatchDog® Model 200 Data Logger. Externally, the climatic variations were recorded by an ONSET® weather station, installed near the
experiment, and estimated the reference
evapotranspiration (ETo) by the Penman-Monteith method FAO-56 standard [14], Equation 01.
= . ∆( − ) + + ( − ) ∆ + ( + . ) (1)
where ETo is the daily reference
evapotranspiration (mm.d-1); Rn is the daily
radiation balance (MJ.m-2.d-1); G is the daily flow
of heat in the soil (MJ.m-2.d-1); T is the average
daily air temperature (ºC); u2 is the average daily
wind velocity at 2 m in height (m.s-1); es is the
saturation pressure of the daily mean water
vapor (kPa); ea is the daily mean water vapor
pressure (kPa); Δ is the slope of the vapor
pressure curve at the point of T (kPa.ºC-1) and γ
is the psychrometric coefficient (kPa.ºC-1).
Seedlings began to be evaluated when the hypocotyl emerged on the substrate in the shape
of a hook (emergence finding) in more than 70% of plants, thus recording the following dates as the day after emergence (DAE). The emergence of the hypocotyl from the 1st planting was recorded on 03/22/2017 (six days after seeding), from the 2nd planting on 08/04/2017 (three days after seeding) and from the 3rd planting on 10/28/2017 (eight days after seeding).
At the end of each planting, the seedlings were
evaluated for the following morphological
characteristics: a) shoot height (SH), measured in cm, using a ruler graduated in millimeters, from the stem base until the apical gem; b) stem diameter (SD), measured at 2 cm above the edge of the tube, in mm, with a digital meter of the brand Metrotools, model MPD-150; c) root length (RL), measured in cm, with ruler graduated in millimeters, from the base of the stem to the largest root length; d) fresh mass of shoot system (FMSS) and the fresh mass of the root system (FMRS), expressed in grams, determined by weighing them after cutting at the base of the stem, through an electronic scale with an accuracy of 0.001 g; e) dry mass of the shoot system (DMSS), root system (DMRS) and total dry mass (TDM), obtained by the sum of DMSS and DMRS expressed in grams, by weighing them in an electronic scale with 0.001 g of precision after being separately packed in paper bags and subjected to a drying process in an oven with forced air circulation at 65ºC until constant weight; f) number of leaves (NL), determined by counting the total number of leaves per plant; g) leaf area (LA), expressed in cm2, estimated with LI-COR leaf area meter model LI-3100C.
With the data obtained, the quality of the seedlings was determined by analyzing: a) the relationship between shoot height and stem diameter (RSHSD); b) relationship between dry mass of the shoot system and dry mass root system (RDMSR); c) Dickson quality index (DQI), by the formula: DQI = [TDM / (RSHSD + RDMSR)] [15].
For the estimation of the lower basal temperature (Tb) for the cacao tree seedlings, it was necessary to first calculate the degree-days (DD, ºC day), by Equation 2 [16]:
= + − (2)
where: DDi is the degree-day (ºC day), TM is the
daily maximum air temperature (ºC), Tm is the minimum daily air temperature (ºC) and Tb is the
lower basal temperature of the cultivar. For the calculation of the DD a series of Tb ranging from 5 to 15ºC was used, in intervals of 0.5ºC.
The accumulated degree-day or thermal sum (DD, ºC) were obtained in each of the evaluated seasons, from the emergence of the seedlings, by the sum of the DDi (Equation 3):
= (3)
The methodologies proposed by Arnold [17] and Yang et al. [18] were used to estimate the Tb of the cacao tree seedlings through four methods: standard deviation in degree-day (SDdd), standard deviation in days (SDd), coefficient of variation in degree-day (CVdd) and relative development (RD).
The SDdd method considers the Tb of each cultivar to be the one that results in the lowest standard deviation in degree-day, using different planting times, according to Equation 4 [18]:
= ∑ ( − )
− ( 4)
on what SDdd = standard deviation in
degree-day; DDi = degree-day accumulated in the i-th
planting season using a series of Tb; ADD = average of degree-day accumulated for all i-th planting times; n = number of planting times. The method of standard deviation in days (SDd), considers that the Tb of the cultivar is the one that presents a smaller standard deviation in days between the different times of planting. In this way, Tb candidates, identical to those of the previous method (SDdd), according to Equation 5 [17], were previously selected:
=
x
− (5)Where; SDd = standard deviation in days; SDdd = standard deviation in degree-day using a
series of Tb;
x
= mean air temperature of all iseasons (ºC); Tb = lower basal temperature (ºC). The coefficient of variation in degree-day (CVdd) is the relationship between SDdd and average of degree-day accumulated of all plantations (ADD) and considers the value of Tb as the one with the lowest coefficient of variation with respect to the degree-day necessary to reach a certain stage of development, according to Equation 6, adapted by Yang et al. [18]:
= (6)
Where; SDdd = standard deviation in degree-day using a series of Tb; Tb = lower basal temperature (ºC); ADD - an average of day-degree accumulated for all i-th planting seasons. The relative development (RD) method is based on the linear relationship between the mean air temperature (Tmean) during the development phase under study of each planting season and the RD values of the species/cultivar, using Equation 7 [19]:
RD = a . Tmean + b , where RD = (7) where: a = the coefficient of linear regression; Tmean = average air temperature (ºC); b = linear coefficient; 100 = arbitrary weighting value; N = number of days of duration of the development phase in each planting season.
By the relative development (RD) method, Tb is the value that results in a zero relative development resulting from the prolongation of simple linear regression between the RD of the cultivar as a function of the Tmean, that is, Tb = -b/a [19].
The upper basal temperature (TB) was estimated in a manner similar to Tb, using the methods of standard deviation in degree-day (SDdd), standard deviation in days (SDd) and coefficient of variation in degree-day (CVdd) being considered the TB, when this presented lower value of standard deviation and coefficient of variation. For this estimation, temperatures with a variation of 1 in 1ºC were used, at intervals ranging from 25 to 38ºC. The characterization of the thermal requirements of cacao tree was made using the methodology proposed by Ometto [11], whose variations are presented below: Case 1: TB > TM > Tm > Tb =( − )+ ( − ) (8) Case 2: TB > TM > Tb ≥ Tm = ( − ) . ( − ) (9) Case 3: TB > Tb > TM > Tm = (10)
Case 4: TM > TB > Tm > Tb = . [( − ). ( − )] + ( − ) − ( − ) . ( − ) (11) Case 5: TM > TB > Tb > Tm = . ( − ) − ( − ) ( − ) (12)
where: DDi = degree-day of day i (ºC); TM =
maximum temperature of the day; Tm = minimum temperature of the day; Tb = lower
basal temperature; TB = upper basal
temperature.
Due to the difference between the Tb and TB estimation values as a function of the methods, the final value of Tb and TB for cacao tree seedlings production was obtained by the arithmetic mean of the Tb and TB values found by the methods, with the mean Tb, later used for the thermal sum (DD).
The shoot height (SH) and the stem diameter (SD) were related to the thermal sum (DD), according to Equation 13:
= + . − ( . ) (13)
Where, Y = shoot height (cm) or stem diameter (mm) of the seedling; DD = cumulative degree-day (ºC); a, b and c = coefficients of the equation, which biologically explains the pattern of growth response and/or development of the cacao tree seedlings.
The growth rate (GR) of height and diameter were obtained by deriving Equation 13 in relation to DD, obtaining the following Equation 14:
= = . . ( . ) (14)
We used Excel and the open source program R [20] for data organization and manipulation.
3. RESULTS AND DISCUSSION
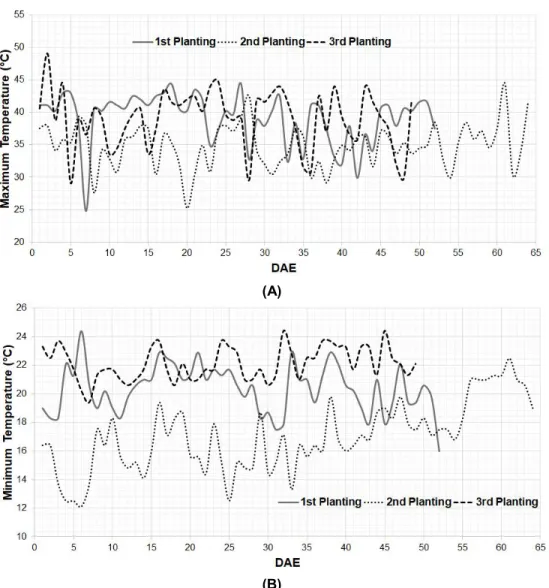
The production of cacao tree seedlings at different weather seasons provided distinct developments (Table 1), which were important for estimating the lower basal (Tb), upper (TB) temperature and the thermal sum (DD) needed to form a good quality cacao tree seedling. The mean maximum and minimum temperatures of all seasons evaluated during the experiment, were 37.67 ºC and 19.82 ºC, respectively. The highest maximum temperature found was 49.1ºC (10/29/2017), recorded on the 2nd day after emergence (DAE) of the 3rd planting, and the lowest recorded minimum temperature was 12.1 ºC (08/09/2017), in the 6th DAE of the second planting (Fig. 1).
The different climatic conditions in the three planting seasons influenced the duration of the development cycle of the cacao tree in DAE, demonstrating a tendency to decrease the duration of the production cycle of the seedlings with the increase of the average air temperature (Table 1). The same trend was observed in other crops such as olive [21], triticale [22] and for canola [23].
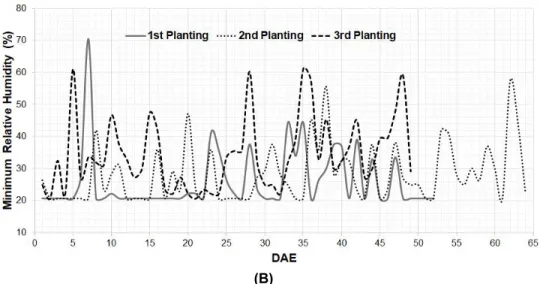
The maximum and minimum relative humidity within the greenhouse for the three planting seasons of the cacao tree during the whole seedling production cycle, days after emergence (DAE) can be observed in Figure 2. The average
relative humidity of the air, inside the
greenhouse, for the three planting seasons, was 56.38%; 57.61% and 60.13% for the 1st, 2nd and 3rd plantings, respectively. The mean maximum and minimum relative humidity, respectively, recorded for the first planting was 86.74% and 26.01%; for the second planting of 87.02% and 28.20% and the third planting of 85.80% and 34.46%.
Table 1. Duration of the cycle, in days after emergence (DAE), mean temperatures, mean of the maximum and minimum values (in ºC), in the agricultural greenhouse, in the production of the
cacao tree seedlings, at the different growing seasons in Colatina/ES, 2017
Season DAE Air temperature (ºC)
Mean Mean maximum Mean minimum
1st Planting (Autumn) 52 29.74 39.12 20.36
2nd Planting (Winter) 64 25.90 34.82 16.97
(A)
(B)
Fig. 1. Maximum (A) and minimum temperature (B), inside the greenhouse, in the production of cacao tree seedlings, in the different growing seasons in Colatina/ES, 2017
(B)
Fig. 2. Maximum (A) and minimum relative humidity (B), inside the greenhouse, in the production of cacao tree seedlings, in the different growing seasons in Colatina/ES, 2017 The average reference evapotranspiration (ETo),
recorded in the external environment, on days
after emergence (DAE), for the 1st, 2nd and 3rd
plantings, respectively, was 3.90 mm.d-1; 2.91
mm.d-1 and 3.37 mm.d-1. As can be observed in
Fig. 3, the maximum value of ETo registered for
the first planting was 5.85 mm.d-1 (03/26/2017;
5th DAE), in the second planting was 4.32 mm.d
-1 (10/06/2017; 64th DAE) and on the 3rd
planting was 6.63 mm.d-1 (11/28/2017; 32nd
DAE), clearly demonstrating the influence of the different climatic conditions on the duration of the cycle for the production of cacao tree seedlings (Table 1).
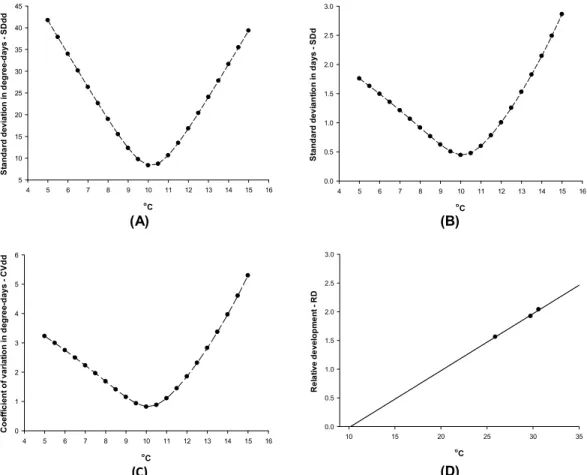
The lower basal temperature values (Tb) for the four methods under study (Figure 4) were similar for each other for the cultivars of cacao tree cultivar TSH1188. The methods of standard deviation in degree-day (SDdd), the standard deviation in days (SDd) and coefficient of variation in degree-day (CVdd) presented Tb value equal to 10,0ºC. Only the relative development method (RD) showed a Tb value of 10.18ºC. However, it is possible to observe that the RD method presented an excellent linear relationship between the development rate and the mean air temperature, with a coefficient of
determination (R2) equal to 0.99, being
Fig. 3. Daily values of reference evapotranspiration (ETo) occurring in the external environment, for each growing season, throughout the production of cacao tree seedlings in
considered an excellent method to estimate Tb, as also observed by Müller et al. [19].
The Tb value for the vegetative development of the cacao tree cultivar TSH1188, represented by the seedling phase, was considered 10.0ºC, this value being the arithmetic mean among the four evaluated methods for Tb estimation. Similar procedures for estimating Tb values as a function of the different methods were also observed by Barbano et al. [24], Lago et al. [25], Fagundes et al. [26] and Souza and Martins [21].
The lower basal temperature (Tb = 10ºC) found in this work, for the seedling phase, corroborates the results of Souza et al. [27], where they state that the ideal average temperatures for the good development and production of cacao tree are 25ºC ± 4.5ºC, conditions that are only found in typically tropical regions, and that the absolute minimum temperature should not be less than
10°C, with mean minimum temperatures in the coldest month above 15.5°C, due to the inhibition of the formation of floral buds at very low temperatures, which is why it is not common to verify cacao tree flowering in the June, July and August at Espirito Santo state.
The Tb of the plants presents a difference between species, and between cultivars within the same species, and may also vary according to the stage of development of the crop [28,29]. The estimated value of Tb in this study (10.0ºC) for the vegetative development of cacao tree TSH1188, represented by the seedling phase, was close to the values found for the vegetative development of both perennial crops such as
Eucalyptus grandis (10.0ºC) [30] and olive (9.6ºC for cultivar Grappolo) [21], as well as for
some annual crops such as canola hybrids (9.9 and 10.0ºC) [23] and red rice biotypes (9.9 and 10.5ºC) [25].
(A) (B)
(C) (D)
Fig. 4. Standard deviation in degree-days – SDdd (A); standard deviation in days – SDd (B) e coefficient of variation in degree-days– CVdd (C) and relative development method – RD (D) for
estimates of the minimum basal temperature (Tb) of cacao tree TSH1188 in the production period of the seedlings – Colatina/ES, 2017
o C 4 5 6 7 8 9 10 11 12 13 14 15 16 S ta nda rd devi ati on i n d eg re e-d ays - S D dd 5 10 15 20 25 30 35 40 45 o C 4 5 6 7 8 9 10 11 12 13 14 15 16 S ta nd a rd de v ia n ti o n in d a ys - S D d 0.0 0.5 1.0 1.5 2.0 2.5 3.0 o C 4 5 6 7 8 9 10 11 12 13 14 15 16 C o ef fi cient o f va ri at io n i n d egre e-d ays - C V d d 0 1 2 3 4 5 6 o C 10 15 20 25 30 35 R el a ti ve de vel op m e nt R D 0.0 0.5 1.0 1.5 2.0 2.5 3.0
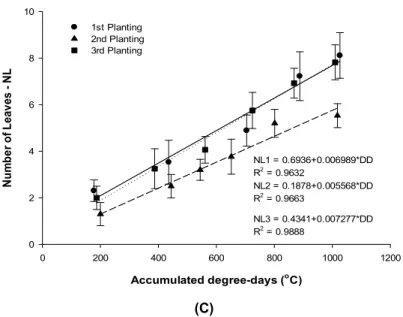
With the minimum basal temperature defined at (10.0°C), the height of the seedlings, stem diameter and number of leaves were related to accumulated degree-days (Fig. 5) and the growth rates for height and diameter of the seedlings were determined in relation to accumulated degree-days (Fig. 6) by Equations 13 and 14. The use of the thermal sum in degree-day, for estimates height development, stem diameter and number of leaves, besides the growth rates for height and diameter of the cacao tree seedlings, allowed estimates with the coefficient
of determination (R2) close to 1.0 (Figs. 5 and 6).
The use of degree-days allows more accurate evaluations and management when compared to
the use of temporal scales after sowing or emergence, as also observed by Ferneda et al. [31].
It is possible to observe that the height and the diameter (Figs. 5A and 5B) of the cacao tree seedlings produced in the 2nd Planting (winter) presented reduced growth when compared to the hotter periods (1st and 3rd Planting).
The number of leaves presented increasing and linear behaviour in the three plantations, when correlated to the cumulative degree-days, with lower growth of the second planting, when compared to the other evaluated periods (Figure 5C). Accumulated degree-days (oC) 0 200 400 600 800 1000 1200 S h oo t H ei gh t - S H ( cm) 0 5 10 15 20 25 30 1st Planting 2nd Planting 3rd Planting SH1 = -7.029+29.88*(1-exp(-0.00324*DD)) R2 = 0.9964 SH2 = -5.159+21.62*(1-exp(-0.00292*DD)) R2 = 0.9903 SH3 = -15.031+38.013*(1-exp(-0.00434*DD)) R2 = 0.9951 (A) Accumulated degree-days (oC) 0 200 400 600 800 1000 1200 S tem D ia m e ter - S D ( m m ) 1 2 3 4 5 6 1st Planting 2nd Planting 3rd Planting SD1 = 0.5285+5.087*(1-exp(-0.00167*DD)) R2 = 0.9893 SD2 = -0.8043+4.972*(1-exp(-0.00373*DD)) R2 = 0.9949 SD3 = 0.3733+6.137*(1-exp(-0.0016*DD)) R2 = 0.9973 (B)
Accumulated degree-days (oC) 0 200 400 600 800 1000 1200 N u m b e r o f L eav es - N L 0 2 4 6 8 10 1st Planting 2nd Planting 3rd Planting NL1 = 0.6936+0.006989*DD R2 = 0.9632 NL2 = 0.1878+0.005568*DD R2 = 0.9663 NL3 = 0.4341+0.007277*DD R2 = 0.9888 (C)
Fig. 5. Shoot height (A), stem diameter (B) and number of leaves (C) of the cacao tree seedlings TSH1188, in the three growing seasons as a function of the accumulated
degree-days (ºC) – Colatina/ES, 2017 Analyzing the growth rates of cacao tree
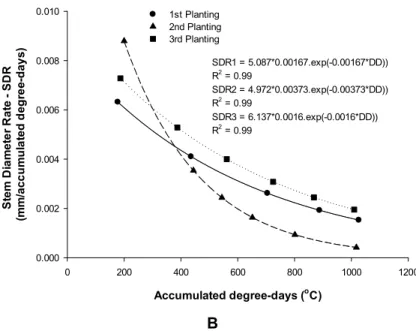
seedlings (Figs. 6A and 6B) it is possible to verify that the height and diameter gain are reduced with the accumulation of degree-days and tend to stabilize, becoming almost null when growth occurs when the thermal sum approximates the accumulated 1000 degree-days, characterizing, thus, the finalization of the development of the seedling phase.
To obtain good quality cacao tree seedlings, it
was necessary to add a thermal sum in degree-day of 1026.35 DD in the 1st planting,
1017.40 DD in the 2nd planting and 1009.70 DD in the 3rd planting. Thus, for a full vegetative development of the TSH1188 cacao tree seedlings, a thermal sum of 1018 DD is required on average to form seedlings with quality. Accumulated degree-days (oC) 0 200 400 600 800 1000 1200 H ei g ht G row th R at e H G R (c m /a c cu m ul a te d d eg re e -d a y s) 0.00 0.02 0.04 0.06 0.08 1st Planting 2nd Planting 3rd Planting HGR1 = 29.88*0.00324.exp(-0.00324*DD)) R2 = 0.99 HGR2 = 21.62*0.00292.exp(-0.00292*DD)) R2 = 0.99 HGR3 = 38.013*0.00434.exp(-0.00434*DD)) R2 = 0.99 A
Accumulated degree-days (oC) 0 200 400 600 800 1000 1200 S tem D ia m et e r R a te - S D R (m m /acc u m u la ted d eg re e-d ay s) 0.000 0.002 0.004 0.006 0.008 0.010 1st Planting 2nd Planting 3rd Planting SDR1 = 5.087*0.00167.exp(-0.00167*DD)) R2 = 0.99 SDR2 = 4.972*0.00373.exp(-0.00373*DD)) R2 = 0.99 SDR3 = 6.137*0.0016.exp(-0.0016*DD)) R2 = 0.99 B
Fig. 6. Height growth rate (A) and the stem diameter rate (B) of TSH1188 cacao tree seedlings in the three growing seasons as a function of the accumulated degree-days (ºC) – Colatina/ES,
2017 In Table 2 it is possible to verify that the seedlings in the three plantations were really ready since they presented values above 0.2 in the Dickson quality index (DQI), which is considered the minimum established by Hunt [32] for obtaining a good quality seedling. Considered also by Johnson and Cline [33] as a promising morphological measure, the DQI reflects the quality of the seedlings considering in its calculation the robustness (TDM) and the balance of the phytomass distribution (RSHSD and RDMSR).
It is important to emphasize that, even if quality cacao tree seedlings are obtained with a thermal sum of 1018 DD, if a producer wishes to produce seedlings in a colder period, the time to obtain a seedling of quality will be longer, as observed in the second planting of this experiment (Table 1), and the physiological characteristics of the seedlings will not have the same pattern of the seedlings produced in warmer climates, as can be observed when comparing the 2nd planting with the 1st and 3rd planting (Table 2), but both will have quality at 1018 DD.
Table 2. Average values with a standard deviation of growth and quality the cacao tree seedlings, at the different growing seasons in Colatina/ES, 2017
1st Planting 2nd Planting 3rd Planting
SH 22,2 ±2,77 15,0 ±0,70 22,9 ±0,83 SD 4,77 ±0,27 4,07 ±0,12 5,3 ±0,37 RL 22,2 ±3,76 20,4 ±1,62 22,9 ±1,52 NL 8,1 ±0,98 5,5 ±0,51 7,8 ±0,75 LA 347,12 ±64,48 157,26 ±27,89 309,58 ±85,05 FMSS 8,03 ±1,19 4,21 ±0,55 8,67 ±1,42 DMSS 1,92 ±0,18 0,91 ±0,12 2,32 ±0,37 FMRS 2,17 ±0,25 2,16 ±0,32 2,28 ±0,48 DMRS 0,38 ±0,08 0,29 ±0,02 0,42 ±0,05 DQI 0,24 ±0,04 0,20 ±0,01 0,21 ±0,01
SH - shoot height (cm); SD - stem diameter (mm); RL - root length (cm); NL - number of leaves; LA - leaf area (cm2); FMSS - fresh mass of shoot system (g); DMSS - dry mass of the shoot system (g); FMRS - fresh mass of
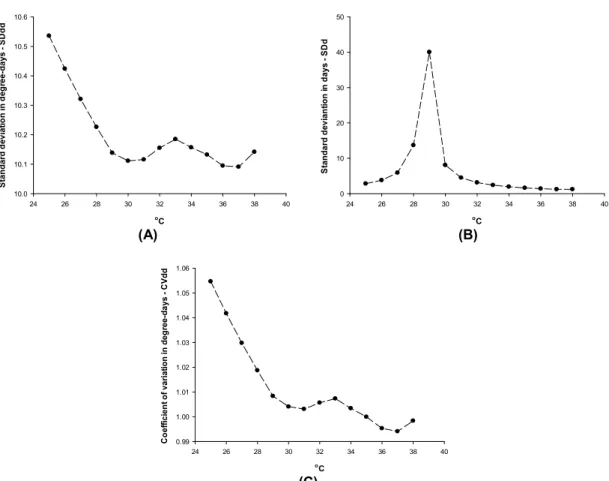
Taking into consideration the basal temperature
of 10ºC, it was possible to determine the upper basal temperature (TB), which presented a mean value of TB = 37ºC between the three estimation methods (SDdd, SDd and
CVdd) (Fig. 7). This value is close to that found in other crops such as soybean (37ºC)
[31], fig tree (36ºC) [34] and eucalyptus (36ºC) [35].
Matos et al. [36] found the value of 30.7°C for the maturation stage of the dwarf cashew as the upper basal temperature for the FAGA 11 clone. Farias et al. [37], through studies
with cowpea, found a higher basal
temperature of 38°C for the BR3 tracuateua cultivar, considering the entire development
cycle of the crop, which is close to that found for the upper basal temperature for
TSH1188 cacao tree seedlings, which was 37 ºC.
Since TB is an elevated temperature and, in some regions, rarely reached in the field, its determination is not very frequent in studies of basal temperature estimation. However, in the climatic conditions observed during the three planting seasons of the cacao tree seedlings of this experiment, it was possible to observe (Fig. 1A) that in several moments TB was exceeded, reaching a maximum temperature of 49.1°C 10/29/2017 (3rd planting), and mean maximum temperatures above 37ºC for the 1st and 3rd planting (Table 1). This indicates that the
knowledge of TB is important for the
characterization of the development of the cacao
tree seedlings cultivated under climatic
conditions that present warmer temperatures, where TB can often be overcome, restricting the development of the crop. Thus, this information is fundamental for the planning, management and cultural treatments of the cacao tree for seedling production. o C 24 26 28 30 32 34 36 38 40 S tan dard d ev iat io n in d eg ree -da ys - S D d d 10.0 10.1 10.2 10.3 10.4 10.5 10.6 o C 24 26 28 30 32 34 36 38 40 S tanda rd d ev ian ti on i n d ay s - S D d 0 10 20 30 40 50 (A) (B) o C 24 26 28 30 32 34 36 38 40 C o ef fi ci en t of va ri at ion i n deg ree -da ys C V dd 0.99 1.00 1.01 1.02 1.03 1.04 1.05 1.06 (C)
Fig. 7. The standard deviation in degree-days - SDdd (A); Standard deviation in days – SDd (B) e Coefficient of variation in degree-days – CVdd (C) for estimates of the upper basal temperature (TB) of the cacao tree TSH1188 in the production period of the seedlings –
4. CONCLUSION
The lower and upper basal temperatures for the production of cacao tree seedlings are 10 ºC and 37 ºC, respectively.
The development of the variables shoot height, stem diameter and number of leaves of the cacao tree plants as a function of the cumulative degrees-days allows more precise evaluations for monitoring and cultural management to obtain a production of quality cacao tree seedlings in different climatic conditions.
The thermal requirement in degree-day to obtain a quality change of the TSH1188 cacao tree is 1018ºC.
The time required for the production of cacao tree seedlings varies according to the season of the year. Cacao tree seedlings conducted in periods with higher temperatures took less time to form with quality.
The cacao tree crop, based on the results found in these trials, showed to be sensitive to low temperatures, proving to be a predominantly tropical climate crop.
COMPETING INTERESTS
Authors have declared that no competing interests exist.
REFERENCES
1. ICCO - International Cocoa Organization.
Growing cocoa; 2018.
Available:https://www.icco.org/about-cocoa/growing-cocoa.html
(Accessed 10 May 2018).
2. Souza CAS, Dias LAS, Aguilar MAG.
Economic and social importance. In: Souza CAS, Dias LAS, Aguilar MAG, Borem A, editors. Cacao from planting to harvest. 1st ed. Viçosa, MG: UFV; 2016:9-40.
3. Almeida RLS, Chaves LHG. Analysis of
the growth of cocoa CCN-51 seedlings.
Revista Verde de Agroecologia e
Desenvolvimento Sustentável. 2011;
6(1):196-200.
4. IBGE – Instituto Brasileiro de Geografia e
Estatistica. Statistics on agricultural
production; 2016. Available: https://
sidra.ibge.gov.br/tabela/1618#resultado.
5. Dias LAS, Francisco Neto E, Souza CAS,
Aguilar MAG. Cultivate. In: Souza CAS, Dias LAS, Aguilar MAG, Borem A, editors. Cacao from planting to harvest. 1st ed. Viçosa, MG: UFV; 2016:123-138.
6. Oliari ICR, Umburanas RC, Eschemback
V, Kawakami J. Effect of sunlight restriction and temperature increase on radish plant growth. Pesquisa Aplicada & Agrotecnologia. 2010;3(3):83-88.
7. Machado EC, Schimidt PT, Medina CL,
Ribeiro RV. Photosynthetic responses of three citrus species to environmental factors. Pesquisa agropecuária brasileira, Brasília. 2005;40(12):1161-1170.
8. Larcher, W. Plant ecophysiology. São
Carlos: Rima; 2000.
9. Kerbauy GB. Plant physiology. Rio de
Janeiro: Guanabara Koogan, 2004.
10. Oliveira AS, Steidle Neto AJ, Ribeiro A,
Rascon NJL, Rody YP, Almeida AQ. Determination of thermal time for the development of eucalyptus seedlings during rooting phase. Revista Brasileira de
Engenharia Agricola e Ambiental.
2012;16(11):1223-1228.
11. Ometto JC. Bioclimatologia vegetal. São
Paulo: CERES. 1981;440.
12. Rodrigues JC, Souza PJOP, Lima RT.
Estimate of base temperature and thermal requirement in mango for the northeast of Pará. Revista brasileira de fruticultura. 2013;35(1):143-150.
13. Köppen, W. Das geographische system
der klimate. In: Köppen GW.; Geiger MR. (eds.), Handbuch der Klimatologie, Berlin. 1936;44.
14. Allen RG, Pereira LS, Raes D, Smith M.
Crop evapotranspiration: guidelines for
computing crop water requirements.
(Irrigation and Drainage Paper, 56) Rome: FAO. 1998;1-300.
15. Dickson A, Leaf AL, Hosner JF. Quality
appraisal of white spruce and whit pine seedling stock in nurseries. Forestry Chronicle. 1960;36:10-13.
16. Arnold CY. Maximum-Minimum
Temperature as a Basis for Computing
Heat Units. American Society for
Horticulture Science. 1960; 76:682-692.
17. Arnold CY. The Determination and
Linear Heat Unit System. American Society for Horticulture Science. 1959; 74:430-445.
18. Yang S, Logan J, Coffey DL. Mathematical
formulae for calculating the base
temperature for growing degree days.
Agricultural and Forest Meteorology.
1995;74:61-74.
19. Müller L, Manfron PA, Medeiros SLP,
Streck NA, Mittelmman A, Neto DD, Bandeira AH, Morais KP. Lower base temperature and seasonal production of diploid and tetraploid ryegrass genotypes. Ciência Rural. 2009;39(5):1343-1348.
20. R Core Team. R: A language and
environment for statistical computing. R Foundation for Statistical Computing, Vienna, Austria. 2017. Available:URL https://www.R-project.org/.
21. Souza PMB, Martins FB. Estimate of the
base temperature in two olive cultivars: grappolo and maria da fé. Revista
Brasileira de Meteorologia.
2014;29(2):307-313.
22. Pedro Júnior MJ, Camargo MBP, Moraes
AVC, Felício JC, Castro JL. Base-temperature, growing degree-days and crop growth cycle duration of triticale cultivars. Bragantia. 2004;63(3):447-453.
23. Luz GL, Medeiros SLP, Tomm GO,
Bialozor A, Amaral AD, Pivoto D. Baseline temperature and cycle of canola hibrids. Ciência Rural. 2012;42(9):1549-1555.
24. Barbano MT, Wutke EB, Brunini O,
Ambrosano EJ, Castro JL, Gallo PB, Pereira JCVNA, Martins ALM. Base temperature and accumulated growing degree days for pea varieties (Pisum
sativum L.). Revista Brasileira de
Agrometeorologia. 2002;10(1):75-82.
25. Lago I, Streck NA, Carvalho MP,
Fagundes LK, Paula GM, Lopes SJ. Estimating base temperature of the emergence – panicle differentiation phase in cultivated rice and red rice. Revista Ceres. 2009;288-295.
26. Fagundes JD, Streck NA, Storck L,
Reiniger LR. Base temperature and termal accumulation of growth stages of Aspilia
montevidensis. Bragantia, Campinas.
2010;69(2):499-507.
27. Souza CAS, Aguilar MAG, Dias LAS.
Cacao. In: Monteiro JEBA.
Agrometeorology of crops: The
meteorological factor in agricultural
production. Instituto Nacional de
Meteorologia. Brasilia. 2009:333-350.
28. Streck NA, Weiss A, Xue Q, Baenziger PS.
Improving predictions of developmental stages in winter wheat: a modified Wang and Engel model. Agricultural and Forest Meteorology. 2003;115:139-150.
29. Streck NA, Paula FLM, Bisognin DA,
Heldwein AB, Dellai J. Simulating the
development of field grown potato
(Solanum tuberosum L.). Agricultural and Forest Meteorology. 2007;142:1-11.
30. Martins FB, Silva JC, Streck NA.
Estimating base temperature for leaf appearence rate and the phyllochron in two eucaliptus species during seedling
phase. R. Árvore, Viçosa-MG.
2007;31(3):373-381.
31. Ferneda BG, Boeing E, Silva AC, Souza
AP, Silva SG, Martim CC, Paladino FG, Tanaka AA. Degree-days in the estimates of growth rates of four soybean cultivars in different planting dates. Nativa, Sinop.
2016;4(3):121-127.
DOI:10.14583/2318-7670.v04n03a01
32. Hunt GA. Effect of styroblock design and
cooper treatment on morphology of conifer seedlings. In: Rose R, Campbell SJ,
Landis T D, eds. Target seedling
symposium, meeting of the western forest nursery associations, general technichal
report RM-200. 1990, Roseburg:
Proceedings. Collins: United States
Departament of Agriculture, Forest
Service. 1990;218-222. Available:
https://rngr.net/publications/proce
edings/1990/hunt.pdf/ (Accessed 10 Out. 2017)
33. Johnson JD, Cline ML. Seedling quality of
Southern pines. In: Duryea ML, Dougherty PM (eds.). Forest regeneration manual. Klumer Academic, Netherlands.
1991;143-162. Available:
http://dx.doi.org/10.1007/978-94-011-3800-0_8
34. Souza AP, Silva AC, Leonel S, Escobedo
JF. Basic temperatures and thermal sum for the fig trees pruned in different months. Rev. Bras. Frutic., Jaboticabal-SP. 2009; 31(2):314-322.
35. Dye PJ, Jacobs S, Drew D. Verification of
3-PG growth and water-use predictions in twelve Eucalyptus plantation stands in Zululand, South Africa. Forest Ecology and Management. 2004;193:197-218.
36. Matos VAT, Pivetta F, Paiva Sobrinho S, Tissiani ASO, Pereira APMS, Ramos FT, Campelo Júnior JH. Basal temperatures and termal requerimento for the maturation
of cashew. Biosci. J., Uberlândia.
2014;30(4):969-977.
37. Farias VDS, Costa DLP, Souza PJOP,
Takaki AY, Lima MJA. Basal temperatures
and termal needs for cowpwea
development cycle. Enciclopedia Biosfera, Centro Científico Conhecer. Goiânia. 2015;11(21):1781-1792.
_________________________________________________________________________________
© 2018 Posse et al.; This is an Open Access article distributed under the terms of the Creative Commons Attribution License (http://creativecommons.org/licenses/by/4.0), which permits unrestricted use, distribution, and reproduction in any medium, provided the original work is properly cited.
Peer-review history:
The peer review history for this paper can be accessed here: http://www.sciencedomain.org/review-history/25867