HAL Id: hal-01656914
https://hal.sorbonne-universite.fr/hal-01656914
Submitted on 6 Dec 2017HAL is a multi-disciplinary open access L’archive ouverte pluridisciplinaire HAL, est
Wei Li, Henri Groult, Olaf Borkiewicz, Damien Dambournet
To cite this version:
Wei Li, Henri Groult, Olaf Borkiewicz, Damien Dambournet. Decomposition of CoF3 during Battery Electrode Processing. Journal of Fluorine Chemistry, Elsevier, 2017. �hal-01656914�
[Title Page]
Decomposition of CoF
3during Battery Electrode
Processing
Wei Lia, Henri Groulta, Olaf J. Borkiewiczb, Damien Dambourneta,c,*
a
Sorbonne Universités, UPMC Univ Paris 06, CNRS UMR 8234, Laboratoire PHENIX,
4 place Jussieu, F-75005 Paris, France
b
X-ray Science Division, Advanced Photon Source, Argonne National Laboratory,
9700 South Cass Avenue, Argonne, Illinois 60439, United States
c
Réseau sur le Stockage Electrochimique de l’Energie (RS2E), FR CNRS 3459, 80039
Amiens, France
Decomposition of CoF3 during Electrode Processing
Wei Lia, Henri Groulta, Olaf J. Borkiewiczb, Damien Dambourneta,c,*
a
Sorbonne Universités, UPMC Univ Paris 06, CNRS UMR 8234, Laboratoire PHENIX,
4 place Jussieu, F-75005 Paris, France
b
X-ray Science Division, Advanced Photon Source, Argonne National Laboratory,
9700 South Cass Avenue, Argonne, Illinois 60439, United States
c
Réseau sur le Stockage Electrochimique de l’Energie (RS2E), FR CNRS 3459, 80039
Amiens, France
Abstract
Metal fluorides are potential candidates as electrode materials for rechargeable
batteries. During the electrode fabrication, however, thermal treatments can cause
decomposition of thermally instable compounds. Here, we showed that during the
electrode processing of CoF3, the carbon and PVDF additives act as a protective layer
that prevents CoF3 to readily decompose into CoF2 (rutile). We found that instead, it
decomposes into an intermediate phase with a corundum like structure featuring Co
vacancies, i.e., Co1.26IICo0.16III0.58F3 where represents the vacancies. The structural
analysis was possible owing to the use of the pair distribution function.
PACS(optional, as per journal): 75.40.-s; 71.20.LP
1. Introduction
Since the pioneer work of Poizot et al,[1] on the use of binary transition metal oxide
as conversion materials for lithium-ion batteries, a large number of compounds have
been reported to undergo such a multi-electronic redox reaction.[2] Particularly,
extended studies have been related to the use of transition metal fluorides including
FeF3, TiF3, VF3 and CoF3.[3–6]
High valence metal fluorides such as CoF3 can decompose into binary fluoride with
the release of molecular fluorine gas which make them potential solid fluorinating
agent.[7] The thermal decomposition path of CoF3, however, largely depends on the
operating conditions.[8] Traces of humidity can promote the decomposition of CoF3
according to:
2CoF3 + H2O 2CoF2 + 2HF + ½O2 (eq 1)
Hence, CoF3 should be handled in dry conditions to prevent decomposition.[6]
The preparation of battery electrodes which are composite of electroactive material,
carbon and a polymeric matrix comprises several steps.[9] The mixing of electroactive
material, carbon with polyvinylidene fluoride (PVDF) binder is usually performed with
N-Methyl-2-pyrrolidone (NMP) solvent. The slurry is then casted onto a current
collector. The solvent is evaporated at low temperature, i.e., 60-70 °C below the flash
point (96 °C) of NMP. To remove traces of humidity, a final heat treatment is usually
performed at a temperature of around 105 °C. All these steps can alter the
structure/composition of the electroactive material. Here, we investigated the impact of
these steps on the structure/composition of CoF3 electrode by means of high-energy
the decomposition of CoF3. By structural analysis of the electrode, we discovered a new
phase, intermediate between CoF3 and CoF2, whose structure was solved using a
rhombohedral cell isostructural to the corundum type structure with Co vacancies. This
work points to the necessity to careful handling when dealing with certain metal
fluorides.
2. Results and Discussion
To investigate the decomposition mechanism of CoF3 during electrode processing, we
considered three types of samples that are the pristine CoF3 (handled in a dry glove
box), CoF3 treated at 70 °C under air to mimic the solvent removal step and the
electrode. It should be noted that the preparation of the electrode was performed using
hand-milling which does not impact the crystal structure of the material. High intensity
synchrotron based x-ray ( = 0.2128 Å) scattering measurements was performed at the Advanced Photon Source. For convenience, the data were re-scaled in two-theta at the
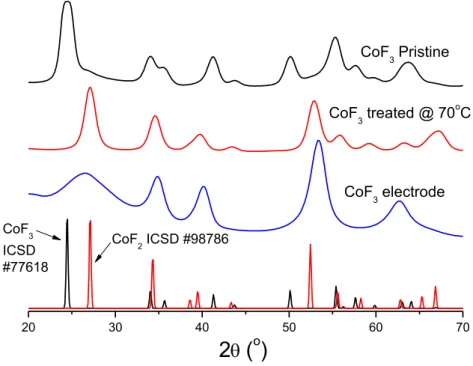
wavelength of copper Cu = 1.54 Å (Figure 1). The X-ray diffraction pattern of the
pristine CoF3 can be indexed using a rhombohedral R-3c cell.[10] We also noted a small
amount of CoF2 impurity.[11] After a thermal treatment at 70 °C under ambient
atmosphere, CoF3 readilly converts to CoF2. The electrode XRD pattern, however,
differs from both CoF3 and CoF2 and could not be indexed using crystallographic
database.[12] Moreover, the Bragg peaks showed broad lines that complexify the
20 30 40 50 60 70 CoF2 ICSD #98786 CoF3 ICSD #77618
2
(
o)
CoF3 electrode CoF3 treated @ 70oC CoF3 PristineFigure 1. High-energy X-ray diffraction patterns of pristine CoF3 (black), CoF3 treated
at 70oC under ambient atmosphere (red) and electrode (blue). Reference XRD patterns
of CoF2 and CoF3.
To better understand the composition and structural changes associated with the
decomposition process of CoF3, we used the pair distribution function (PDF), G(r),
which was obtained by Fourier transformed high-energy X-ray total scattering data. By
providing real-space structural representation, PDF enables to obtain detailed
information at the local to long-range order particularly suited to study
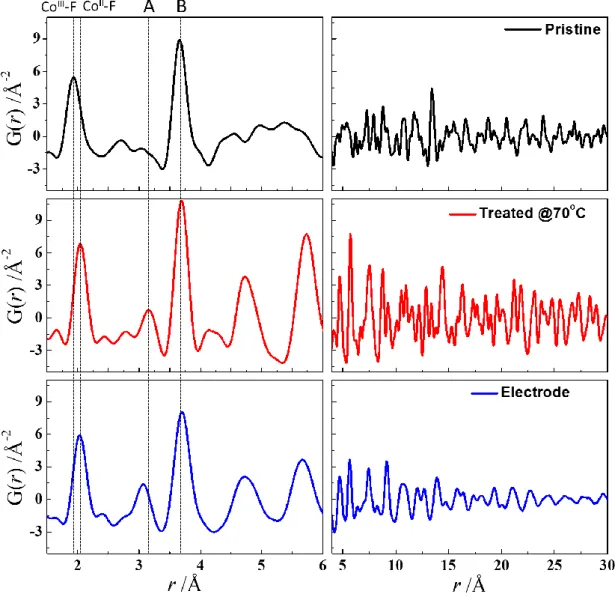
disordered/nanostructured/amorphous compounds.[13] PDFs of the pristine CoF3, CoF2
(CoF3 treated at 70oC under ambient atmosphere) and the electrode are gathered in
Figure 2 with selected r-region characteristic of short-range, i.e., 1 r 6 Å, and intermediate/long-range orders, i.e., r > 4 Å. PDF represents a histogram of all
atom-atom distances within the sample. The first peak located at around 2 Å corresponds to
first peak yielding 2.04 Å for CoF2 and 1.94 Å for CoF3. In the electrode, the first peak
is centered at 2.03 Å which is close to that found in CoF2 and is therefore related to
CoII-F distances indicating that CoF3 was reduced during the electrode fabrication. The
second peak at around 3.1 Å is close to Co-Co pairs found in the rutile CoF2 and arises
from edge-shared CoF6 octahedra (label A, dCo-Co = 3.17 Å). This peak is absent in CoF3
which features only corner-shared CoF6 octahedra with dCo-Co = 3.6-3.7 Å (label B).
Note that the rutile phase presents both edge- and corner-shared CoF6 octahedra as
revealed by the presence of the two sets of distances. At r > 4 Å, the PDF features of the
electrode differ from those found in CoF2 and CoF3 indicating a different structural
Figure 2. PDF profiles of pristine CoF3 (black), CoF2 (CoF3 treated at 70oC under
atmosphere) (red) and electrode. A and B refer to Co-Co interatomic distances in edge-
and corner-shared CoF6 octahedra, respectively.
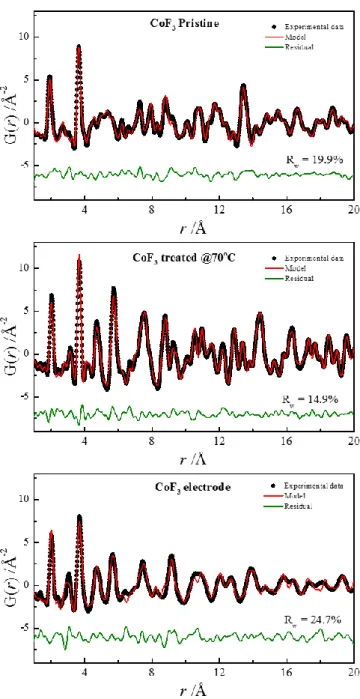
To identify the structure stabilized during the electrode fabrication, we attempted to fit
the PDF data using a real-space refinement.[14] First, we refined the PDF of pristine
CoF3 and CoF2 (obtained by CoF3 treated at @70 °C) starting from previously reported
structures.[10,11] Figure 3 presents the refined PDFs with reliability factors Rw that
CoF3 was refined using two-phase models based on CoF3 (space group R-3c) and CoF2
(space group P4/2mnm). The amount of CoF2 and CoF3 within the pristine was 25 and
75at%, respectively. Selected structural parameters extracted from the refinement are
gathered in Table 1 and are in good agreement with previously reported
structures.[10,11]
To fit the PDF of the electrode, we used different structural models particularly
structures that shared common structural features. Notably, it is known that the
corundum and rutile are structurally related.[15] According to the X-ray diffraction
pattern in Figure 2, the rutile CoF2 phase seems to be present with a broad Bragg peak
at around 26-27 2(°) which can be indexed with the (110) line of the tetragonal cell. Hence, we included it in the fit. Finally, the best fit (Figure 3) was obtained using a
corundum-type phase Co2F3. Moreover, the determination of the PDF scattering domain
(sp parameter in the PDFGui software) yielded 8 nm which explained the broadness of
the Bragg peaks. Table 2 gathered the structural parameters of the corundum phase
obtained from the PDF refinement. The refinement of the Co (12c) rate occupancy
indicates the presence of Co vacancies. Based on the general composition, the refined
Figure 3. PDF refinements of pristine CoF3, CoF2 (CoF3 treated at 70oC under
atmosphere) and CoF3 electrode.
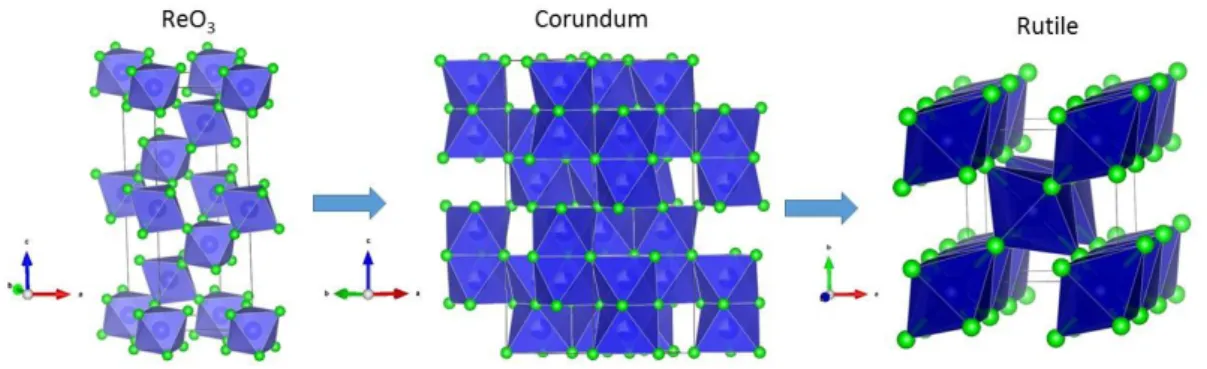
Here, we showed that CoF3 decomposes to CoF2 via an intermediate phase derived from
the corundum type structure. The structural representations of the three phases CoF2,
carried out to better understand the decomposition mechanism of CoF3 along with phase
transformation path from ReO3, corundum to rutile type structures.
Figure 4. Structural representations of ReO3 (CoF3), corundum (Co1.26IICo0.16III0.58F3)
and rutile (CoF2) type structures.
The as prepared electrode was cycled in glavanostatic mode versus metallic lithium.
Figure 5 shows the galvanostatic curves obtained under 50 mA.g-1 with LP30 as the electrolyte. The theoretical capacity of Co1.26IICo0.16III0.58F3 is 572 mAh.g-1. Upon
discharge, a pseudo plateau region was observed at an average potential of 1.65 V
yielding a capacity around 550 mAh.g-1 which is close to the theoretical capacity.
Moreover, the average potential is 350 mV higher than the one display by CoF2
showing a slight variation of the insertion voltage between the two structures. The full
discharge yielded around 1230 mAh.g-1 which can be assigned to the electrolyte
decomposition. After the first charge, the capacity decreased to 505 mAh.g-1 which
suggest that the conversion reaction is almost reversible. Finally, after the second cycle,
the capacity further decreased to 410 mAh.g-1 which might be due to the inability to
Figure 5. Galvanostatic discharge/charge curves of Co1.26IICo0.16III0.58F3 electrode
cycled under 50 mA.g-1 vs. metallic lithium.
3. Conclusion
In this work, we reported on the structural analysis of an electrode made of CoF3. Based
on high-energy X-ray data, we showed that CoF3 decomposes during the electrode
processing into a new structure/composition. Using the pair distribution function, we
discovered that this structure corresponds to a defective corundum phase featuring Co
vacancies, i.e., Co1.26IICo0.16III0.58F3. Hence, the decomposition of CoF3 (ReO3) toward
4. Experimental
4.1. Materials preparation and electrochemical measurements
Thermal treatment of CoF3 pristine powder was conducted at 70 °C under air
atmosphere for 7 hours.
CoF3 electrode was prepared by hand-milling of active material (80 wt%), acetylene
black (10 wt%) as conductive agent and polyvinylidene difluoride (10 wt%) previously
dissolved in N-methyl-2-pyrrolidone (NMP, Sigma-Aldrich) as the binder. The resulting
paste was coated onto a copper foil using a doctor blade. The electrode was dried in an
oven under primary vacuum at 75 °C overnight to evaporate NMP solvent.
Electrochemical measurements were carried out using CR2032-type coin cells. The
electrolyte was 1 M LiPF6 dissolved in a mixture of ethylene carbonate (EC) and
dimethyl carbonate (DMC) (1:1, v/v). The cells were assembled and tested with lithium
metal as the anode and the reference electrode in the voltage range of 3.0–0.05 V vs.
Li+/Li under 50 mA.g-1.
4.2. Synchrotron diffraction
Samples were loaded inside Kapton capillaries. Data were collected at the 11-ID-B
beamline at the Advanced Photon Source at Argonne National Laboratory, using high
energy X-rays (λ = 0.2128 Å) allowing access to high values of momentum transfer
using PDFgetX2,[19] after correcting for background and Compton scattering. The
refinement of the PDF data was carried out using the PDFgui software.[20]
Structural representation was obtained by using VESPA program.[21]
Acknowledgements
We thank A. Demourgues for providing CoF3 sample. The work done at the
Advanced Photon Source, an Office of Science User Facility operated for the U.S.
Department of Energy (DOE) Office of Science by Argonne National Laboratory, was
supported by the U.S. DOE under Contract DE-AC02-06CH11357. H.G., and D.D.
wish to thank the French Fluorine Network for continuous support.
References
[1] P. Poizot, S. Laruelle, S. Grugeon, L. Dupont, J.-M. Tarascon, Nano-sized transition-metal oxides as negative-electrode materials for lithium-ion batteries, Nature. 407 (2000) 496–499. doi:10.1038/35035045.
[2] J. Cabana, L. Monconduit, D. Larcher, M.R. Palacín, Beyond Intercalation-Based Li-Ion Batteries: The State of the Art and Challenges of Electrode Materials Reacting Through Conversion Reactions, Adv. Mater. 22 (2010) E170–E192. doi:10.1002/adma.201000717.
[3] H. Arai, S. Okada, Y. Sakurai, J. Yamaki, Cathode performance and voltage estimation of metal trihalides, Journal of Power Sources. 68 (1997) 716–719. doi:10.1016/S0378-7753(96)02580-3.
[4] F. Badway, F. Cosandey, N. Pereira, G.G. Amatucci, Carbon Metal Fluoride Nanocomposites High-Capacity Reversible Metal Fluoride Conversion Materials as Rechargeable Positive Electrodes for Li Batteries, J. Electrochem. Soc. 150 (2003) A1318–A1327. doi:10.1149/1.1602454.
[5] H. Li, P. Balaya, J. Maier, Li-Storage via Heterogeneous Reaction in Selected Binary Metal Fluorides and Oxides, J. Electrochem. Soc. 151 (2004) A1878– A1885. doi:10.1149/1.1801451.
[6] H. Groult, S. Neveu, S. Leclerc, A.-G. Porras-Gutierrez, C.M. Julien, A. Tressaud, E. Durand, N. Penin, C. Labrugere, Nano-CoF3 prepared by direct fluorination with F2 gas: Application as electrode material in Li-ion battery, Journal of Fluorine Chemistry. 196 (2017) 117–127. doi:10.1016/j.jfluchem.2016.10.003.
[7] N. Louvain, J. Peyroux, M. Dubois, W. Simond, F. Leroux, Efficient Fluorinating Agent through Topochemical Fluorination of Co–Fe Layered Double Hydroxides, Inorg. Chem. 53 (2014) 852–860. doi:10.1021/ic402193x.
[8] J.V. Rau, V.R. Albertini, N.S. Chilingarov, S. Colonna, M. di Michiel,
Observation of a New Co-F Compound Detected by Very-High-Energy X-ray Diffraction During Thermal Decomposition of CoF<SUB>3</SUB>, Chemistry Letters. 31 (2002) 664–665. doi:10.1246/cl.2002.664.
[9] E. Talaie, P. Bonnick, X. Sun, Q. Pang, X. Liang, L.F. Nazar, Methods and Protocols for Electrochemical Energy Storage Materials Research, Chem. Mater. 29 (2017) 90–105. doi:10.1021/acs.chemmater.6b02726.
[10] A.L. Hector, E.G. Hope, W. Levason, M.T. Weller, The Mixed Valence Structure of “R–NiF3,” Z. Anorg. Allg. Chem. 624 (1998) 1982–1988.
doi:10.1002/(SICI)1521-3749(1998120)624:12<1982::AID-ZAAC1982>3.0.CO;2-4.
[11] W. Jauch, M. Reehuis, A.J. Schultz, γ-ray and neutron diffraction studies of CoF2: magnetostriction, electron density and magnetic moments, Acta Cryst A. 60 (2004) 51–57. doi:10.1107/S0108767303022803.
[12] ICSD - Basic Search & Retrieve, (n.d.). https://icsd.fiz-karlsruhe.de/search/basic.xhtml (accessed July 27, 2017).
[13] S.J.L. Billinge, M.G. Kanatzidis, Beyond crystallography: the study of disorder, nanocrystallinity and crystallographically challenged materials with pair
distribution functions, Chemical Communications. (2004) 749. doi:10.1039/b309577k.
[14] T. Egami, S.J.L. Billinge, Underneath the Bragg Peaks: Structural Analysis of Complex Materials, Elsevier, 2003.
[15] H. Katzke, R. Schlögl, Mechanism of the morphotropic transformation between the rutile and corundum structural types, Acta Cryst B, Acta Cryst Sect B. 59 (2003) 456–462. doi:10.1107/S0108768103010851.
[16] P.J. Chupas, X. Qiu, J.C. Hanson, P.L. Lee, C.P. Grey, S.J.L. Billinge, Rapid-acquisition pair distribution function (RA-PDF) analysis, J Appl Crystallogr. 36 (2003) 1342–1347. doi:10.1107/S0021889803017564.
[17] P.J. Chupas, K.W. Chapman, P.L. Lee, Applications of an amorphous silicon-based area detector for high-resolution, high-sensitivity and fast time-resolved pair distribution function measurements, J Appl Crystallogr. 40 (2007) 463–470. doi:10.1107/S0021889807007856.
[18] A.P. Hammersley, S.O. Svensson, M. Hanfland, A.N. Fitch, D. Hausermann, Two-dimensional detector software: From real detector to idealised image or two-theta scan, High Pressure Research. 14 (1996) 235–248.
doi:10.1080/08957959608201408.
[19] X. Qiu, J.W. Thompson, S.J.L. Billinge, PDFgetX2: a GUI-driven program to obtain the pair distribution function from X-ray powder diffraction data, J Appl Crystallogr. 37 (2004) 678–678. doi:10.1107/S0021889804011744.
[20] C.L. Farrow, P. Juhas, J.W. Liu, D. Bryndin, E.S. Božin, J. Bloch, T. Proffen, S.J.L. Billinge, PDFfit2 and PDFgui: computer programs for studying
[21] K. Momma, F. Izumi, VESTA 3 for three-dimensional visualization of crystal, volumetric and morphology data, J Appl Crystallogr. 44 (2011) 1272–1276. doi:10.1107/S0021889811038970.
Figure Captions
Figure 1. High-energy X-ray diffraction patterns of pristine CoF3 (black), CoF3 treated
at 70oC under ambient atmosphere (red) and electrode (blue). Reference XRD patterns
of CoF2 and CoF3.
Figure 2. PDF profiles of pristine CoF3 (black), CoF2 (CoF3 treated at 70oC under
atmosphere) (red) and electrode. A and B refer to Co-Co interatomic distances in edge-
and corner-shared CoF6 octahedra, respectively.
Figure 3. PDF refinements of pristine CoF3, CoF2 (CoF3 treated at 70oC under
atmosphere) and CoF3 electrode.
Figure 4. Structural representations of ReO3 (CoF3), corundum (Co1.26IICo0.16III0.58F3)
and rutile (CoF2) type structures.
Figure 5. Galvanostatic discharge/charge curves of Co1.26IICo0.16III0.58F3 electrode
Table 1
Structural parameters extracted from the PDF refinement of pristine CoF3:
Parameters CoF3 CoF2
Space group R-3c P42/mnm
a (Å) 5.031 (2) 4.63 (1)
c (Å) 13.244 (8) 3.17 (2)
Atom (Wyckoff site)
Atomic coordinates(x, y, z)
F(18e)
(0, 0.25, 0.616(2))
F(4f)
(0.311(7), 0.311(7), 0)
Size parameter (Å) N.A 20(2)
Molar % 69% 31%
Table 2
Structural parameters extracted from the PDF refinement of the electrode:
Parameters Co1.26IICo0.16III0.58F3
Space group R-3c (167)
a (Å) 5.157(3)
c (Å) 13.78(1)
Atom (Wyckoff site)
Atomic coordinates(x, y, z) / occupancy
Co (12c)
(0, 0, 0.3371(5)/ 0.71(2) F (18e)