HAL Id: hal-00270434
https://hal.archives-ouvertes.fr/hal-00270434
Submitted on 4 Apr 2008
HAL is a multi-disciplinary open access
archive for the deposit and dissemination of
sci-entific research documents, whether they are
pub-lished or not. The documents may come from
teaching and research institutions in France or
L’archive ouverte pluridisciplinaire HAL, est
destinée au dépôt et à la diffusion de documents
scientifiques de niveau recherche, publiés ou non,
émanant des établissements d’enseignement et de
recherche français ou étrangers, des laboratoires
Image and video quality assessment using LCD:
comparisons with CRT conditions
Sylvain Tourancheau, Patrick Le Callet, Dominique Barba
To cite this version:
Sylvain Tourancheau, Patrick Le Callet, Dominique Barba. Image and video quality assessment
using LCD: comparisons with CRT conditions. IEICE Transactions on Fundamentals of Electronics,
Communications and Computer Sciences, Institute of Electronics, Information and Communication
Engineers, 2008, E91-A (6), pp.1383-1391. �10.1093/ietfec/e91-a.6.1383�. �hal-00270434�
Image and video quality assessment using LCD: comparisons
with CRT conditions
Sylvain Tourancheau, Patrick Le Callet, and Dominique Barba
IRCCyN, University of Nantes,
Polytech’Nantes, rue Christian Pauc, 44304 Nantes, France.
[email protected]
Abstract
In this paper, the impact of display on quality as-sessment is addressed. Subjective quality assess-ment experiassess-ments have been performed on both LCD and CRT displays. Two sets of still images and two sets of moving pictures have been assessed using either an ACR or a SAMVIQ protocol. Al-together, eight experiments have been led. Results are presented and discussed, some differences are pointed out. Concerning moving pictures, these differences seem to be mainly due to LCD moving artefacts such as motion blur. LCD motion blur has been measured objectively and with psycho-physics experiments. A motion-blur metric based on the temporal characteristics of LCD can be de-fined. A prediction model have been then designed which predict the differences of perceived quality between CRT and LCD. This motion-blur-based model enables the estimation of perceived qual-ity on LCD with respect to the perceived qualqual-ity on CRT. Technical solutions to LCD motion blur can thus be evaluated on natural contents by this mean.
Keywords: subjective quality assessment, LCD motion blur, perception, measurements, displays
1
Introduction
In the recent years, subjective and objective qual-ity assessment becomes a research topic of inter-est. Activities of the Video Quality Experts Group (VQEG) are a good example of this interest. Pre-vious works [1] and work in progress [2] are mainly
related to coding or transmitting purpose at a given resolution, e.g. coding artefacts and transmission errors. Display impact is rarely taken in account since for years only CRT were used and the dis-tortions introduced by this technology were con-sidered as insignificant with regards to other arte-facts. However, since few years new display tech-nologies have grown such as liquid crystal displays (LCD), plasma or projectors. These new tech-nology are recent and not mature yet comparing to CRT, particularly for moving pictures. As a result, the perceived quality of images and mov-ing pictures can be highly influenced by the dis-play on which they are seen and knowledge about display should be used to improve quality assess-ment processes. Considering the whole chain, qual-ity assessment should be able to manage depen-dency to other technology issues. LCD, for ex-ample, have many differences with CRT displays. Some subjective studies highlighted a high prefer-ence for CRT displays concerning moving pictures [3]. Many defects have been counted by viewers, such as colour differences, degradations in dark ar-eas and de-interlacing artefacts for interlaced se-quences. But among all these defects, motion blur seems to be the most annoying one, particularly in sequences with significant movements. An evidence for motion blur growing interest is the number of studies dealing with its measurement or its analy-sis [4, 5, 6, 7, 8, 9, 10, 11]. Moreover, standardisa-tion organisms such as TCO Development[12] and VESA [13] are currently working on requirements concerning this particular distortion. In this pa-per, some subjective quality assessment tests are described, as well with still pictures as with
mov-ing ones. Both LCD and CRT displays are used and subjective scores are compared and discussed. In a second part, LCD motion blur is presented. Psycho-physics experiments and physical measure-ments are presented. Finally, an example of ob-jective metric based on display knowledge is ad-dressed. This prediction model is based on LCD motion blur and permits to estimate the perceived quality on LCD from the perceived quality on CRT.
2
Subjective quality
assess-ment experiassess-ments
In this section, some subjective quality assessment experiments are described. They have been per-formed on both CRT and LCD displays, and con-sidering still images as well as moving pictures.
2.1
Image and video materials
Four sets of materials have been used in the sub-jective quality assessment experiments. Two sets named SP1 and SP2 contain only still images while two other sets, MP1 and MP2, contain moving pic-tures:
• SP1: the Toyama database, i.e. 14 colour pic-tures (768×512), coded with JPEG2000 using 6 compression ratio, and with JPEG using 6 compression ratio (196 pictures).
• SP2: 5 colour pictures (1280×800), distorted using mainly several combinations of down-scaling followed by up-down-scaling operations (20 pictures).
• MP1: 10 HDTV sequences (1920×1080 inter-laced, YUV 4:2:2) of 10-second length from the European broadcasters SVT and Euro1080, coded with H.264 using 7 different bit-rates (80 sequences).
• MP2: 4 of the latter ones, rescaled in a SDTV-similar format (960×540 interlaced), and coded with H.264 using 6 different bit-rates (24 sequences).
2.2
Viewing
conditions
and
ob-servers
All subjective quality assessment experiments have been performed in a standardised room. Room il-lumination, chromaticity background, display set-tings and viewing distance have been set accord-ing to ITU recommendations BT.500-11 [14] and BT.710-4 [15]. These parameters have been ad-justed, when needed, for different contents and dis-plays used in the experiments. For example, view-ing distance was set to 3H for HDTV content, 6H for SDTV content and 4H for Toyama database images, where H is the height of the displayed pic-ture. For experiments using moving pictures, a HD player has been used, which enables the real-time playback of uncompressed HDTV content. In all experiments, the same displays has been used: a JVC DT-V 1910CG (CRT) and a Philips T370 HW01 (LCD).
Each observer participating in the experiments was first checked for colour blindness with Ishihara test and for visual acuity with Monoyer’s plates. People with at least one error in Ishihara’s test or less than 9/10 in Monoyer’s test were rejected. Ob-servers’age ranged from 20’s to 60’s with an average around 30. Gender parity was respected as well as possible. The consistency of the individual scores was then evaluated after the tests have been com-pleted by all the valid observers. It was done by applying a suitable rejection technique. This is a process in which all scores from a particular subject are omitted from the analysis of data. The number of retained observers depends on the protocol used (see 2.3).
2.3
Protocols
An absolute category rating (ACR) protocol has been used with the Toyama database (SP1 mate-rial) to follow the same test conditions as for ex-periments performed on CRT on a previous paper from Parvez et al. [16]. With this protocol, each picture is presented singly for subjective assessment and the observer is asked to provide his perception of the quality on a discrete scale that is divided into five numerical values and adjectives (Bad =1, Poor=2, Fair=3, Good=4, and Excellent=5). The test presentation order is randomised differently for each observer. Following the VQEG
recommenda-tions [2], at least 24 observers should be retained after the rejection process.
An effect of quantification of the subjective scores can appear with the ACR protocol and its discrete quality scale. In order to obtain more pre-cise and more reliable results, we decided to use the SAMVIQ protocol for the three others sets of materials (SP2, MP1 and MP2). The SAMVIQ method [17] is a multi-stimuli continuous qual-ity scale (MSCQS) protocol developed by France Telecom R&D and standardised by the European Broadcasting Union (EBU) and by the Interna-tional Telecommunications Union (ITU). It pro-vides a precise and reliable measure of the subjec-tive video quality as the observers have a random access to all sequences and can directly compare the impaired sequences among themselves and against the reference. This allows them to precisely build their assessment opinion. This is particularly inter-esting in a HDTV context where very little quality differences have to be identified [18]. Observers set the quality score using a continuous scale with a cursor moving from 0 to 100. Five adjectives were displayed on the scale to help the observers’choice (Bad =10, Poor=30, Fair=50, Good=70, and Ex-cellent=90). At least 15 observers should be re-tained after the rejection process.
2.4
Results on still images (SP1 and
SP2)
2.4.1 Toyama JPEG and JPEG2000 databases (SP1)
The Toyama database has been assessed on CRT in the University of Toyama in Japan [16]. In order to compare both displays, we decided to perform the same subjective quality assessment using a LCD. However, design the same experiment in two differ-ent labs it’s a real challenge and the so-called “lab effect” can occur. Actually, even if set as similar as possible, the viewing conditions can differ from on testing room to another. Furthermore, using two different pools of observers can also lead to slight differences. Also, some cultural differences can ap-pear between France and Japan, in the way to as-sess quality. For example, the way that observers consider the adjectives on the quality ladder can be different. These adjectives were in English for the experiments in Japan, which was not the native
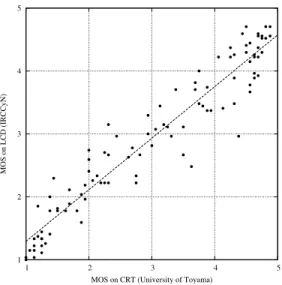
1 2 3 4 5 1 2 3 4 5 MOS on LCD (IRCCyN)
MOS on CRT (University of Toyama)
Figure 1: Comparison of MOS obtained on LCD (IRCCyN lab) and on CRT (University of Toyama lab) for the Toyama JPEG database.
guage of observers. They were translated in french for the experiments in France but the meaning of words can be slightly altered from one language to another.
Results between the two labs should be com-pared with regard to both the difference of displays and the lab effect. Figures 1 and 2 present the mean opinion scores (MOS) obtained on LCD in our lab as a function of MOS obtained on CRT in the University of Toyama [16] for the JPEG database and the JPEG2000 database respectively. In both cases, the set of scores obtained on CRT is are highly correlated with the one obtained on LCD, with linear correlation coefficients of 0.956 for the JPEG database and 0.966 for the JPEG2000 database. It’s remarkable to have such a important correlation between experiments performed sepa-rately. However, when looking more precisely at the scores, a difference of scale can be observed. For both databases, the scores obtained on LCD (in France) are slightly better in the low part of the quality scale, whereas they are slightly lower in the high part of the quality scale.
1 2 3 4 5 1 2 3 4 5 MOS on LCD (IRCCyN)
MOS on CRT (University of Toyama)
Figure 2: Comparison of MOS obtained on LCD (IRCCyN lab) and on CRT (University of Toyama lab) for the Toyama JPEG2000 database.
2.4.2 HDTV format pictures (SP2)
Images of SP2 set contain specific contents such as natural textures, flesh colours, oriented contours, water reflection, characters, etc. Each of them has been distorted by different combinations of a down-scaling filtering following by an up-down-scaling filter-ing. They have been assessed on both LCD and CRT displays, in HDTV 1080i format (1920×1080 in interlaced mode). Original and distorted pic-tures have been respectively inserted in a grey back-ground to fit the format. It should be noticed that interlaced mode cannot be displayed on LCD, the screen thus performed a de-interlacing of the pic-tures in order to display them.
For this experiment, the same group of observers has been used for the two displays. The group has been split in two parts: the observers of the first part have passed the test on CRT first, the ob-servers of the second part have passed the test on LCD first. In order to study the quality differences due to display technology, we focused on the MOS obtained for the hidden reference (non distorted) pictures. Results and 95% confidence intervals are shown in Table 1. The difference of perceived qual-ity ∆MOS is computed as the difference between the scores obtained on CRT (MOSCRT) and those
obtained on LCD (MOSLCD):
Pictures MOSCRT MOSLCD ∆MOS
FOOTBALL 70.6 (7.4) 79.7 (7.3) -9.1 HAND 75.8 (7.4) 79.3 (7.2) -3.5 HOUSE 59.8 (11.1) 80.3 (11.1) -20.5 LANDSCAPE 75.8 (5.8) 75.7 (5.4) 0.1
MAP 59.8 (10.9) 83.9 (10.7) -24.1 Table 1: Mean opinion scores and 95% confidence intervals (between brackets) obtained on both dis-plays for the set SP2 displayed in 1080i.
∆MOS = MOSCRT−MOSLCD (1)
It can be observed that for still pictures the quality on LCD is globally preferred. Overall, shortcomings of CRT displays such as flickering and limited range of luminance seems to lead to a lower feeling of natural and sense of immersion. LCD is brighter, vivid and colourful and the per-ceived quality of still pictures is clearly higher on it (∆MOSmean= -11.4). On the whole set of 20
pictures (hidden reference and distorted ones), the linear correlation coefficient is 0.832. As expected, quality scores on both displays are correlated but not so much. This could be due to the fact that some processing artefacts are more visible on one display than on the other.
2.5
Results
on
moving
pictures
(MP1 and MP2)
2.5.1 HDTV sequences (MP1)
Figure 3 shows the mean opinion scores obtained on LCD as a functions of those obtained on CRT. The linear correlation coefficient between the two sets of scores is 0.9487. It can be seen that the perceived quality is globally better on CRT than on LCD. The average value of ∆MOS over the 80 sequences is ∆MOSmean= 10.2. In order to study
more precisely the impact of display without cod-ing artefacts considerations, we can focus on the MOS of the hidden reference sequences presented in Table 2. It’s interesting to notice that this loss of quality is quite important for sequences with quick movements such as Show, Concert, Foot and Voile. This loss of quality on LCD seems to be related to the quantity and/or the fastness of the movements in the sequence.
Sequences MOSCRT MOSLCD ∆MOS VOILE 86.1 (7.7) 76.6 (7.2) 9.5 FOOT 83.3 (6.4) 74.1 (7.6) 9.2 CONCERT 82.6 (7.2) 73.1 (4.3) 9.5 SHOW 84.6 (5.3) 72.6 (7.5) 12.0 CREDITS 84.3 (6.2) 76.3 (7.2) 8.0 MOBCAL 79.9 (6.1) 80.6 (5.7) -0.7 PARKRUN 87.6 (4.2) 81.3 (6.1) 6.3 SHIELDS 85.3 (3.7) 76.3 (7.3) 9.0 STOCKHOLM 85.4 (5.5) 80.4 (6.6) 5.0 GOLF 77.5 (5.8) 78.5 (6.1) -1.0 Table 2: Mean opinion scores and 95% confidence intervals (between brackets) obtained on both dis-plays for the set MP1.
0 20 40 60 80 100 0 20 40 60 80 100 MOS on LCD MOS on CRT
Figure 3: MOS obtained of LCD as a function of MOS obtained on CRT for the set MP1.
0 20 40 60 80 100 0 20 40 60 80 100 MOS on LCD MOS on CRT
Figure 4: LCD MOS as a function of CRT MOS for the set MP2.
2.5.2 SDTV sequences (MP2)
The SDTV sequences of the set MP2 are computed from four HDTV sequences of the set MP1 through a half-band filtering followed by a down-sampling operation by a factor of 2 (both along horizontal and vertical directions). This processing is per-formed on each field of the interlaced HDTV se-quence. The resulting 540i sequences are an ap-proximation of the actual SDTV whereof format is 576i, with the advantage that it does not necessi-tate any interpolation.
The MOS obtained on LCD are plotted as a func-tion of the MOS obtained on CRT in Figure 4. The linear correlation coefficient between the two sets of scores is 0.9541. Here again, the perceived quality is preferred on CRT than on LCD. But whereas the gap is quite important in HD (set MP1), it’s less blatant for SD materials (set MP2). The aver-age loss of quality between CRT and LCD is almost reduced by a factor 2: ∆MOSmean= 5.9.
2.6
Conclusion
For all experiments, a high correlation exists be-tween perceived quality on CRT and perceived quality on LCD. Experiments with Toyama database (SP1) have highlighted a difference in the use of the quality scale between CRT (Japan) and LCD (France). This result can be due to the
dif-ference of display but it’s likely that the lab effect (along with cultural differences) could be respon-sible for an important part, even if viewing condi-tions in the two labs were as close as possible.
Experiments with the set SP2 have shown a sig-nificant preference for images displayed on LCD whereas experiments with the set MP1 pointed out that moving pictures were largely preferred on CRT display. These results seem to agree with previ-ous studies [3], highlighting that LCD moving arte-facts could be responsible for a loss of perceived quality on LCD. More particularly, LCD motion blur can be very annoying on sequences with a lot of movements. Experiments with SDTV materials (set MP2) have also shown a difference of perceived of quality between CRT and LCD. But this differ-ence was less significant than for HDTV materials. In the following, the assumption is done that the loss of quality on LCD is mainly due to motion blur. In order to verify this hypothesis, the motion blur is analysed and measured. A linear model is validated which permits to predict blur from the temporal response function of the LCD.
3
LCD motion blur
3.1
LCD motion blur perception
Despite recent improvements to LCD technology such as response time compensation [19], LCD mo-tion blur remains very annoying for sequences with rapid movements. In fact, even if the response time of a liquid crystal matrix was reduced to zero, mo-tion blur would still appear. This is due to sample-and-hold behaviour of the display : the light inten-sity is sustained on the screen for the duration of the frame, whereas on CRT light intensity is a pulse which fades over the frame duration (cf. Figure 5). LCD displays are so called hold-type displays. The main difference happens when the eye of the ob-server is tracking a moving object on the screen: for a given frame, the picture is still on the screen while the eye is still moving slightly anticipating the movement of the object. Edges of this object are displaced on the retina resulting in a blur [20]. Several authors have analysed the motion blur perception [20, 21, 7, 8, 9]. Pan et al. [6] have devel-oped a mathematical model in which the temporal response of the liquid crystal display is a parameter.
(a) (b)
Figure 5: Temporal evolution of a pixel’s intensity on a CRT display (a), on an LCD display (b). (from Pan et al. [6])
This model is designed to predict the perception of a moving edge on a LCD device. They showed that the perceived blurred edge width BEW can be ex-pressed as a function of the velocity V of the object with the following relation:
BEW = aV (2) where a can be obtained from the temporal re-sponse function of the LCD.
3.2
Objective motion blur
measure-ments
Spatial measurement of a moving edge have been performed using a high-frame-rate stationary cam-era. The blurred edge profile is obtained from the spatial measurements by motion compensation and temporal integration [11, 10] to reproduce the smooth pursuit and the temporal integration of the eyes. This method is very similar to the famous MPRT measurement system [4] but it does not re-quire a moving camera system and it’s easier to carry out.
The apparatus used for this measurements con-sisted in a high-frame-rate CCD camera and a PC used to control the camera, to store grabbed frames, and to display stimuli on the test display. A JAI PULNiX’s Gigabit Ethernet CCD camera, the TM-6740GE, has been used for these measure-ments. It was linked to the control PC via Eth-ernet, using a Gigabit Ethernet Vision (GigE Vi-sion) interface which permits to reach high frame rate. Its frame rate has been set to 1200 Hz with a resolution of 224×160 pixels. The display fre-quency has been set to 60 Hz, thus we obtain 20 CCD frames for each display frame. The distance between the measured display and the camera has
(a) Frame 0 (b) Frame 4
(c) Frame 8 (d) Frame 12
(e) Frame 16 (f) Frame 20
Figure 6: CCD camera frames (224×160 pixels) taken during one period of the display frame rate.
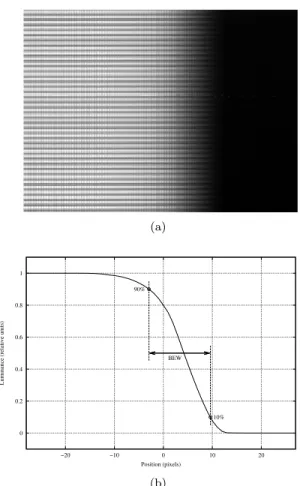
been set in such a way that one pixel on the display array is pictured by 4×4 pixels on the CCD array. This permitted us to obtain a good approximation of the 56×40 pixels display frame by computing the mean of each 4×4 blocks in the CCD frame. Stim-uli were generated with Matlab on a PC using the PsychToolbox extension [22]. They consisted of a straight edge moving from left to right. One exam-ple of frames grabbed by the CCD camera is shown in Figure 6. As mentioned before, the blurred pro-file was obtained by motion compensation of each CCD frames to simulate the smooth pursuit of the eyes. The high camera frame rate and the precise calibration of apparatus to have 4×4 CCD cam-era pixels to picture one display pixel permit us to achieve this motion compensation precisely. Next, all frames are added to each other to simulate the temporal integration on the retina. An example of blurred edge obtained with this method is shown in Figure 7 for a edge moving with a velocity V = 10 pixels per frame. The blurred edge width BEW (in pixels) is measured as illustrated. The blurred edge time BET (in seconds or in frames) is generally used, it’s expressed by dividing BEW by the ve-locity V (in pixels per seconds or pixels per frame): BET = BEW/V (3) Moreover, it has been observed that for a given grey-to-grey transition (i.e. for a given temporal re-sponse of the liquid crystal cells), BET was not varying with the velocity V . In other terms, the measured blur width BEW was proportional to the velocity of the moving edge. This result agree with the relation 2 and the parameter a can then be identified with the blurred edge time BET .
3.3
Perceived motion blur
measure-ments
Experiments have been designed in order to subjec-tively measure the perceived blur width as a func-tion of mofunc-tion speed. However, the percepfunc-tion of motion blur is directly related to the tracking of the moving object. If the observer stops to track the stimulus, to measure blur for example, then the blur is not perceived anymore. That’s why we had to design an experiment in which the measurement of the blur is done while perceiving it. This has been done by displaying on LCD a periodical
struc-(a) 0 0.2 0.4 0.6 0.8 1 −20 −10 0 10 20
Luminance (relative units)
Position (pixels) BEW
10% 90%
(b)
Figure 7: Blurred edge picture obtained after mo-tion compensamo-tion of the camera frames and tem-poral summation (a), and blurred edge profile ex-tract from the latter (b). Measurements have been performed for a black-to-white edge moving from left to right with a velocity of V = 10 pixels per frame.
(a) (b)
Figure 8: Displayed (a) and perceived (b) stimulus for an horizontal movement from left to right.
ture of bars moving at a constant speed V . Due to LCD motion blur, edges of the bars did not appear sharp as shown in Figure 8a but spread in the gap between two bars as in Figure 8b. During the test, the observer increased or decreased, in real-time, the space between the bars until he considered that the two blurred areas were just merging.
Many grey-to-grey transitions have been tested in both horizontal and vertical directions. The length of a session varied from an observer to an other, but the average time was between 10 and 15 minutes. Seven observers participated in the exper-iment, each has repeated the test twice, on different days. We finally obtained a set of 14 observations for each stimulus.
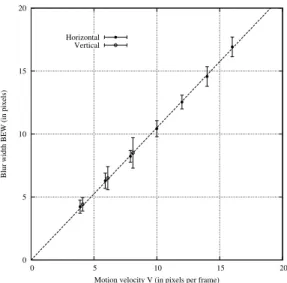
An example of results is shown in Figure 9 for a given grey-to-grey transition. In the explored range of speed, the width of blur BEW was proportional to motion velocity V , as well for horizontal move-ment as for vertical movemove-ment. It can be observed that there were no significant differences between the two directions. For each grey-to-grey transition tested during the experiment, the same behaviour occurred and subjective results can be fitted by the linear relation 2 with a very high correlation coeffi-cient. It was of 0.9984 for the transition illustrated in Figure 9.
3.4
Conclusion
Both objective and subjective measurements of LCD motion blur have led to a linear relation be-tween the blurred edge width BEW and the veloc-ity V . The proportionalveloc-ity factor a is constant for a given grey-to-grey transition. It has been iden-tified to the blurred edge time BET and can be computed from the temporal response function of the LCD display [9, 11]. This model enables the
0 5 10 15 20 0 5 10 15 20
Blur width BEW (in pixels)
Motion velocity V (in pixels per frame) Horizontal
Vertical
Figure 9: Perceived blur width BEW as a func-tion of mofunc-tion velocity V, for a horizontal direc-tion (filled circles) and for a vertical direcdirec-tion (open circles), with confidence intervals over seven ob-servers.
prediction of perceived blur for a given velocity.
With regard to this result, the fact that the loss of quality on LCD was lower with SDTV mate-rial (see section 2) can be easily explained. In SDTV, the velocity of moving objects is reduced by two in terms of resolution (pixels per second) with respect to HDTV. The magnitude of per-ceived motion blur is then reduced in the same pro-portions. The loss of quality on LCD for SDTV materials (∆MOSmean= 5.9) was around two times
lower than in HDTV (∆MOSmean= 10.2). This is
another evidence to the assumption that LCD mo-tion blur is the main cause of the loss of perceived quality on LCD. Moreover, this tends to show that LCD motion blur is typically an HDTV artefact since it’s less visible and then less annoying at lower resolutions.
In the following section, a objective motion-blur-based model is designed in order to predict LCD perceived quality.
4
Prediction model of video
differences
between
CRT
and LCD
Figure 10 illustrates the both subjective and objec-tive way to obtain the difference of quality ∆MOS. Since subjective assessment gives a value of ∆MOS for each sequence, an objective model is designed in order to predict this quality loss ∆MOSp from
the magnitude of blur in the sequence. As shown in the previous section, the perceived blur is linearly related to the velocity of the movement.
The prediction is made in four steps. Firstly, a motion estimation is performed along the sequence. This leads to the construction of tubes which are the sets of blocks positions along the direction of motion. Each tube is then classified according to his spatial content. Secondly, tubes categorised as textures and contours are selected and an average motion vector is computed from all the vectors of these selected tubes. Thirdly, an average magni-tude of motion blur is predicted using the linear model of the previous section. Fourthly, ∆MOSp
is computed from a prediction model.
4.1
Motion estimation
As sequences are interlaced, motion estimation is made on each field. A block 16×8 of an odd (resp. even) field is simultaneously compared to blocks of the two previous and the two next odd (resp. even) fields (Figure 11). The position which minimises the mean square error is chosen. Thus, a vector is obtained for each 16×8 block of each group of five consecutive odd (resp.even) fields. For each group of five frames, the motion vectors of even and odd fields are then merged in order to obtain a vector for each 16×16 block. These blocks which are followed along five frames are so called spatio-temporal tubes. Each tubes are classified into cat-egories: contours, textures or uniform areas.
4.2
Average blur index
Since motion blur is only visible with a sufficient contrast [23], tubes classified contours and textures are selected. For each group of five frames, a spa-tial vector is computed averaging the vectors of se-lected tubes. These spatial vectors are then
tempo-Figure 10: Diagram illustrating the objective pre-diction of the loss of quality ∆MOSp.
Figure 11: Construction of the spatio-temporal tubes.
rally averaged along the sequence. A global motion vector is obtained for each sequence. The norm V of this global vector is finally used to compute the width of perceived motion blur according to previ-ous section (cf. Equation 2). The obtained BEW is an indicator of the magnitude of perceived blur along the sequence.
4.3
Prediction
A indicator of the quantity of perceived motion blur has been computed for each sequence. The main objective of this work is to determine the relation between the LCD motion blur and the loss of qual-ity observed between CRT and LCD displays. A non linear function ∆MOSp = f (BEW ) has been
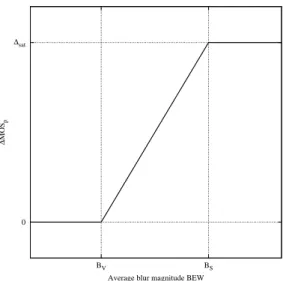
constructed in order to predict the quality differ-ence ∆MOS from the average blur quantity BEW . It has been assumed that this function has the fol-lowing shape:
• In the first part (BEW ≤ BV), the magnitude
of perceived motion blur is too small to be no-ticeable and to influence quality perception. • In the second one, the quality loss increases
with magnitude of motion blur.
• Finally, in the third part, the quality difference saturates despite the increase of perceived blur (BEW ≥ BS). This saturation may be due to
contextual effects such as limited assessment scale and presence of quite distorted sequences during quality assessment.
The prediction model ∆MOSp = f (BEW ) is
rep-resented in Figure 12. This model can be used to predict the quality loss ∆MOS between CRT and LCD from the average magnitude of blur measured on a sequence.
4.4
Results
The whole objective model presented in Figure 10 enables the prediction of the difference of perceived quality between CRT and LCD. This difference depends on the average motion blur measured on a sequence. This prediction of the loss of quality on LCD has sense when the motion blur is visible, i.e. for sequences with significant movements, and for video material with a high resolution.
0 ∆sat BV BS ∆ MOS p
Average blur magnitude BEW
Figure 12: Prediction of the loss of quality ∆MOSp
from the average blur magnitude BEW .
An estimation of the subjective quality scores on LCD from the subjective quality scores on CRT can be made using the following relation:
MOSest
LCD= MOSCRT−∆MOSp (4)
This model is based on motion blur measure-ments, it can then be adapted to all types of tempo-ral response. As a consequence, it permits to evalu-ate, on natural contents, the technical solutions to reduce motion blur such as back-light flashing or black data insertion.
5
Conclusion
In this paper, the impact of display on subjective quality assessment has been addressed. Subjec-tive quality assessment experiments have been per-formed on both LCD and CRT displays. Two sets of still images and two sets of moving pictures have been assessed using either an ACR or a SAMVIQ protocol. Results have shown that CRT was glob-ally preferred for moving pictures whereas it was the inverse for still images. As a consequence, the assumption has been done that the difference be-tween display was mainly due to LCD moving arte-facts such as motion blur. It should also be noticed that the difference of quality is reduced by a fac-tor two for SDTV materials with respect to HDTV
materials.
LCD motion blur has been then measured ob-jectively and with psycho-physics experiments. It has been shown that the perceived blur width was varying linearly with the velocity. The parameter of this relation could be deduced from the temporal characteristics of the LCD display. This could ex-plain the reduction of ∆MOS between HDTV and SDTV materials.
Finally, a objective model has been designed which permits to predict the differences of per-ceived quality between CRT and LCD. This motion-blur-based model enables the estimation of perceived quality on LCD with respect to the per-ceived quality on CRT. Technical solutions to LCD motion blur such as back-light flashing or black data insertion can thus be evaluated on natural contents by this mean.
This study highlighted the fact that the recent LCD technology could lead to new visual artefacts when displaying moving pictures. These new arte-facts are not significant at low resolutions, which validate the use of LCD for subjective video qual-ity assessment in the Multimedia Test plan of the VQEG [2]. However, when increasing the resolu-tion, they become more annoying and have an im-portant impact on the perceived quality. It comes that the subjective video quality assessment at a high resolution (HDTV for example) should be led very carefully on LCD since a significant part of the perceived distortions could be due to the dis-play. Liquid crystal displays have to be improved in order to reach the visual quality of CRT tech-nology, particularly in a HDTV context. However, more reduced video applications supports such as laptop, cell phone, personal digital assistants, etc. are not as much affected due to their smaller dis-play resolutions.
Acknowledgements
This study is supported by a student grant from the French r´egion Pays de la Loire. Work presented in section 3.2 has been supported by TCO Develop-ment, Sweden. The authors would like to thank Arnaud Tirel and Romuald P´epion for their assis-tance in performing the experiments described in the paper.
References
[1] VQEG, “Final report from the video quality experts group on the validation of objective models of video quality assessment,” Tech. Rep., VQEG, 2003. http://www.vqeg.org. [2] VQEG, “Multimedia group test plan,” Tech.
Rep. Draft version 1.16, VQEG, February 2007. http://www.vqeg.org.
[3] ITU, “Report on results of comparative sub-jective picture quality assessment test be-tween CRT and LCD,” Questions ITU-R 95/6, 102/6, International Telecommunication Union - Radiocommunication Study Groups, August 2005.
[4] K. Oka and Y. Enami, “Moving picture re-sponse time (MPRT) measurement system,” SID Symposium Digest of Technical Papers, pp.1266–1269, SID, May 2004.
[5] M.A. Klompenhouwer, “Temporal impulse re-sponse and bandwidth of displays in relation to motion blur,” SID Symposium Digest of Tech-nical Papers, pp.1578–1581, SID, June 2005. [6] H. Pan, X.F. Feng, and S. Daly, “LCD motion
blur modeling and analysis,” IEEE Interna-tional Conference on Image Processing, ICIP 2005., pp.21–24, September 2005.
[7] X.F. Feng, “LCD motion-blur analysis, per-ception, and reduction using synchronized backlight flashing,” Proceedings of the SPIE Conf. Human Vision and Electronic Imaging XI, Electronic Imaging 2006, SPIE, January 2006.
[8] X. Li, X. Yang, and K. Teunissen, “LCD mo-tion artifact determinamo-tion using simulamo-tion methods,” SID Symposium Digest of Techni-cal Papers, pp.6–9, SID, May 2006.
[9] A.B. Watson, “The Spatial Standard Ob-server: A human vision model for display in-spection,” SID Symposium Digest of Technical Papers, pp.1312–1315, SID, June 2006. [10] M.E. Becker, “Motion blur measurement and
evaluation: From theory to the laboratory,” SID Symposium Digest of Technical Papers, pp.1122–1125, SID, May 2007.
[11] X.F. Feng, H. Pan, and S. Daly, “Comparison of motion blur measurement in lcd,” SID Sym-posium Digest of Technical Papers, pp.1126– 1129, SID, May 2007.
[12] TCO, “TCO’06 Media Displays,” TCOF1076 version 1.2, TCO Development AB, Stock-holm, Sweden, 2006.
[13] VESA, “Flat Panel Display Measurements (FPDM2),” Tech. Rep. 2.0 Update, Video Electronics Standards Association, May 2005. [14] ITU, “Methodology for the subjective assess-ment of the quality of television pictures,” Recommendation ITU-R BT.500-11, Interna-tional Telecommunication Union - Radiocom-munication Sector, June 2002.
[15] ITU, “Subjective assessment methods for im-age quality in high-definition television,” Rec-ommendation ITU-R BT.710-4, International Telecommunication Union - Radiocommunica-tion Sector, November 1998.
[16] Z.M.P. Sazzad, Y. Kawayoke, and Y. Horita, “Spatial features based no reference image quality assessment for JPEG2000,” IEEE In-ternational Conference on Image Processing, 2007. ICIP 2007., pp.517–520, September 2007.
[17] EBU, “SAMVIQ – Subjective assessment methodology for video quality,” Report by the EBU Project Group B/VIM, European Broad-casting Union, May 2003.
[18] J.L. Blin, “New quality evaluation method suited to multimedia context: Samviq,” Pro-ceedings of the Second International Work-shop on Video Processing and Quality Metrics, VPQM’06, Scottsdale, January 2006.
[19] R.I. McCartney, “A liquid crystal display response time compensation feature inte-grated into an LCD panel timing controller,” SID Symposium Digest of Technical Papers, pp.1350–1353, SID, May 2003.
[20] T. Kurita, “Moving picture quality improve-ment for hold-type AM-LCDs,” SID Sympo-sium Digest of Technical Papers, pp.986–989, SID, June 2001.
[21] M.A. Klompenhouwer, “The temporal MTF of displays and related video signal processing,” IEEE International Conference on Image Pro-cessing, 2005. ICIP 2005., pp.13–16, Septem-ber 2005.
[22] D.H. Brainard, “The Psychophysics Toolbox,” Spatial Vision, vol.10, no.4, pp.433–436, 1997. [23] J. Laird, M. Rosen, J. Pelz, E. Montag, and S. Daly, “Spatio-velocity CSF as a function of retinal velocity using unstabilized stimuli,” Proceedings of the SPIE Conf. Human Vision and Electronic Imaging XI, Electronic Imaging 2006, Janvier 2006.