HAL Id: hal-00755223
https://hal.archives-ouvertes.fr/hal-00755223
Submitted on 20 Nov 2012HAL is a multi-disciplinary open access archive for the deposit and dissemination of sci-entific research documents, whether they are pub-lished or not. The documents may come from teaching and research institutions in France or abroad, or from public or private research centers.
L’archive ouverte pluridisciplinaire HAL, est destinée au dépôt et à la diffusion de documents scientifiques de niveau recherche, publiés ou non, émanant des établissements d’enseignement et de recherche français ou étrangers, des laboratoires publics ou privés.
Multi-Level Modeling Approach for the Availability
Assessment of e-Business Applications
Mohamed Kaâniche, Karama Kanoun, Mourad Rabah
To cite this version:
Mohamed Kaâniche, Karama Kanoun, Mourad Rabah. Multi-Level Modeling Approach for the Avail-ability Assessment of e-Business Applications. Software: Practice and Experience, Wiley, 2003, 33 (14), pp.1323-1341. �10.1002/spe.550�. �hal-00755223�
Published in Software—Practice and Experience (SPE), John Wiley & Sons, Ltd, Vol 33, Issue 14, pp. 1323-1341, 2003
Multi-Level Modeling Approach for the
Availability Assessment of e-Business Applications
*Mohamed Kaâniche, Karama Kanoun and Mourad Rabah** LAAS-CNRS — 7 Avenue du Colonel Roche
31077 Toulouse Cedex 4 — France {kaaniche, kanoun }@laas.fr
Abstract
This paper defines a multi-level modeling approach for availability assessment of e-business applications, based on two main steps: 1) hierarchical description of the system and its interactions with the users, from the functional and structural points of view, and 2) hierarchical construction and solution of the availability models based on information from the first step. Four modeling abstraction levels are considered. The highest level (user level) describes the availability of the e-business application as perceived by the users. Intermediate levels describe the availability of functions and services provided to the users. The lowest level describes the availability of the component systems on which functions and services are implemented. The availability measures of a given level are computed based on the measures provided by the immediately lower level.
Keywords: e-business, Internet, dependability, availability, hierarchical modeling,
1. Introduction
The explosive growth of Internet users has caused a dramatic increase in electronic markets with several categories of business [3, 26, 34]: business-to-business, business-to-customer, customer-to-customer, etc. In this context, the services provided to the users result from the cooperation of several systems that are interconnected and widely distributed over the Internet. Given the critical nature of many such systems, the assessment of the quality of service as perceived by the users is a key issue for e-business service providers (eBP). Dependability and performance related measures provide useful indicators for the designers to assess the impact of component failures (software, hardware, communication links and protocols) on the quality of service provided to the users. It is important to estimate such measures early in the design process to assist the designers in making objective architectural decisions. Indeed, by comparing several architectural solutions, they can identify potential areas of improvement of the eBP infrastructure to better fulfill user expectations.
Little support is provided today for modeling and evaluating the dependability of largely distributed applications from the user perspective. The objective of this paper is to present a multi-level modeling approach for evaluating the availability of e-business applications (eBAs). Although this paper focuses on availability, the proposed framework should also allow the evaluation of other dependability and performability measures.
Our main challenge is to avoid as far as possible the construction of complex models that are difficult to process and analyze. Largeness is avoided by using hierarchical model composition and refinement techniques. Modeling is carried out in two main steps: the first step consists in describing the target eBA (from the functional and structural point of view) and its interactions with the user, according to four levels: user, function, service and resource. The second step is devoted to the hierarchical construction and solution of the eBA availability model based on the information provided at the first step. According to this scheme, the highest level (user level) describes the availability of the eBA as perceived by the users. Intermediate levels describe the availability of functions and services provided by the eBP. Finally, the lowest level describes the availability of the component systems on which the e-business functions and services are implemented. The availability measures characterizing a given level are computed based on the availability measures provided by the immediately lower level.
This paper elaborates on previous work reported in [18]. It is organized as follows. The second Section describes the work context and the main key players involved in the provision of the services delivered by an eBA. The third and fourth Sections present the multi-level modeling framework that we propose for availability evaluation from the user perspective. The fifth Section gives more insights into the low level models. The sixth Section presents some related work and the seventh Section concludes the paper.
2. Problem Statement
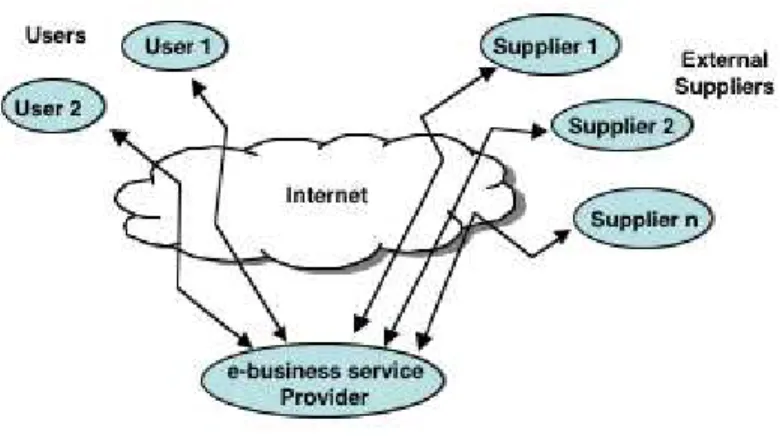
eBAs are generally based on a complex distributed infrastructure, with multiple interconnected layers of software and hardware components. Three key players are typically involved in the provision of the services delivered by such applications (see Fig. 1):
• The users, (i.e., the customers) who interact with the eBP site(s) to invoke a set of e-business functions.
• The e-business service provider (eBP), who implements the e-business functions that can be invoked by the users; these functions are based on a set of services and resources that are internal to the eBP site(s) or are provided by external suppliers.
• The external suppliers, who contribute to the implementation of some of the functions and services delivered by the eBP to its users.
Fig. 1. E-business key players.
Every transaction initiated by a user is processed in several steps. In particular, it starts in the user’s applications, flows through the Internet, executes through the business applications of the provider,
and generally through the applications of external suppliers. For example, an eBP can offer a book selling electronic service by outsourcing shipping, payment, and billing to other service providers (external suppliers). At the provider level, the user requests and the interactions with the external suppliers are supported by a set of complex distributed applications and middleware such as Web servers, application servers and database servers. Also, similar infrastructures are used at the external supplier sites.
To model the availability of eBAs as perceived by the users, it is necessary to identify the main functions and services provided to the users and the main resources contributing to their accomplishment. Based on this, one can build a model to assess the impact of component failures and repairs on the quality of service delivered to the users.
Users generally exhibit different behaviors and therefore may invoke the various e-business functions in different ways and with different frequencies. Considering a travel agency, the various classes of users (i.e., managers, tour operators, sellers, customers, etc.) have different aims and hence solicit differently the system. In addition, within the same class of users, the behavior may be unlike. For example, some customers may be heavy buyers while others may do extensive searching and browsing but very seldom buy from the provider site(s). Thus, the types of functions invoked and the resources involved in the accomplishment of these functions are not necessarily the same. As a consequence, the availability of the eBA may be perceived differently by these classes of users. Indeed, the user perceived availability is influenced by the user operational profile (i.e., workload) and the state of the components involved in the accomplishment of the functions invoked by the user. The latter may be influenced by several factors including network related failures, hardware or software component failures affecting the architecture of the provider or external suppliers.
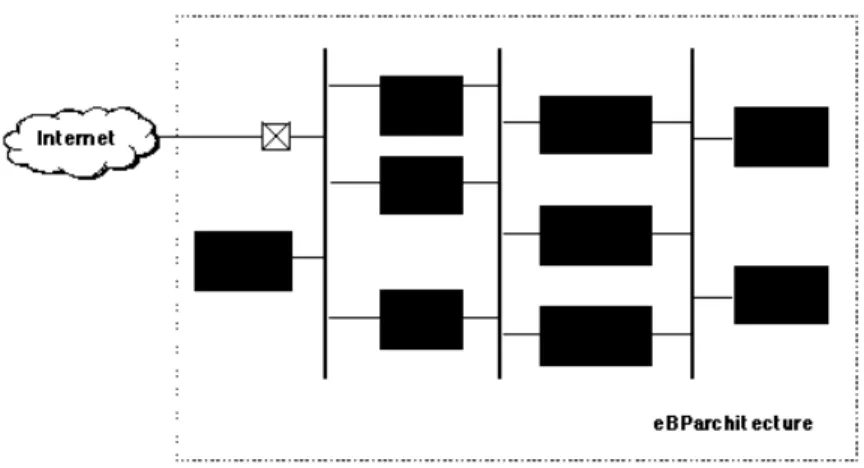
Generally, the eBP has a full control of its own architecture. Hence, a detailed availability modeling and analysis of this architecture can be carried out to support design architectural decisions. Fig. 2 presents a typical multi-tiered architecture used in large eBP sites, composed of a load balancer and a set of interconnected web servers, application servers and database servers. Several variants of this architecture can be modeled and compared with respect to the availability objectives to be fulfilled. Information characterizing the failures and repairs of each architecture component can be obtained and incorporated into these models. However, only limited information is generally available to analyze
and measurement can be used to characterize the corresponding availability [20, 24, 25]. There are several commercial products available today that service providers can use to carry out these measurements. The data provided by these measurements can be used to evaluate the parameters characterizing the services provided by external providers. These parameters will be used in the models to analyze and evaluate the availability as perceived by the users.
Fig. 2 – A typical multi-tiered architecture
The discussion above shows that several issues should be taken into account when modeling the availability of eBAs as perceived by their users. Due to the complexity of the target system, a systematic and pragmatic approach is needed to support the construction of availability models. Hierarchical modeling is well suited to alleviate the problems of model specification and solution. It consists in describing the target system at different abstraction levels, with a sub-model associated to each level. The sub-models are composed hierarchically. Each sub-model incorporates parameters that result from the processing of lower level models. In this paper, we propose a framework for the hierarchical modeling of eBA availability as perceived by the users, based on two main steps: 1) hierarchical description of the eBA and its interactions with the users, from the functional and structural point of view, and 2) hierarchical construction and solution of the eBA availability model based on the information provided by the first step. These two steps are described in Sections 3 and 4, respectively.
3. E-Business Application Hierarchical Description
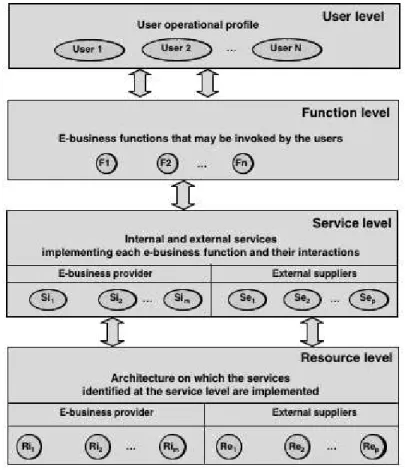
The information needed to analyze the e-business quality of service from the user perspective can be structured into four levels presented in Fig. 3. The first level describes how the users interact with the eBA, and the three remaining levels detail how the user requests are implemented.
• The user level describes the user operational profile in terms of the types of e-business functions invoked and the probability of activation of each of them.
• The function level describes the set of functions available at the provider site(s).
• The service level describes the main services needed to implement each function and the interactions among them. Two categories of services are distinguished: those provided by the eBP and those provided by external suppliers.
• The resource level describes the architecture on which the services identified at the service level are implemented. At this level, the architecture and the fault tolerance and maintenance strategies implemented at the provider site(s) are detailed.
Indeed, the function and the service levels mainly consist in describing, according to a top-down approach, how the applicative software implementing the e-business logic is structured and decomposed, whereas the resource level describes the corresponding execution environment (executive software, communication middleware, hardware components, etc.).
Fig. 3. eBA hierarchical description
The above hierarchical description builds on some concepts proposed in [27] to evaluate the performance of eBAs. However, as our framework focuses on availability modeling and evaluation from the user perspective, we have adapted these concepts and refined them to fulfill the objectives of our study.
In the following subsections, we present each of these levels and place emphasis on how this hierarchical description will help in modeling the availability of eBAs in a hierarchical way.
3.1 User Level
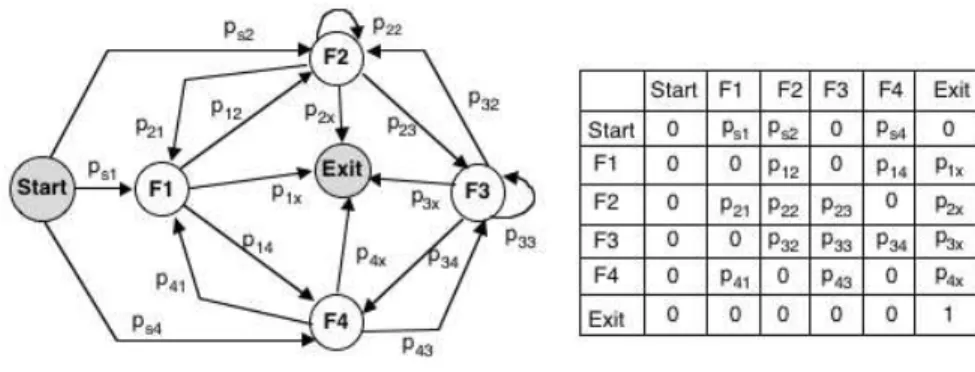
This level describes the user operational profile describing all the execution scenarios performed by the user when visiting the eBP site(s). Each scenario is defined by the set of functions invoked and the probability of activation of each function in the corresponding scenario. As illustrated in Fig. 4, the user operational profile can be described as a graph with a set of nodes and transitions. A compact description of this graph is given by the matrix representation. The Start and the Exit nodes correspond
to the beginning and end of a user scenario when visiting the provider site(s). Each node Fi means that
function Fi is invoked by the user. A transition from node Fi to node Fj means that function Fj is
executed after execution of Fi. The associated conditional probability is pij. The output transitions from
the start node, and the corresponding probabilities psi, specify the first function executed by the user
when entering the eBP site(s). Finally, parameters pix specify the probability of leaving the eBP site
after executing function Fi. Parameters pij associated with the transitions can be estimated based on
general techniques used to build operational profiles for computer systems (see e.g., [29]).
Fig. 4. User!s operational profile
The availability as perceived by the users can be evaluated by considering a particular scenario or by taking into account all the scenarios from the start node to the exit node. The availability measure will be affected by the probability of the corresponding scenario(s) and the availabilities of the functions involved in these scenarios. It is worth noting that different operational profiles with different probability matrices can be defined to analyze different classes of users: heavy buyers, occasionally buyers, etc.
3.2 Function Level
This level identifies the set of functions offered to the users at the eBP site(s). Table 1, extracted from [27], gives some examples of such functions. Some of these functions (e.g., Search, Login) may be found in most eBP sites, whereas others are characteristic of certain eBP sites or of specific types of eBP sites. The identification of all functions offered by the eBP site and the classification of these functions according to their criticality require a thorough analysis of the eBP specifications and the expectations of the users in terms of quality of service. Different levels of degradation of the quality of service delivered to the users can be defined based on the assessment of the impact of temporary loss
or degradation of each function and the cost (e.g., loss of revenue) caused by such events. Such a classification should also take into account the impact of the loss or degradation of several functions.
TABLE 1:
Examples of Functions Provided by E-Business Sites
Category Function Description
Common Login Register Search Select Browse
Login to the site Register as a new user Search site database
Show one of the results of a search Follow links within the site Retail Add Item
Remove Item See Shopping Cart Create Registry Add to Registry Check Status Pay
Add item to shopping cart Remove item from shopping cart
Check contents and value of shopping cart Create a gift registry
Add item to gift registry Check status of previous order Pay for items in shopping cart Trading Open Account
Get Quotes Get Report View Chart View Indexes Trade Create Portfolio Add to Portfolio Delete from Portfolio
Open account for trading Get delayed or real-time quotes Get performance report on companies View chart of closing prices
View values of indexes
Buy/sell/exchange stocks or mutual funds Create stock/funds portfolio
Add stock/funds to portfolio Delete stock/funds from portfolio 3.3. Service Level
This level describes the mapping between the e-business functions and the services needed to implement them. Each function identified at the function level is decomposed and refined into a set of services implemented by various software entities (i.e., servers). Examples of servers include Web, Application, Authentication, Name, File, Database and Communication servers. Generally, the execution of one function may involve more than one server. Based on the analysis of client-server interactions, we can define a matrix specifying the mapping between the functions identified at the function level and the servers identified at the service level.
Table 2 presents a static view of the link between functions and servers. It does not specify clearly if all servers are needed for each execution or if only subsets of them are needed for different execution scenarios. The latter are obtained from the analysis of the dynamic interactions among the servers
during function executions. Several graphical notations and formalisms can be used to describe the dynamic interactions and dependencies among the servers that implement an e-business function (see, e.g., [11, 14, 32]). The graphical representation given in Fig. 5 is based on the concept of the
Interaction Diagram defined in [27]. The interaction starts and ends with the client node (“Begin” and “End” nodes). Each path between a pair of client nodes identifies the set of servers involved in the interaction.
TABLE 2:
Example of Mapping Between Functions and Servers
Web Server Trading Server Authentication Server Application Server Database Server Login ! ! Register ! ! Search ! ! ! Select ! ! ! Browse ! ! ! Open Account ! ! ! Get Quotes ! ! ! Get Report ! ! ! View Chart ! ! ! View Indexes ! ! ! Trade ! ! ! ! Create Portfolio ! ! ! Add to Portfolio ! ! !
Delete from Portfolio ! ! !
Fig. 5 presents three possible scenarios for the execution of the “Browse” function. The nodes are numbered for the sake of clarity and each arc between two nodes i and j is labeled with the probability of occurrence of the corresponding transition (denoted qi,j).
The three scenarios are described as follows:
• 1!2!3: the user sends a request to the web server (node 2). The web server refuses a connection and the request fails. The user (represented by node 3) receives a reply message. This marks the end of this interaction.
• 1!2!4!5!6: the web server accepts the request from the user and sends it to the application server (node 4) that returns a dynamically generated page to the web server that replies to the user (node 6). The database is not involved in this case.
• 1!2!4!7!8!9!10: the application server requires some specific data items, it will send a request to a database server (node 7). After the database server has answered the application server, the latter will generate an HTML page for the web server, which is then forwarded to the user. All paths in the interaction diagram, from a “Begin” to an “End” node, should be accounted for in the evaluation of the availability of the corresponding function.
3.4 Resource level
This level describes the mapping between the services defined at the server level and the resources involved in the achievement of these services. Also, it provides information on the replication of each service as well as the fault tolerance and maintenance strategies implemented at the eBP site(s). A resource is a component system or an element of a component system (computer host, software and hardware components, communication link) that contributes to the implementation of e-business services. Indeed, one service may be partitioned and replicated among several resources or clusters of resources and one resource may host many services. At this level, we distinguish between internal and external services.
As the architecture on which the external services are implemented is not known, we associate to each of them a single resource that is considered as a black box. For example, an Internet service provider can be represented by a single resource providing connectivity service.
As regards internal services, a detailed analysis of the eBP site(s) architecture can be performed. We must define the mapping between the resources and the services, as well as the interactions among these resources, since the availability of each service will depend on the availability of the corresponding resources. Table 3 gives a simple example for illustration: three resources (computer
hosts A, B and C) are involved in the provision of the web service, while the application service and the database service are implemented on host D. All these resources are connected through a Local Area Network (LAN).
Several alternative architectural solutions may be considered for implementing the internal services. These solutions may be defined based on:
• various organizations of the services on the hardware support (e.g., dedicated hosts for each server, vs. multiple servers on the same host);
• various fault tolerance strategies (non-redundant servers vs. replicated servers);
• various maintenance strategies adopted by the eBP (e.g., immediate maintenance vs. delayed maintenance, dedicated vs. shared repair resources).
TABLE 3:
Example of Mapping Between Internal Services and Resources
Host A Host B Host C Host D LAN
Web Service ! ! ! !
Application Service ! !
Database service ! !
Alternative architectures may be compared to help the designers in the selection of the most appropriate solution from the availability point of view. The analysis of the architectures should lead to the definition of the mapping between the resources and the services implemented on these resources. Various levels of service degradation may be defined depending on the state of the resources involved in its accomplishment. For instance, when a service is distributed on several computer hosts, the level of degradation can be defined as a function of the number of hosts that are operational. Architecture analysis and availability modeling at the resource level provides the information that is needed to define service accomplishment levels and to establish the link between the state of the resources and the corresponding accomplishment levels. For each service, different accomplishment levels can be defined depending on the types of failures affecting the corresponding resources. In particular, when the service is distributed on several resources, the service accomplishment levels can be defined according to the number of resources that are still available to run the service (graceful degradation concept).
Knowledge of the system architecture is required for modeling purposes. Fig. 6 presents examples of configurations of a Web server: a) a non-redundant configuration with a single server, b) a redundant configuration with geographically distributed replicas, and c) cluster-based configuration with several Web servers interconnected through a LAN and centralized at a single site with a load balancer directing incoming requests to one of the servers. Configuration (b) requires the replica states to be kept mutually consistent to ensure that clients do not get out-of-date information. This is not easy to achieve on a large-scale system [16]. Alternative solutions are proposed for instance in [9] to ensure a weak coupling between functions implemented on geographically distributed servers. The cluster-based configuration is widely used for the implementation of internet-cluster-based applications. This configuration is able to handle heavy traffic loads, however it has a single point of failure, the load balancer. Therefore, fault tolerant solutions with error detection and recovery capabilities should be considered for the load balancer. Popular web sites generally combine the clustering approach with geographically distributed servers in order to provide high performance and available web service (see for instance, the architecture deployed by IBM for the Nagano Olympic games [17]).
Fig. 6. Example of configurations for a Web server
Fault tolerance solutions should also be considered to ensure reliable communication among the Web servers as well as the availability of the data accessed by Web server processes. For example, data can be partitioned among the server machines and accessed through a shared bus. Under normal conditions, each server serves the data contained in its primary disk. When a server fails, another one takes over and serves its disk in addition to its own.
An alternative configuration can be used, where a shared master copy of the data is accessed by all the servers through a distributed file system. Each web server mounts and serves the same data set from the distributed file system.
Equivalent analyzes should be done with respect to all servers (e.g., the application and database servers in the example of Table 3).
4. Availability Modeling Approach
The hierarchical modeling approach, represented in Fig. 8, is directly related to the hierarchical de-scription given in Fig. 3. It has been defined in such a way that the outputs of a given level are used in the next immediately upper level to compute the availability measures associated to this level. Accord-ingly, at the service level, the availability of each service is derived based on the availability of the re-sources involved in its accomplishment. Similarly, at the function level, the availability of each function is obtained from the availability of the services implementing it. Finally, at the user level, the availability measures are obtained based on the availability measures of the functions invoked by the user.
Considering the service level, we made a distinction between internal and external services. The latter are delivered by providers for whom only little information is known. It is however expected that specific experiments or measurements such as those performed in [20, 24, 25] will provide the availability measures {A(Sej)}. It is assumed that external services are independent.
Internal services are supplied by the resources of the eBP. Depending on the infrastructure of the provider site(s), some services may be implemented on the same resources, some of the resources may share the same repair facilities and some services or resources may be replicated or fault-tolerant. As a consequence, strong dependencies may exist between the services due to dependencies between the resources. For such infrastructures, it is more efficient to consider the service and the resource levels together, the corresponding level is simply denoted as the service/resource level.
At the service/resource level, one or several availability models are built based on the knowledge of the e-business infrastructure and the resources implementing the expected services, together with the fault tolerance and recovery mechanisms, and the maintenance policies at the provider site(s). Different techniques may be used to build and solve these availability models, including combinatorial techniques (e.g., fault trees, reliability block diagrams), and state-based techniques (e.g., Markov chains, Generalized Stochastic Petri Nets, GSPNs) [31, 35]. The selection of the right technique to be used mainly depends on whether i) the services are stochastically independent or not, and ii) the resources are independent or not. Markov chains and GSPNs are well suited to evaluate the service availability in the presence of strong dependencies. In particular, the modeling approaches described in [15, 21 , 30 ] that have been successfully applied to complex real-life systems, can be used to take into account explicitly the stochastic dependencies that might exist between the various components of the service/resource availability model. Some examples of models at the service/resource level are given in Section 5. The outputs of this modeling step are the availability of the various internal services {A
(Sij)}.
The availability model at the function level is based on the knowledge of the availability of all services involved in function accomplishment, along with the matrix giving the mapping between Functions and Services and the path probabilities derived from the interaction diagrams as defined in Section 3.3. The outputs of this level are the availability of the various functions {A (Fi)} that can be
A(Fi) = !j A("j(Fi)) j =1 M # (1) where:
• M is the number of execution scenarios for function Fi in the interaction diagram
• !j is the probability of activation of execution scenario j
• "j (Fi) is the set of servers and networks involved in execution scenario j
• A("j (Fi) is the availability of the servers and networks involved in execution scenario j
This formula is general and can be applied whether the services are independent or not. When the services are independent, A(Fi) can be expressed as:
A(Fi) = !j A(Sp) p"#j (Fi ) $ j =1 M % (2)
where A(Sp) is the availability of a server or a network, Sp, involved in execution scenario j.
At the user level, the availability model for a given user class is based on the knowledge of the execution paths followed by the user when visiting the eBP site(s) (described in the model characterizing the user operational profile, as defined in Section 3.1) and the availability of the functions invoked by the user in each path. The outputs of this level are the availability as seen by the various classes of users {A (userk)}.
Alike the function level, A (userk) can be obtained by the following formula:
A(userk) = i = 1!iA(Li) N
" (3)
where:
• N is the number of scenarios in the Markov chain describing the user operational profile • #i is the probability of activation of scenario i
• Liis the set of functions involved in scenario i
• A(Li) is the availability of functions involved in scenario i
In particular, when the functions are independent:
where A(Fq) is the availability of function Fq executed in scenario i.
What precedes shows that when the stochastic independence, or weak dependence assumptions hold, combinatorial logic can be used to obtain the availability measures associated to the corresponding levels, whereas detailed modeling using state based models is generally needed when strong dependencies exist among components. Such dependencies are likely to occur at the two lowest levels (i.e., resource and service levels). However, when strong dependencies are identified at the function level, a modeling approach based on Markov chains or stochastic Petri nets, considering the three lowest levels together could be required as it is more faithful to reality.
The availability models, defined within the multi-level modeling approach, can be solved using analytical or simulation based techniques. In particular, simulation techniques should be used when the models include particular assumptions that cannot be handled with traditional analytical techniques.
For the purpose of illustration, the next section presents some simple examples of resource and service availability modeling considering the independence and dependence modeling assumptions.
5. Examples of resource and service availability modeling
Generally, the servers implemented at the eBP site(s) are interconnected through one or several Local Area Networks (LAN). Therefore, two main components can be distinguished at the resource level: the communication links and protocols, represented for instance by the LAN, and the hosts on which the servers are implemented. In the following, we present simple examples that illustrate how availability sub-models can be built to evaluate the availability of a LAN and a server, implemented on a single computer host or replicated on several hosts.
The server modeled in this section could be any of those referred to in Section 3 (i.e., a Web server, an application server or a database server).
The availability results obtained from the models presented in this section can be directly used in equations (1) and (2) given in Section 4.
5.1. LAN availability modeling
The availability of the local area network can be analyzed with respect to two main failure modes: permanent failures and transient failures. Transient failures correspond to the temporary loss of communications, for example, as a result of the congestion of the network. These failures disappear when normal traffic conditions over the network are restored. Permanent failures correspond to hardware and software failures of network elements that require a maintenance action. Fig. 9 presents the Markov chain describing the behavior of the LAN.
The parameters used in this model are defined as follows: $p : permanent failure rate
$t : transient failure rate
$tp : occurrence rate of permanent failures when the LAN is in a transient failure state µp : restoration rate of permanent failures
µt : restoration rate of transient failures
Fig. 9. LAN availability model
The availability of the LAN in the steady state can be obtained by evaluating the probability for the LAN to be in state 0. The processing of the corresponding Markov chain leads to the following equation:
ALAN = µp.(µt + !tp)
(µp+ !p).(µt + !t + !tp) "!t.(!p"!tp)
(5)
5.2. Server availability modeling
To evaluate the availability of a server we need to take into account the impact of software and hardware failures that affect the host on which the server is implemented. Two cases are distinguished
1) Software and hardware component behaviors are stochastically independent 2) Software and hardware component behaviors are stochastically dependent
5.2.1. Stochastic independence assumption
Let us denote by $sw ($hw) the software (hardware) failure rate, and by µsw (µhw) the corresponding restoration rate, and assume that software and hardware behaviors are stochastically independent. The availability of the server can be evaluated from the Markov Chain of Fig. 10 as the product of software and hardware availabilities, as follows:
A server= As w.Ah w= µs w (µs w+!s w) . µh w (µh w+!h w) (6)
If the server is replicated on N hosts and these hosts are repaired independently of each other, the availability of the corresponding server is obtained as follows:
Aserver= 1! [1 ! As w.Ah w] N = 1! 1 ! µs w (µs w+"s w) . µh w (µh w+"h w) # $ % & ' ( N (7)
5.2.2. Stochastic dependence assumption
The model of Fig. 10 does not distinguish between the impact of permanent faults and temporary faults. Also, it does not take into account the stochastic dependencies that might arise from the fault tolerance mechanisms implemented at the software or the hardware level, or from shared maintenance resources.
Owing to the importance of temporary faults on the behavior of hardware and software components, both permanent and temporary faults should be considered. Error propagation channels resulting from the activation of these faults should also be identified and analyzed. For example, an error due to the activation of a temporary fault in a hardware processor may propagate to the software processes running on the corresponding host, and thus affect a subset or all the services running on the corresponding site. Similarly, an error due to the activation of a permanent hardware fault will cause all the supported software processes to be stopped and then restarted after the hardware is repaired. Errors may also propagate between software processes that dialog with each other. This is the case for instance of software replicas that need to exchange their state to support error detection and recovery.
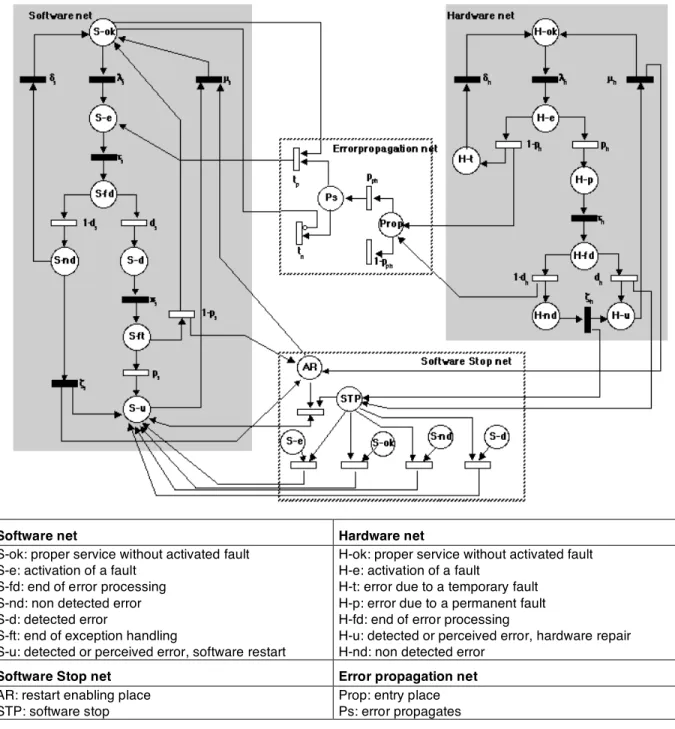
A Markov chain can be built as for the previous case to model such behaviors. However, to master the complexity of model construction, it is recommended to use GSPNs. This is illustrated on a simple system constituted by a software component and a hardware component with embedded error detection mechanisms, and assuming that errors caused by transient hardware faults may propagate to the software.
Fig. 11 presents the corresponding model. The model is based on the block modeling approach presented in [21]. It is structured as follows:
a software net, describing the software behavior as resulting from the activation of its own faults and from local error detection, fault tolerance mechanisms, and software restart actions;
a hardware net, describing the hardware behavior as resulting from the activation of its own faults and from local error detection, fault tolerance mechanisms, and hardware repair actions;
two dependency nets, modeling: 1) error propagation from hardware to software, and 2) software stop and restart caused by hardware repair actions.
Software net Hardware net S-ok: proper service without activated fault
S-e: activation of a fault S-fd: end of error processing S-nd: non detected error S-d: detected error
S-ft: end of exception handling
S-u: detected or perceived error, software restart
H-ok: proper service without activated fault H-e: activation of a fault
H-t: error due to a temporary fault H-p: error due to a permanent fault H-fd: end of error processing
H-u: detected or perceived error, hardware repair H-nd: non detected error
Software Stop net Error propagation net
AR: restart enabling place STP: software stop
Prop: entry place Ps: error propagates
Fig. 11 – GSPN of a software replica and a hardware component and their interactions
The software net is based on the following assumptions: Faults are activated with rate $s:
• With probability ps the fault is permanent, (probability of a temporary fault (1-ps)).
• The detected error is processed by means of exception handling mechanisms during a short time
1/!s. Two cases are distinguished: 1) if the fault is temporary (probability (1-ps)), its effects are eliminated and the software resumes its normal mode of operation, and 2) if the fault is permanent (probability ps), the software has to be restarted (restart rate µs) to eliminate its effects.
• The effects of a non detected error may be eliminated (rate &s), or perceived (rate "s), in which case the software has to be restarted.
Equivalent assumptions are made regarding the hardware behavior: Faults are activated with rate $h:
• With probability ph the fault is permanent, (probability of a temporary fault (1-ph)). • The effects of an error due to a temporary fault are eliminated within a short time 1/&h.
• An error due to a permanent fault is either detected with probability dh, or not detected (1-dh). Error detection rate is %h.
• The effects of a non-detected error, resulting from a permanent fault, may be perceived later through their effects on service delivery (rate 'h).
• The repair rate is µh.
The difference between hardware and software nets lies in the fact that for hardware, temporary and permanent faults are differentiated in this model by their respective consequences following activation, whereas for software, they are distinguished after specific processing [23].
The error propagation net is initialized via Prop after firing of transition 1-dh (non-detected error) or of transition 1-ph (an error due to a temporary fault) in the hardware net. With probability 1-pph, the error is not propagated, and with pph, it is propagated. The effect on the software is described via the immediate transitions tp and tn.
Finally, the software stop net is initialized by the marking of place: a) STP following firing of transition dh (detection of an error) or transition "h (perception of a non-detected error) in the hardware net, or b) AR at the end of the hardware repair to enable software restart. The effects on the software
In this example, the availability of the server is computed from the Markov chain corresponding to the reachability graph of the GSPN model. Analytical equations of system availability (such as those given in equations (5), (6) and (7)) cannot be derived easily for this complex model. Usually, tools such as the SURF-2 tool developed at LAAS [6], are used to obtain system availability. The obtained measure is then used in equations (1) to (4) of Section 4 to derive the availability as seen by the users. Clearly, this example illustrates the modeling complexity when detailed assumptions about the hardware and the software are considered.
6. Related work
Our work is related to availability modeling of e-business applications. As far as we are aware of, no previous work addressed specifically this problem using a global modeling approach. The main advantage of our modeling approach is in structuring the e-business application itself in a hierarchical manner that can be modeled following the same hierarchical approach. Also, various measures related to different abstraction levels can be assessed.
Nevertheless, the basic modeling techniques used in our multi-level modeling approach are similar to those used for modeling complex systems. In particular, the primary problem when building availability models for complex systems is related to state explosion. Techniques addressing this problem are of two categories: “largeness avoidance” and “largeness tolerance” [35]. A review of modeling techniques can be found in [1].
Largeness avoidance techniques try to circumvent the generation of very large models by constructing sub-models that can be processed in isolation. The results of the sub-models are integrated into a single overall model that is small enough to be processed. Among them we have the behavioral decomposition technique [5], the hybrid hierarchical technique [4], the data structure technique for the Kronecker solution of GSPNs [12], the method of superposed GSPNs [13] or of the asynchronous communicating modules [10]. Most of these techniques are efficient when the sub-models are loosely coupled.
The main objective of largeness tolerance techniques is to master the generation of the global system model through the use of concise construction methods. The basic idea is to generate models of a modular system by composition of the sub-models of its components. In our previous work, we have defined some such techniques that are referenced all over this paper, and several techniques have been
published by other authors (see e.g., [8, 28, 33]). Roughly speaking, largeness tolerance techniques are recommended when several dependencies do exist between system components, making it very hard to combine the results using a largeness avoidance technique, in a tractable manner.
Our multi-level modeling approach combines the two categories of modeling techniques: it advocates largeness avoidance techniques at the levels where independence or weak dependency assumptions hold, and largeness tolerance techniques for constructing the sub-models that exhibit strong dependencies (in particular at the resource and service levels).
7. Conclusion
The quest for the construction of a dependable electronic business starts with the definition of the eBP architecture and the identification of the internal services as well as the possible external services complementing them. We have defined a multi-level approach for modeling the availability e-business applications, taking into account the infrastructure of the provider site(s), the availability of the external services and the user’s profile. We have shown how to describe and model progressively an eBA.
From a practical point of view, our modeling approach aims at developing independent models, as far as possible, and combine the results. Indeed, even with the proposed approach, large and complex availability models cannot be totally avoided due to the large number of elements and the complexity inherent to e-business systems.
Certainly, we have not covered all topics that need to be addressed when designing an eBP site, but we put emphasis on how to decompose the main problems to solve them in an easier manner than considering all levels at the same time. We have shown the kind of calculations and modeling that are required for the various steps.
In particular in this paper, we have considered the case of a single host with one hardware component and one software component. We did not take into account, e.g., the replication of the servers, the organization of the software replicas on the hardware support or the communication among these replicas. Indeed, it is not easy to illustrate the modeling of such issues on a general case. Currently, we are defining a case study to illustrate the approach. However, we have already some
and control systems [7]) as well as more generic systems (e.g., the GUARD architectures [2] and multipurpose multiprocessor systems [30]). The complexity of the above referenced systems is equivalent to the complexity of eBP site(s), and the dependability modeling techniques that could be used are analogous. In addition, we have applied our multi-level modeling approach to a Web travel agency [19].
References
[1] Arlat J., Fabre J. C., Issarny V., Kaâniche M., Kanoun K., Kloukinas C., Marre B., Marsden E., Powell D., Romanovsky A., Thevenod-Fosse P., Waeselynck H., Welch I., Zakkiudin I. and Zarras A., Dependable
Systems of Systems: State of the Art Survey, DSoS Project, IST-1999-11585, N°LAAS Report N° 00353, September 2000.
[2] Arlat J., Jarboui M. T., Kanoun K. and Powell D., “Dependability Assessment of GUARDS Instances”, in Proc. 4th IEEE International Computer Performance and Dependability Symposium (IPDS'2000), pp.147-158, Chicago (USA), March, 27-30 2000.
[3] Bakos Y., “The Emerging Role of Electronic Marketplaces on the Internet”, Communications of the ACM, 41 (8), pp.35-42, 1998.
[4] Balakrishnam M. and Trivedi K. S., “Component-wise Decomposition for an Efficient Reliability Computation of Systems with Repairable Components”, in Proc. 25th International Symp. on
Fault-Tolerant Computing (FTCS-25), pp.259-268, IEEE Computer Society Press, Pasadena, CA, USA, 1995. [5] Balbo G., Bruell S. C. and Ghanta S., “Combining Queuing Networks and GSPNs for the Solution of
Complex Models of System Behaviour”, IEEE Trans. on Computers, 37, pp.1251-1268, 1988.
[6] Béounes C., Aguéra M., Arlat J., Bachman S., Bourdeau C., Doucet J. E., Kanoun K., Laprie J.-C., Metge S., Moreira de Souza J., Powell D. and Spiesser P., “SURF-2: A Program for Dependability Evaluation of Complex Hardware and Software systems”, in Proc. 23rd IEEE Int. Symp. Fault-Tolerant Computing, pp.668-673, Toulouse, France, 1993.
[7] Betous-Almeida C. and Kanoun K., “Dependability Evaluation From Functional to Structural Modelling”, in Proc. 20th Int. Conf. on Computer Safety, Reliability and Security (SAFECOMP'2001), (U. Voges, Ed.), Lecture Notes in Computer Science 2187, pp.227-237, Springer-Verlag, Budapest, Hungary, Sept. 26-28 2001.
[8] Bondavalli A., Mura I. and Trivedi K. S., “Dependability Modelling and Sensitivity Analysis of Scheduled Maintenance Systems”, in Proc. 3rd European Dependable Computing Conference (EDCC-3), (A. Pataricza, J. Hlavicka and E. Maehle, Ed.), 1667, pp.7-23, Springer, Prague, Czech Republic, 1999.
[9] Bowen N., Sturnam D. and Liu T. T., “Towards Continuous Availability of Internet Services through Availability Domains”, in Proc. International Conference on Dependable Systems and Networks
(DSN-2000), pp.559-566, IEEE Computer Society, New York, USA, 2000.
[10] Campos J., Donatelli S. and Silva M., “Structured Solution of Asynchronously Communicating Stochastic Modules”, IEEE Transactions on Software Engineering, 25 (2), pp.147-165, 1999.
[11] Caswell D. and Ramanathan S., Using Service Models for Management of Internet Services, HP Laboratories Palo Alto, N°HPL-1999-43, March 1999.
[12] Ciardo G. and Miner A., “A Data Structure for the Efficient Kroneker Solution of GSPNs”, in Proc. 8th Int.
Workshop on Petri Nets and Performance Models, pp.22-31, IEEE Computer Society Press, Zaragoza, Spain, 1999.
[13] Donatelli S., “Superposed Generalized Stochastic Petri net: definition and efficient solution”, in Proc. 15th
Int. Conf. on Applications and Theory of Petri Nets, (R. Valette, Ed.), LNCS 815, pp.258-277, Springer-Verlag, 1994.
[14] Ensel C., “Automated Generation of Dependency Models for Service Management”, in Proc. Workshop of
the OpenView University Association (OVUA 1999), Bologna, Italy, June 1999.
[15] Fota N., Kâaniche M. and Kanoun K., “Dependability Evaluation of an Air Traffic Control Computing System”, Performance Evaluation, 35 (3-4), pp.553-573, 1999.
[16] Ingham D. B., Shrivastava S. K. and Panzieri F., “Constructing Dependable Web Services”, IEEE Internet
Computing (February), pp.25-33, 2000.
[17] Iyengar A., Challenger J., Dias D. and Dantzig P., “High-Performance Web Site Design Techniques”,
IEEE Internet Computing (March-April), pp.17-26, 2000.
[18] Kaâniche K., Kanoun K. and Rabah M., “A Framework for modeling the Availability of e-Business Systems”, in Proc. 10th International Conference on Computer Communications and Networks, pp.40-45, IEEE CS, Scottsdale, AZ, USA, 15-17 October 2001.
[19] Kaâniche M., Kanoun K. and Martinello M., “User-perceived Availability of a Web based Travel Agency”, in Proc. International Conference on Dependable Systems and Networks (DSN-2003), Performance and
Dependability Symposium, pp.709-718, IEEE Computer Society Press, San Francisco, CA, USA, 2003. [20] Kalyanakrishnan M., Iyer R. K. and Patel J. U., “Reliability of Internet Hosts: a Case Study from the End
User's Perspective”, Computer Networks, 31, pp.47-57, 1999.
[21] Kanoun K. and Borrel M., “Fault-Tolerant System Dependability — Explicit Modeling of Hardware and Software Component-Interactions”, IEEE Transactions on Reliability, 49 (4), pp.363-376, 2000.
[22] Kanoun K., Borrel M., Moreteveille T. and Peytavin A., “Modeling the Dependability of CAUTRA, a Subset of the French Air Traffic Control System”, IEEE Transactions on Computers, 48 (5), pp.528-535, 1999.
[23] Laprie J.-C., “On the Temporary Character of Operation-Persistent Software Faults”, in Proc. 4th
International Sysmposium on Software Reliability Engineering (ISSRE'93), pp.125, IEEE Computer Society, Denver, CO, USA, 1993.
[24] Long D., Muir A. and Golding R., “A Longitudinal Survey of Internet Host Reliability”, in Proc. 14th
Symposium on Reliable Distributed Systems (SRDS-95), pp.2-9, Bad Neuenahr, Germany, September 1995. [25] Machiraju V., Dekhil M., Griss M. and Wurster K., E-services Management Requirements, HP
Laboratories Palo Alto, CA, USA, N°HPL-2000-60, May 2000.
[26] Maes P., Guttman R. H. and Moukas A. G., “Agents That Buy and Sell”, Communications of the ACM, 42 (3), pp.81-91, 1999.
[27] Menascé D. A. and Almeida V. A. F., Scaling for E-Business: Technologies, Models, Performance, and
Capacity Planning, Prentice Hall PTR, Upper Saddle River, NJ, USA, 2000.
[28] Meyer J. F. and Sanders W. H., “Specification and Construction of Performability Models”, in Proc. Int.
Workshop on Performability Modeling of Computer and Communication Systems, pp.1-32, Mont Saint Michel, France, 1993.
[29] Musa J., Software Reliability Engineering, McGraw-Hill, 1998.
[30] Rabah M. and Kanoun K., “Dependability Evaluation of a Distributed Shared Memory Multiprocessor System”, in Proc. 3rd European Dependable Computing Conference (EDCC-3), (A. Pataricza, J. Hlavicka and E. Maehle, Ed.), 1667, pp.42-59, Springer, Prague, Czech Republic, 1999.
[31] Reibman A. and Veeraraghavan M., “Reliability Modeling: An Overview for System Designers”, IEEE
Computer, April, pp.49-57, 1991.
[32] Rodosek G. D. and Kaiser T., “Determining the Availability of Distributed Applications”, in Proc.
IFIP/IEEE International Symposium on Integrated Network Management, Integrated Network Mangement V, pp.207-218, Chapman & Hall, San Diego, CA, USA, 1997.
[34] Shim S. S. Y., Pendyala V. S., Sundaram M. and Gao J. Z., “Business-to-Business E-Commerce Frameworks”, Computer (October), pp.40-47, 2000.
[35] Trivedi K. S., Haverkort B. R., Rindos A. and Mainkar V., “Techniques and Tools for Reliability and Performance Evaluation: Problems and Perspectives”, in Proc. 7th International Conference on Modeling
techniques and Tools for Computer Performance evaluation, LNCS 794, (L. N. i. C. Sciences, Ed.), pp.1-24, Springer Verlag, Berlin, Germany, Vienna, Austria, 1994.