BEHAVIORAL APPROACH TO ESTIMATION OF SMART CARD HOLDERS SOCIO-DEMOGRAPHIC CHARACTERISTICS IN A PUBLIC TRANSPORTATION
SYSTEM
ANTOINE GRAPPERON
DÉPARTEMENT DES GÉNIES CIVIL, GÉOLOGIQUE ET DES MINES ÉCOLE POLYTECHNIQUE DE MONTRÉAL
MÉMOIRE PRÉSENTÉ EN VUE DE L’OBTENTION DU DIPLÔME DE MAÎTRISE ÈS SCIENCES APPLIQUÉES
(GÉNIE CIVIL) JUIN 2016
c
ÉCOLE POLYTECHNIQUE DE MONTRÉAL
Ce mémoire intitulé:
BEHAVIORAL APPROACH TO ESTIMATION OF SMART CARD HOLDERS SOCIO-DEMOGRAPHIC CHARACTERISTICS IN A PUBLIC TRANSPORTATION
SYSTEM
présenté par: GRAPPERON Antoine
en vue de l’obtention du diplôme de: Maîtrise ès sciences appliquées a été dûment accepté par le jury d’examen constitué de:
Mme MORENCY Catherine, Ph. D., présidente
M. FAROOQ Bilal, Ph. D., membre et directeur de recherche
M. MARTIN Trépanier, Ph. D., membre et codirecteur de recherche M. FLORIAN Daniel, M. Sc. A., membre
DEDICATION
To my roomates Isabelle and Tiphaine. To my friend Guilhem Poucin who is currently sitting and working on his own thesis one meter away from me. To my family. In their own way, they all helped me realize how important it is to challenge myself and to leave my comfort zone. . . .
ACKNOWLEDGMENTS
I have to thank so many people here! But every contribution was needed to make this project what it is. First, I would like to thank my supervisor Bilal Farooq and my co-supervisor Martin Trépanier.
I also have to thank all students from the Smartcard Lab who participated every week to conf calls to share our work: Oscar Egu (ENTPE, France), Matthieu Galvin and Antoine Giraud (Ecole Polytechnique de Montréal, Canada), Ricardo Cubillos, Jacqueline Arriagada, Catalina Espinoza and Felipe Hernandez (University of Santiago du Chile, Chile).
I would like to thank the engineers who gave insights from the industrial world: Gauthier Cornu (Thalès), Graeme O’Brian (Translink, Vancouver). To this list I add Teresa O’Reilly from Translink, Vancouver.
Thank you to all professors from the transportation field in Ecole Polytechnique de Montréal. Thank to their class and presence they helped me developed my interests for transportation engineering: Robert Chapleau, Catherine Morency, Nicolas Saunier, Hamzeh Alizadeh and Pierre Léo Bourbonnais.
Thank you to Anne Elise Basque, librarian at Polytechnic Montreal for being so patient and answering all my questions about databases.
This work was possible thanks to the much appreciated collaboration from Société des Trans-ports de l’Outaouais. It provided the required databases (travel survey and smart card data).
RÉSUMÉ
Les systèmes de collecte automatisée des titres de transport sont utilisés dans de nombreuses villes, le titre de transport est le plus souvent stocké sur une carte à puce (CAP). Ils générent quotidiennement d’importants volumes de données liées à la mobilité des individus. Il devient très intéressant de disposer de méthodes pour pouvoir utiliser ces données car elles présentent le triple avantage d’être exhaustives, longitudinales et directement liées au réseau de transport en commun. En effet, tous les passagers doivent valider leur embarquement (à l’exception des fraudeurs qui s’octroient s’affranchissent de ce devoir), ces données sont recoltées tous les jours de l’année pour l’intégralité du réseau et elles sont liées à un véhicule et une ligne de bus. Il y a de nombreuses applications développées à ce jour: reconstitution des chaînes de déplacements, étude des typologies de déplacements sur le réseaux, étude de la loyauté des usagers, validation des enquêtes de déplacements, identification des maxima de charges sur chaque ligne, étude de l’adéquation de l’offre à la demande, etc.
Pour des raisons de protection de la vie privée, les données de CAP sont pseudonymisées, c’est-à-dire que les informations personnelles incluant les informations socio-démographiques ne sont pas attachées aux enregistrements. Cela explique qu’il y ait peu de travaux de recherche basés sur des donnés de CAP qui impliquent une approche comportementale des usagers des transports en commun. Les travaux qui analysent les comportements des pas-sagers se concentrent sur les habitudes d’utilisation sans jamais pouvoir fournir d’analyse en profondeur de ces habitudes par manque de variables socio-démographiques. De nombreuses attentes liées aux données CAP nécessitent d’avoir accès à ces informations: validation ou complétion des informations provenant d’enquêtes déplacements, analyse avant-après des nouvelles politiques tarifaires ou de tout autre changement sur le réseau, adaptation du ser-vice à la clientèle, etc.
La question de l’enrichissement des données de CAP avec des données d’enquêtes de déplace-ment a déjà été posée sans que des réponses ne soient apportées. Il s’agit d’un problème très délicat notamment car il s’agit de deux jeux de données évoluant dans des dimensions radi-calement différentes: les données de CAP ont une grande richesse temporelle mais une grande pauvreté d’information socio-démographique alors que les enquêtes déplacements présentent la caractéristique inverse. L’objet de cette maîtrise est de proposer une méthodologie perme-ttant d’attacher des informations socio-démographiques aux données de carte à puce et de l’appliquer à un cas concret, tout en considérant les questions éthiques liées à la vie privée des usagers.
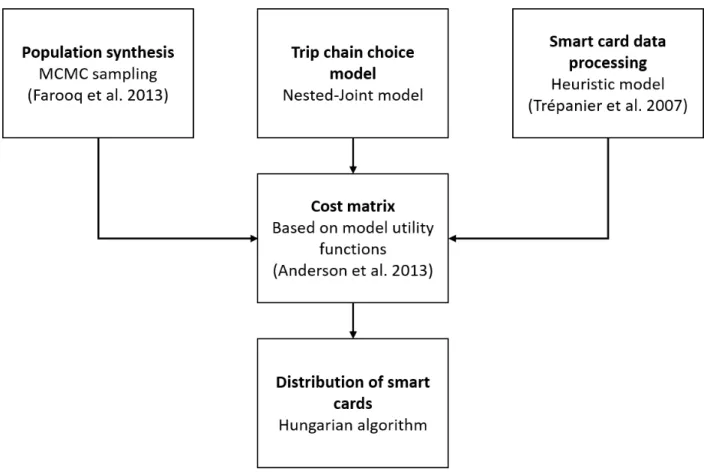
La méthodologie qui a été dévelopée repose sur trois hypothèses simples. La première est que les individus accédent au transport en commun à pied et par conséquent qu’ils embarquent dans le réseau de transport en commun à un arrêt situé proche de leur lieu de vie. L’arrêt le plus fréquement utilisé au début de la chaîne de déplacement est défini comme l’arrêt le plus proche du lieu de vie. La deuxième hypothèse est que les caractéristiques socio-démographiques des individus ont une influence forte sur leur choix de mobilités. La troisième et dernière hypothèse est que la tarification en vigueur est parfaitement comprise par les usagers qui se comportent alors en agents rationnels et choississent la solution la moins coûteuse. La méthodologie nécessite deux étapes préliminaires avant une troisième étape d’enrichissement des données de CAP.
La première étape préliminaire consiste à réaliser une synthèse de population avec la propriété d’être la plus précise possiblement spatialement. Ceci est réalisé à l’aide d’un échantillonage par Chaîne de Markov Monte Carlo (dans notre cas: un échantillonneur de Gibbs) qui per-met de fusionner plusieurs sources d’information disponibles à plusieurs niveaux d’aggrégation différents. Les résultats de cette étape sont contrôlés spatialement à l’aide de statistiques tra-ditionnellement utilisées: l’erreur totale absolue (TAE), l’erreur standardisée absolue (SAE) et la racine carrée de la moyenne des erreurs au carré (SRMSE). Cette étape donne des résultats précis spatialement.
La deuxième étape préliminaire consiste à développer et calibrer un modèle de choix discret de chaîne de déplacement à l’aide de l’enquête de déplacement. Dans notre cas, le modèle développé est basé sur une structure emboîtée-jointe. La première couche est le choix du mode et la seconde couche du nid est le choix de la chaîne de déplacement. Le modèle est calibré sur 80% de l’enquête déplacement à l’aide du logiciel Biogeme et il est validé à l’aide des statistiques habituelles et par simulation sur 100% des données de l’enquête déplacement. Ce modèle a de bonnes statistiques et donne des résultats pouvant être fortement améliorés. L’étape d’enrichissement des données de CAP utilise toutes les hypothèses: les données de CAP sont analysées et préparées afin d’identifier la zone géographique où habite, pour chaque carte, le détenteur de la carte; et afin d’identifier le type de chaîne de déplacement qui a été réalisée. Les chaînes de déplacement sont décrites à l’aide de quatre attributs: la fidélité aux services de la STO, l’heure du premier départ (avant, pendant ou après l’heure de pointe du matin), l’heure du dernier départ (avant, pendant ou après l’heure de pointe du soir) et le nombre moyen d’activités journalières. Ensuite, pour chaque zone géographique, le modèle de choix de chaîne de déplacement est appliqué à la population locale avec pour alternatives les CAP qui ont été localisées dans la même zone spatiale. La solution la plus probable est alors calculée à l’aide de l’algorithme Hongrois.
L’application de cette méthodologie repose lourdement sur le concept de modélisation orientée-objet implémentée en JAVA. Le code est rendu public et disponible en ligne. Ne disposant pas de la possibilité de valider notre méthode à l’aide de la vérité, nous procédons à des val-idations partielles sur la capacité de la méthodologie à reproduire la population empruntant les transports en commun au niveau de la ville et à un niveau local. Le processus de distribu-tion des cartes à puce à la populadistribu-tion est réalisé de quatre façons différentes. Premièrement de façon totalement aléatoire. Deuxièmement en utilisant l’hypothèse de géolocalisation des cartes à puces. Troisièmement en utilisant la localisation des cartes à puce et le modèle de choix de chaine de déplacement. Et quatrièmement en utilisant, en plus, la tarification comme moyen de s’assurer de distribuer les cartes à puce à quelqu’un qui a la bonne catégorie d’occupation. Les résultats montrent une nette amélioration par rapport à une affectation aléatoire d’attributs socio-démographiques et la part de chaque hypothèse dans cette amélio-ration est estimable. Le modèle de choix de chaîne de déplacement est un élément clef de notre méthodologie, cependant pour notre cas d’étude nous bénéficions d’une enquête dé-placements présentant peu d’atouts de compatibilité: une part modale très faible pour le transport en commun et aucune dimension de longitudinalité.
Pour validation, nous vérifions que les distributions des divers attributs (âge, genre, oc-cupation, nombre de personnes dans le ménage, nombre de véhicules) correspondent aux distributions observées lors de l’enquête origine-destination. Au niveau global, la distribu-tion de l’âge est le meilleur exemple de la complémentarité des trois hypothèses appliquées. Par exemple, pour la catégorie d’âge 11 à 19 ans, l’enquête OD prévoit 6 000 passagers de la STO. Une affectation aléatoire des cartes à puce aboutit à 3 200, l’hypothèse de localisation des cartes à puce aboutit à 3 500, le modèle de choix de chaîne de déplacement permet de passer à 5000. Utiliser les trois hypothèses permet de monter à 5 600 passagers. On passe de 50% à 93% de la population réelle. Ceci est l’exemple le plus parlant mais la même dy-namique se retrouve pour les autres catégories. Il est à noter que la dydy-namique est plus forte pour la distribution de l’âge car l’effort de modélisation a principalement porté sur l’âge. Il est impossible de valider notre travail au niveau local car l’enquête déplacements ne fournit pas d’information suffisamment précise. La cohérence de la distribution jointe des attributs socio-démographiques est étudiée à l’aide de la valeur de la racine carrée de la moyenne des écarts aux carrés (SRMSE). On note que seule l’application des trois hypothèses permet de diminuer cette erreur de 2.410 à 2.280.
La méthodologie proposée est complexe et comporte de nombreuses sources d’erreur qui vi-ennent s’accumuler. Chaque élément de la méthodologie peut être contrôlé et l’élément clef de la méthode repose sur une bonne qualité des données, notamment de l’enquête déplace-ments, ainsi que sur un bon taux de pénétration de la CAP comme titre de transport. La
méthode pourrait être adaptée pour des systèmes de transport où le taux de pénétration des cartes à puce n’est pas optimal au prix d’un modèle de possession de la CAP. En l’état, la méthode a prouvé fournir des résultats encourageants mais nécessite cependant plus de travail au niveau du modèle de choix de chaîne de déplacement et surtout au niveau de la validation. Les sources d’erreur sont principalement a) dues aux données, b) dues aux divers modules utilisés qui apportent chacun son lot d’erreur et c) dues aux hypothèses faites qui sont simplificatrices.
ABSTRACT
Automated Fare Collection (AFC) systems such as smart cards are being used in many differ-ent cities and countries. The AFC systems leverage large volume of data related to person’s mobility and it becomes very interesting to develop methods to use these data to complement other data sources. They present four main advantages, they are longitudinal, they concern every public transit user (within the limitation of the penetration rate of the smart card and the policy around shared smart card ownership), they are passively leveraged and they are directly related to the public transit structure. There are already many applications such as processing the trip chain, study of public transit users loyalty and behaviour, validation of travel surveys etc.
For privacy concerns, smart card data is anonymised and any socio-demographic data is lost. This explains why there are so few research based on smart card data, which involve a behavioral analysis of public transit users. They usually focus on travel habits and have no explanatory power. There are many expectations for smart card data which require to have access to socio-demographic information.
Enriching smart card data to the smart card owner level has already been highlighted as a key aspect of smart card data theory. However it is a very delicate problem since smart card data and travel survey evolve in two different spaces. Smart card data have very rich temporal information but poor socio-demographic information, while travel survey is the opposite. The goal of the research is to develop a methodology to fuse these two datasets while minimizing the introduction of any bias.
The work is developed based on three hypothesis. First, people access public transit by walk-ing and therefore live in the neighborhood of their main station. Second, socio-demographic attributes are key to mobility choices of individuals. Third, everyone understands the fare policy and chose the most cost efficient solution. The methodology requires two steps of preparation.
First of all we realize a population synthesis using a Gibbs sampler to draw agents directly from the underlying distribution. It allows to fuse several data sets. This step is validated using classical population synthesis validation techniques such as Total Absolute Errors, Standardized Absolute Errors and Square Root Mean Squared Errors. We validate our methodology at the most spatially accurate level: dissemination area.
model is calibrated on 80% of the data and simulated on 100%. We use traditional discrete choice modeling stats to help use develop our model. The model was estimated using the Biogeme software. Our model has a nested-joint structure. The upper nest is the mode choice and the lower nest is the trip chain choice.
Finally we process smart cards. They are enriched to the level of trip chain by identifying alighting stops and computing daily average statistics such as first departure hour, last de-parture hour, usage of public transit, number of activities over week-days. Then we assign a synthetic agent to each smart card using the model to find the most probable solution. The implementation of this methodology relies heavily on the Oriented Object Modeling concept. A Java code was developed and is available online. The methodology was not validated against ground truth (microscopic validation) but against reported truth at the city level (macro validation) and at a more local level (mesoscopic validation). Results show that our methodology provides better results than a random distribution of attributes. The trip chain choice model is a key element to our methodology, but in our case study it was also the main source of errors. Results are validated against distributions. For instance, at the macroscopic level, for age category 11 to 19 years old, the OD survey registered 6 000 STO riders. While giving randomly smart cards to the population, we have 3 200 STO riders (approximately 50% of the real population). While using the spatial location of smart cards, we have 3 500 STO riders. While using, in addition, the trip chain choice model, we have 5 000 STO riders. And eventually, while using the hypotheses, we find a population of 5 600 STO riders (approximately 93% of the real population). This is the most encouraging result, however, similar trends can be found on other categories and attributes. It has to be noted that age category was also a key aspect of the trip chain choice model, therefore we were expecting to get better results for this attribute. The mesoscopic validation could not be achieved because the smart card data and the travel survey data are not mutually consistent at the local scale.
The proposed methodological framework is complex and induces many sources of errors. It could be improved especially by modeling smart card owners from non smart card owners.
TABLE OF CONTENTS DEDICATION . . . iii ACKNOWLEDGMENTS . . . iv RÉSUMÉ . . . v ABSTRACT . . . ix TABLE OF CONTENTS . . . xi
LIST OF TABLES . . . xiii
LIST OF FIGURES . . . xiv
LIST OF ALGORITHMS . . . xvi
LIST OF ACRONYMS AND ABREVIATIONS . . . xvii
LIST OF APPENDICES . . . xviii
CHAPTER 1 INTRODUCTION . . . 1
1.1 Motivation of Research . . . 1
1.2 Dimensions of the problem . . . 3
1.3 Research objectives . . . 4
1.4 Structure of the thesis . . . 5
CHAPTER 2 STATE OF THE ART . . . 6
2.1 Automated Fare Collected data in the public transport system . . . 6
2.2 Destination and activity inference methods . . . 6
2.3 Expectations from AFC data . . . 8
2.4 Limits to smart card studies . . . 11
2.5 Population synthesis . . . 12
2.6 Trip chain choice model . . . 14
CHAPTER 3 METHODOLOGY . . . 16
3.1 Context . . . 16
3.1.2 Origin-Destination survey . . . 17
3.1.3 Canadian census . . . 18
3.1.4 Public Use Microdata Sample . . . 18
3.2 The broad picture . . . 18
3.3 Enriching smart card data to the trip chain level . . . 23
3.4 Population synthesis . . . 25
3.5 Trip chain choice model . . . 30
3.6 Solving the association problem . . . 37
3.7 Validation . . . 40
CHAPTER 4 CASE STUDY: GATINEAU . . . 42
4.1 Population synthesis . . . 42
4.2 Trip chain choice model . . . 51
4.3 Association . . . 62
4.3.1 Macroscopic validation . . . 63
4.3.2 Mesoscopic validation . . . 65
4.3.3 Validation of the internal consistency of the socio-demographic dimension 67 CHAPTER 5 CONCLUSION . . . 69
5.1 Summary . . . 69
5.2 Limitation . . . 70
5.2.1 Computational requirement . . . 70
5.2.2 Smart card data . . . 70
5.2.3 Population synthesis limitation . . . 71
5.2.4 Trip chain choice limitation . . . 71
5.2.5 Association limitation . . . 73
5.2.6 Summary of sources of errors . . . 74
5.3 Future work . . . 76
REFERENCES . . . 77
LIST OF TABLES
Table 3.1 Problem dimensions. . . 19
Table 3.2 Description of attributes to synthesize . . . 28
Table 3.3 dataset source for attributes distribution (DA: dissemination area, CMA: census metropolitan area) . . . 29
Table 3.4 Description of choice attributes . . . 32
Table 4.1 General statistics for the trip chain choice model . . . 55
Table 4.2. Parameters and statistics of trip-chain choice model . . . 55
Table 4.3 Confusion matrix of the trip chain choice model . . . 59
Table 4.4 Square Root Mean Standard Error results for the joint distribution of age * gender * occupation * number of cars * household size. . . 66
Table 5.1 Sources of errors . . . 75
LIST OF FIGURES
Figure 2.1 The alighting location estimation model for “normal” and “last” trips.
Source: Trépanier et al. (2007) . . . 8
Figure 2.2 Illustration of the working of Gibbs sampler. Source: Farooq et al. (2013a) . . . 14
Figure 3.1 The bus stops of the STO’s network. . . 17
Figure 3.2 Decomposition of a trip chain. . . 19
Figure 3.3 The three stages of the methodological framework. . . 21
Figure 3.4 Work flow of the methodology. . . 22
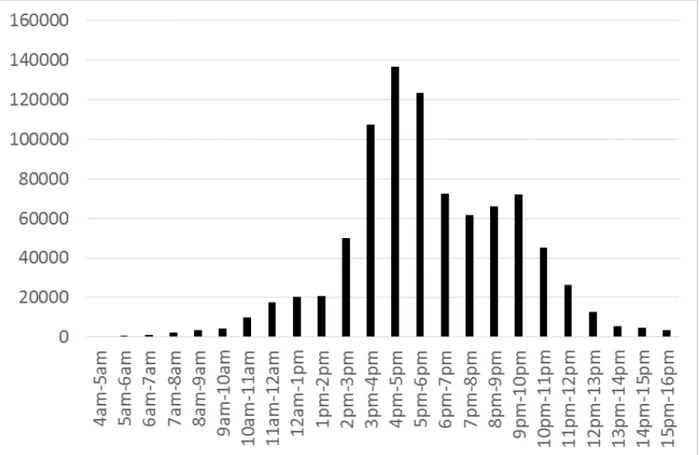
Figure 3.5 Number of first departure hours observed in the OD survey. . . 32
Figure 3.6 Distribution of last departure hours observed in the OD survey. . . . 33
Figure 3.7 Nested joint model structure. . . 35
Figure 3.8 Implemented nested joint model structure. . . 36
Figure 4.1 SAE for age category 2 (25 to 34 years old) at local level. . . 44
Figure 4.2 TAE for age category 2 (25 to 34 years old) at local level. . . 45
Figure 4.3 SAE for gender female at local level. . . 46
Figure 4.4 TAE for gender female at local level. . . 47
Figure 4.5 SRMSE for age distribution. . . 48
Figure 4.6 SRMSE for gender distribution. . . 49
Figure 4.7 SRMSE cumulative distribution for age . . . 50
Figure 4.8 SRMSE cumulative distribution for gender. . . 50
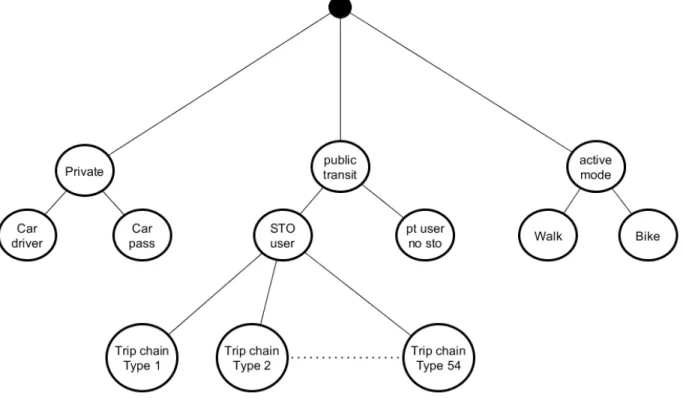
Figure 4.9 Occupation share for each choice, data: OD survey 2005. The format is C_PTusage_FirstDep_nAct_LastDep (more thorough description in Table 3.4. It is also sorted from the most frequent choice (up) to the least frequent choice (bottom). . . 52
Figure 4.10 Distribution of the most frequent choices in the travel diary survey. . 53
Figure 4.11 Marginal distribution of age, gender, occupation, household size and number of cars observed in the OD survey. . . 60
Figure 4.12 Marginal distribution of age, gender, occupation, household size and number of cars simulated for OD survey agents. . . 61
Figure 4.13 Local population sizes (blue) and count of local smart cards (red) around bus stations. . . 63
Figure 4.15 Marginal distributions of age, gender, occupation, household size and number of cars for distributed smart cards. . . 65 Figure 4.16 Geographical area selected for mesoscopic analysis of the results . . . 67 Figure 4.17 Local marginal distributions of age, gender, occupation, household size
and number of cars for distributed smart cards. . . 68 Figure A.1 UML diagram of the distribution of smart cards to synthesized agents. 87 Figure A.2 UML diagram of the application of the trip chain choice model to agents. 88
LIST OF ALGORITHMS
1 Destination inference heuristic. . . 24 2 Gibbs Sampling using local distributions when possible. This is following
Fa-rooq et al. (2013b) methodology. . . 26 3 Assigning smart cards to the synthetic population. . . 39
LIST OF ACRONYMS AND ABREVIATIONS
AFC Automated Fare Collection AVL Automated Vehicle Location
CAP Carte à puce
CMA Census Metropolitan Area CPM Computer based model DA Dissemination Area
ENTPE École nationale des travaux publics de l’état FAMOS Florida Activity MObility Simulator
GPS Global Positioning System
Id Identifier
ILUMASS Integrated Land Use Modeling And transportation System Simulation ILUTE Integrated Land Use Transport Environment
IPF Iterative Proportional Fitting LUTI Land Use Transport Integrated MCMC Monte Carlo Markov Chain OD Origin-destination
PUMS Public Use Microdata Sample RAM Random Access Memory SAE Standardized Absolute Errors SRMSE Square Root Mean Squared Errors STO Socitétée des transports de l’Outaouais TAE Total Absolute Errors
TASHA Travel Activity Scheduler for Household Agents
LIST OF APPENDICES
Appendix A UML diagrams . . . 87 Appendix B Full confusion matrix . . . 89
CHAPTER 1 INTRODUCTION
Automated fare collection (AFC) systems in public transit networks are leveraging important amount of data for ticketing purposes. However these kind of data are currently being used to answer many other problems related to transportation management and planning. However AFC systems were designed for ticketing purposes and the data it is producing lacks socio-demographic characteristics and has to be processed. Actually, one of the key topic related to AFC data is to develop methods to enrich it and make it understandable.
1.1 Motivation of Research
The classic way to accomplish strategic and operational planning for a public transit opera-tor and urban planners is through travel surveys and on-board surveys. They are interesting datasets since they include comprehensive socio-demographic information about the respon-dents. They are designed to fulfill most of the data needs that operators and planners can have, they have information about all modes, the trip chain constitution and intra-household interactions. For the same area, they are often conducted every five to ten years using each time a similar or compatible methodology, which insure a reasonable consistency of data through time. They can be used to do aggregated or disaggregated analysis, forecasting analysis, policy analysis etc. They are also used to calibrate models. However this kind of survey presents many downfalls. The sampling strategy is traditionally a random sample amongst the population which own a land line. However some part of the population is not reachable through land line, especially young adults who are more likely to own a cell-phone than to have a land line. Also there is a growing increase of non-response rate to surveys due to commercial surveys that saturated the market. In addition to this sampling problem, land-line based survey are getting information from a proxy respondent; usually an adult from the household (mother or father) answering for the whole family which induces an important bias. See Stopher and Greaves (2007),Fink (2012),de Dios Ortúzar and Willumsen (2011) and Bayart and Bonnel (2015) for a more detailed literature about survey’s data limitations. Surveys are really expansive and laborious to produce and validate (Chapleau et al., 2008) and they represent only an average day for a sample of the population. Innovative surveying techniques are being developed in order to overcome those issues. For example by using a mix of land-line survey with web surveys (de Dios Ortúzar and Willumsen, 2011) (Bayart and Bonnel, 2010), or by assisting the reporting process with a GPS and a computer (Stopher and Greaves, 2007). However some researchers are wondering if it is reasonable to hope to
fulfill our data needs through surveys (Axhausen, 1998). It seems especially improbable to capture the longitudinality of mobility behaviors since the MobiDrive project of leveraging mobility data over six weeks (see Axhausen et al. (2002)) shown that there is a high rate of people dropping off of the study since it was to exhausting. And this cannot be conducted at city scale.
Automated fare collection (AFC) systems in public transit such as smart cards are now being used in many different cities and countries. The AFC system gathers a massive volume of transaction information and recently, making sense out of this data has become a research hot topic. It is an interesting dataset for three main reasons a) it is not a sample since all the public transit riders are recorded (with respect to the smart card penetration rate and the amount of free riders)(Bagchi and White, 2005), b) it is longitudinal data: it captures the temporal evolution of riders behaviors, and c) it is tied to detailed transit operational data (Bagchi and White, 2004; Chapleau et al., 2008). These three advantages allow researchers to perform various types of studies, among them: finding the maximum load, analyzing public transit users loyalty and behavior, looking for hardware failure through the data being produced, assessing whether the supply is matching the demand in the best way possible, analyzing transfer time etc. However AFC data presents drawbacks as well. A major one is that not every public transit user owns a smart card, some of them may still use tickets paid with money, therefore it is hard and quite impossible to consider them in the analysis, which mitigates the value of the analysis. The penetration rate is an important value to control, while doing analysis using smart card data. To achieve a good potential, the smart card data has to meet some requirements. For each transaction it has to be linked to a fare type, a location, a time stamp and operational information (vehicle ID, route ID). Often transportation system are tap-in only and do not require a tap-out, therefore only trip origins are known. Finding the alighting location was a topic for many research papers (Trépanier et al., 2007; Chu, 2010; Munizaga and Palma, 2012; Nassir et al., 2015) and although the theory is quite strong on this field, it still produces some errors. The other lacking dimension to smart card data is the socio-demographic dimension. For ethical reasons, smart card data is anonymized and it is not likely to change (Cottrill, 2009). Therefore behavioral analysis of smart card data remain to the level of describing the use of the smart card (loyalty analysis, mobility patterns), but do not provide any explanatory power.
To make the best use of AFC datasets, there is a need to enrich them with socio-demographic information (Pelletier et al., 2011) since these kind of attributes are key to understand in-dividual’s mobility (Bayart et al., 2009). In some AFC system, the fare policy can be very detailed and offer a good granularity to attach some information (usually: adult, student, senior). In a few cities, personal information about smart card owner was known. For
in-stance Viggiano et al. (2016) had access to home address of smart card owners and they used it to study access time to public transport. Munizaga et al. (2014) had access to a small sample of smart card users socio-economic characteristics and they validated destina-tion and purpose inference methods. To the best of our knowledge, the only work that was done to attach socio-economic attributes to smart cards can be found in Trépanier et al. (2012): for each transit rider, they estimated living neighborhood and attached attribute’s spatial average to the smart card holder. There is the underlying assumption that everyone in the neighborhood has the same probability to use public transit. This is not satisfactory since socio-demographic attributes have a significant impact on mode choice. We propose a methodology to infer socio-demographic attributes to smart cards mainly based on the anal-ysis of the smart card data. We choose this approach confidently since destination inference methodologies are rather reliable (Munizaga et al., 2014) and smart card allows to make a rather detailed analysis of public transit riders (Ortega-Tong, 2013). The methodology consists in calibrating a trip chain choice and applying it on a synthetic population with a choice set constituted of trip chains observed through the AFC system.
1.2 Dimensions of the problem
People’s mobility can be described at various level of details. The shortest element is the trip stage (Bagchi and White, 2005; Chakirov and Erath, 2012): it is accomplished in a single vehicle (walking being considered as a vehicle), from a boarding location to a destination location. The trip is the succession of trip stages from an activity location to another activity location (Meyer and Miller, 2001; Bonnel, 2002). We consider that waiting for a connection at a bus station is not an activity. The trip chain is the collection of trips accomplished during a day (Meyer and Miller, 2001; Bonnel, 2002). It can be as simple as going from home to work, then going back home; or it can be a complex trip chain including multiple activities and sub-tours. The mobility pattern of an individual is all his/her trip-chain put together over periods of time longer than one day (Adler and Ben-Akiva, 1979). The temporal frame of a mobility pattern has various scales, it can be daily, weekly or seasonal. The interest for weekly mobility patterns rely on the assumption that daily travel behavior presents variation along the week (Cui et al., 2014) because activities can be scheduled on various days of the week. However we expect people to follow a weekly schedule. The interest on seasonal mobility patterns relies on the assumption that travel behaviors changes according to the seasons (Morency et al., 2007).
Our case study is the STO public transit network in Gatineau (Canada), October 2005. This case study is potentially a really good study since the smart card system was already installed
for a few years and it is providing the highest level of information: fare, boarding station, vehicle ID and time stamp. The local travel survey and the Canadian national census were held during the same time window, therefore we can consistently use all this information. Conceptually, there are four dimensions in our datasets: the time dimension, the spatial dimension, the socio-demographic dimension and the mobility choice dimension. We need to get the best information on each dimension. Information about the Gatineau population is available at various spatial scales and we need to be able to consider the most detailed spatial information while considering less detailed information as well. The enrichment over spatial dimension is reached using the most spatially accurate information from the Canadian census. Census includes a rounding process which may reduce the precision of our process. The enrichment over time is achieved through the fusion with smart card data. The enrichment on socio-demographic dimension is achieved through fusion of the travel survey and census data.
There are already techniques to fuse information from travel survey data and census data, but to the best of our knowledge there is no data fusion techniques able to fuse information from travel survey data, smart card data and census data. Data fusion challenges between transportation related datasets were described in Bayart et al. (2009) and in Venigalla (2004). Examples of data fusion between actively collected datasets were given: fusion of travel surveys conducted with various methodologies (web based surveys, land line based surveys) and fusion of travel surveys with census data. However, to the best of our knowledge, nothing was done to fuse actively collected data (surveys) with passively collected data (smart card data or other). It requires to define a framework and describe the methodology. Our methodology is using many components from well known theoretical area such as population synthesis, activity choice model, smart card data processing and graph theory.
1.3 Research objectives
The goal of this work is about developing further the existing theory on enrichment of smart card and proposing a methodology to attach socio-demographic attributes to smart cards while respecting the due privacy of smart card owners. The global project could be seen as an information fusion approach of multiple datasets evolving in various dimensions.
The first step is to understand those datasets: their structure, their strength, their weaknesses and the sources of errors that are induced. The literature review has to cover those points. A state of the art of the research done using AFC data is important to understand what are classic uses of smart card data and how it can help reaching our goal. Then we have to build
a broader understanding of the mobility data through behavioral description.
The main goal of this research is to develop a methodology to attach socio-demographic attributes to smart cards. This has to be done in the global transportation framework that we have described by assembling various pieces of theoretical knowledge. Therefore it is not expected to use classical information fusion techniques but to come up with one specific to the transportation field. The methodology has to be described using theoretical concepts so it can be applied to any case study. It has to be applied to the specific case study of Gatineau (Canada) and the way to apply it has to be described and understandable. Its benefits/limits have to be expressed and analyzed based on the case studyd.
1.4 Structure of the thesis
The thesis layout is as follow. The state of the art section has many subsections. The first three are describing the AFC data theoretical environment: how the data is leveraged, the latest developments in use of AFC data and the expectations for AFC data. Then the methodology section introduces our methodology: first the context is described, then the theoretical description of the methodology is given, then every methodological model required to reach a practical implementation of the methodology is described: a) enriching smart card data to the trip chain level b) generating a synthetic population c) calibrating a nested-joint model for trip chain choice d) assigning observed trip chains to the synthetic population. The third section presents the results of our experiments which are based on one month of AFC data from the STO. The fourth and last section summarizes and concludes this thesis and discusses the future directions.
CHAPTER 2 STATE OF THE ART
This section covers the literature related to our problem. The first four subsections introduce AFC systems as well as a literature review of uses of smart card data. The fifth subsection gives an overview of activity choice model’s variety with a special focus on joint models. The sixth subsection is dedicated to population synthesis.
2.1 Automated Fare Collected data in the public transport system
The use of a smart card or any other medium (smart phone for example) in an AFC system is quite simple: when the rider hops in a vehicle of the system, he validates his own boarding by placing his smart card on a smart card reader. The card checks if the rider is allowed to board, with respect to the faring policy, and register the transaction in the system (Pelletier et al., 2011). There is some heterogeneity among AFC systems and the accuracy of the data that is being produced (Erhardt, 2016). Bagchi and White (2004) identify five dimensions to this heterogeneity: a) time information, b) purchase information (type of ticket, price etc), c) structural information (transportation mode, line, direction), which are systematically being recorded, d) the spatial information which is not systematically being record since it requires that the vehicle fleet is equipped with an Automated Vehicle Location (AVL) system, and e) the rider’s personal information which may exist but are never displayed due to privacy concerns.
AFC systems produce data about complete disaggregated individuals mobility. There are some limitations to the accuracy of this kind of data. It can be affected by hardware failures, bus overload situations, driver’s mistake etc, and it needs methods to be able to detect them and handle them (Chu, 2010). Many public transit faring systems that include a smart card system also include paper tickets and cash as a way of boarding. This kind of boarding is less interesting since they cannot be linked to one another and the behavioral dimension of trip chaining is lost. Therefore the penetration rate of the smart card in the public transit rider population may be a limitation to the use of the data (Erhardt, 2016).
2.2 Destination and activity inference methods
In some faring system, only a tap-in when boarding is required: the AFC system grants the authorization to board or otherwise. Inferring the alighting has been a major issue for the past few years. The main methodology to do so is a rule-based approach fully detailed in
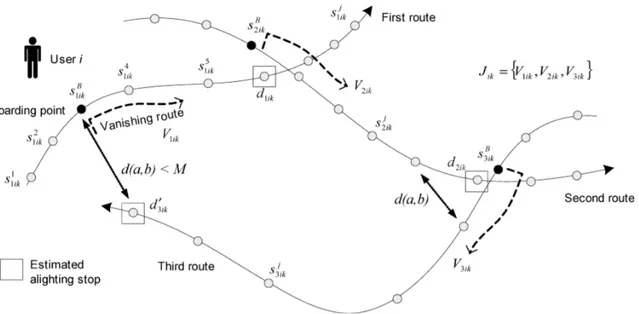
Trépanier et al. (2007) (see figure 2.1, for further details) which adopts an comprehensive approach of the trip chain structure. The vanishing route (Trépanier et al., 2007) is the sequence of stops where the user can alight after his boarding. For an individual, if the next boarding is close to the vanishing road of the bus he is in, then it is considered that he hops off the bus at the closest station of its next boarding, provided there is one within a walkable range. It has been applied in Gatineau, Canada (Trépanier et al., 2007), Santiago, Chile (Munizaga and Palma, 2012) (with improvements to be able to consider that a bus route can be very tortuous or buckles on itself), Brisbane, Australia (Alsger et al., 2015). This methodology lets some unlinked trips and He and Trépanier (2015) proposed an improvement using a kernel density estimation on the historical data of the smart card. This idea of using travel habits to infer more destinations is also explored in Kieu et al. (2015). Zhao et al. (2007) partially validated a similar methodology verifying counts at an aggregate level and at the trip stage level. Later Munizaga et al. (2014) validated this approach using a sample of 601 random public transit riders who accepted that their smart cards be identified. Their reported mobilities were compared with the mobilities processed through the data produced by their smart cards. Results are: for boardings, 98.9% locations were right (small AVL errors due to the GPS system). 84.2% of alighting locations were successfully estimated. Route choice within the Metro system were good for 85%. These are very good results, and the article also provides a list of reasons why the alighting estimation failed. This article is very valuable to research on smart card data since previous research rarely include a validation step because there is no datasets which would allow it. Some faring system are distance based, or include a zone faring policy which requires from the rider to tap-in when he boards and to tap-out when he alights such as Singapore (SBS, 2016) or London’s pay-as-you go system (England) (TfL, 2016).
Knowing alighting location (through inference methods or through tap-out data) does not mean that the activity location is known, some of the trip leg’s destination can be a place to wait for a different bus line (connection trip). Knowing activity location allows the production of indicators that are demand oriented (similar as those drawn from travel surveys), such as average trip length (Trépanier et al., 2009), and to study point of interests and transfer stations (Chapleau et al., 2008). Therefore, more work is required to find activity location. Chakirov and Erath (2012) proposed and compared two approaches: a rule based approach and a modeling based approach. The methodologies were applied on AFC data from a system that demand tap-in and tap-out (the AFC system from Singapore). The rule based approach consists in studying the time interval between an alighting and the next boarding and setting a time threshold: activities lasting 6 hours to 16 hours are labeled work purpose and activities lasting 1 hour to 5 hours are labeled ’other’ purpose. The rule based approach has the main
Figure 2.1 The alighting location estimation model for “normal” and “last” trips. Source: Trépanier et al. (2007)
issue of being blind to short activities and to set similar threshold for all users even though the behavior heterogeneity is known (Ortega-Tong, 2013). The rule based approach was later reproduced, adapted and validated on other case studies (Devillaine et al., 2012) and validated against reported and ground truth (Munizaga et al., 2014). On the other side, the modeling approach relies on multiple discrete choice models for activity duration, activity start time, destination’s land use. It enables a more comprehensive approach, however it was demonstrated using very simple models. As noted in the article the model was calibrated on a data set including other modes than public transit trips but no mode choice modeling was done, and it did not include any socio-demographic variables which may seem as a limitation for a behavioral choice model. Some papers adopt a data fusion approach of AFC data and travel survey data relying on Bayesian methods (Kusakabe and Asakura, 2014; Zhong et al., 2014). This approach enables a great granularity of purposes however the results proved the method to be efficient only for the same kind of trip purposes than for the rule based approach (it makes a difference between long and short activities). In addition it was not validated against reported truth nor ground truth.
2.3 Expectations from AFC data
Expectations from AFC data can be categorized in three layers: strategic planning, tactical and operational (Trépanier et al., 2007). The strategic level is long term planning, since
smart card is longitudinal, it allows a better behavioral understanding of smart card users. Studies were conducted to characterize and classify smart card users. Agard et al. (2006) propose a clustering approach of the smart card data from Gatineau (Canada). They are able to identify four groups of smart card users based on departure hours of each trips stage. They also show that their clusters composition is quite stable through time even though their work do not ensure that single smart card are persistently attributed to the same cluster. It is though reasonable to think so. Ortega-Tong (2013) went way further: on London public transportation system, she considered many classic travel dimensions to characterize and classify smart card users; such as journey start time, travel distance, activity duration, fare, public transport mode choice. She also made good use of the longitudinality of the AFC data set by working with average values differentiated between week days and week ends, and by including dimensions such as travel frequency and origin-destination frequency to her clustering work. She was able to differentiate and identify up to eight clusters and the week day/ week end differentiation proved to be highly important. Clusters were validated using the intra-cluster variance analysis. She also found out that within the public transportation system, the mode choice was not homogeneous: some people would rather like staying away from the metro while other would rather like using the metro. However these clustering approaches are really limited to describe travelers. First, there are very few variables to describe clusters since AFC system does not record socio-demographic attributes other than the fare charged. Secondly the number of clusters found during the clustering process (either arbitrary defined or analytically found) is limiting the granularity available to describe the travelers. A discrete choice modeling approach will provide a better understanding of public transit travelers. Chapleau (2013) studied and characterized seasonal variability of public transit use. He compared summer and fall through demand and frequency distribution of a fare product. He found significant differences. The longitudinality of smart card data is a very important point to use since the Mobidrive project (Axhausen et al., 2002) proved that there is variation of behaviors over time. On the other side accomplishing a trip diary survey over many weeks is even more complex than doing a regular one-day survey since it has the same kind of biases and it includes a fatigue effect for reporting as well. By studying smart card data, more exotic results were found by doing smart card data analysis: studying Singapore, Chakirov and Erath (2011) found out that in some cases the value of the certainty to get a seat is highly important in the decision making process. All these studies give a better understanding of public transit riders and enable public transit riders to adapt their supply and their faring policy to their users. Trépanier et al. (2012) specifically studied smart card users loyalty. It is also expected that smart card can be used to control travel surveys validity. Spurr et al. (2014) point out that travel surveys mislead to consider bad demand estimation.
They compared public transit use estimated from the Montréal (Canada) travel survey to the observed public transit use (through smart card data) and found out underestimations and over estimations up to 20%. In a later paper (Spurr et al., 2015) the same authors proposed a heuristic methodology to match smart cards to their owners when they were interviewed for the travel survey. Their methodology provided results for approximately 50% of the population that were surveyed/ However, there was no validation against ground truth. Then they individually compared reported mobility and observed mobility. They ended up profiling three types of survey respondents: type 1 are ideal respondent who report their daily mobility as accurately. Type 2 are the occasional transit user making undeclared trips causing under estimation of demand. Type 3 are the respondent who reported his typical day instead of his actual trip day. However, this heuristic approach should be considered with caution: it does not provide a 100% reliable information since the reporting problem can work in both direction and lead to assign a smart card to the wrong person who misreported his mobility.
At the tactical level, smart card data is very useful information since it is linked to the transportation system at the route level (Trépanier and Chapleau, 2001a). It allows to get very detailed information such as the maximum load for each single bus route. However, it is very important to note that the reliability of the information we can get is depending on the penetration rate of the smart card and it is not able to provide information as good as passenger counters, which count smart card users, non smart card users and free riders . We already introduce all the work that has been done to enrich smart card data in system where only tap-in is available. Utsunomiya et al. (2006) show that there could be a better suitability of supply to the demand by looking at week days separately. Among the interesting topics reported in Pelletier et al. (2011) there is the study of transfers and the impact evaluation of new public transit policies. The ideal trajectory from an activity to another is the straight line. In the public transit system, a good proxy would be a trip with the fewest connections since every time the rider has to make a transfer, he has to wait for the next vehicle. Hofmann et al. (2009) study connection trip further. White et al. (2010) state that a faring policy could be applied, adjusting price to peak-hours, off-peak hours. Faring policies based on the AFC system is a way to impact the demand that has been studied (Lovrić et al., 2013; Copsey et al., 2014). An important aspect to study of smart card data that has already been pointed out several times in this paper is the smart card holder: even if there is a high penetration rate the smart card owner can decide to stop using public transportation. Public transit loyalty is an important point since it is a source of revenue and it is also a way to estimate a stable demand (Bass et al., 2011; Trépanier and Morency, 2010). It has to be noted that loyal public transit users can move their home from one neighborhood to another which affect
spatial distribution of demand, or the smart card user can lose its smart card, therefore these kind of studies can be complex.
At the operational level, smart card data is used to generate precise performance indicators such as schedule adherence and person-kilometers (Trépanier et al., 2009). It is also used to detect irregularities and errors in the AFC system and to identify defective equipment (Deakin and Kim, 2001). We will refer the reader to Pelletier et al. (2011) as it is a good and recent literature review.
We noted that the use of smart card data for behavioral analysis is limited by the lack of socio-demographic attributes available. They are mostly clustering analysis of mobility behaviors without any socio-demographic description of the clusters. Very few paper try to attach some socio-demographic information to the smart card and when they do, it is considered as a side problem with no real strategy to tackle it.
2.4 Limits to smart card studies
For both alighting and activity location inference, the rule based approach is the most doc-umented and developed. It is also an approach which is both spatially and temporally transferable as long as thresholds are adjusted to each case study. However there are some limits to a rule based approach which motivate other strategies. Even though the rule set may be quite good for most of the population, it can fail for an entire part of the population because their mobility patterns are widely different: Bagchi and White (2005) give the ex-ample of pensioners in Southport, Merseyside, and Bradford whose activities can be shorter than the 30 min time threshold. Amongst the most frequent failures reported by Munizaga et al. (2014) we find overcrowding of buses which delay people from taking the next bus, low service frequency which result in inferring an activity when the traveler was instead waiting for the next bus, short activities impossible to detect, errors due to the time threshold to infer work and other type of activity etc. These failures are the cause of unlinked trips (with no destination inferred) and wrong destination locations. It is creating an inconsistent database. Articles presenting work that achieved good results are conducted on transportation system benefiting from a good AFC system with a high penetration rate of their smart card, cou-pled with an AVL system which enables the location of transactions. However, as Erhardt (2016) states: not all transportation systems are equal. He presented the case study of Bay area (United States of America) and showed that penetration rates are not equal in various neighborhoods and in various time window (peak hour etc). He emphasizes how badly it can impact on bus boarding counts estimates and proposes a model of smart card ownership
calibrated with on-board travel surveys. With the advent of new technologies, it is reasonable to think that the penetration rates will be higher in a near future. It enhances the estimates, however results are still quite poor compared to what could be achieved in transportation systems with good penetration rates. In transportation systems with no AVL systems, a very detailed work has been done by Gaudette (2015); Gaudette et al. (2016) to attach location information using GTFS (General Transit Feed Specification) data and spatial anchor points such as metro stations. The methodology is providing good results, however it is still adding a layer of errors.
2.5 Population synthesis
Usually, an agent-based model is calibrated on a sample of the population, in order to be applied to the whole population. However in most cases the survey has comprehensive information such as social, demographic and economic information about the population sampled. This level of detail is not likely to be known for the whole population because it would be too expansive and because of privacy concerns (Müller and Axhausen, 2010). In order to get results, the model should be used on the whole population. The process of population synthesis consists in creating a synthetic population which properties are similar to the real population, so models can be applied. Classical population synthesis methods are based on either Iteration Proportional Fitting (IPF) or combinatorial optimization. Müller and Axhausen (2010) provide a good literature review of these two methods. A problematic that population synthesis is facing is the evolution of the population over the years: surveys and census are conducted every 5 to 10 years and the population is aging, moving in or out of the zone, dying. Models exist to simulate this evolution (Eluru et al., 2008), one of the most comprehensive demographic model can be found in ILUTE (Miller et al., 2011). The IPF was first described by Deming and Stephan (1940) consists in fitting a disaggregated bunch of agent to aggregated marginals over agent attributes. This is done using contingency table. Once contingency table is fitted, the sample population is expanded with an individual factor that insure that all marginals are respected. It is not necessarily converging since if there is a zero-cell, the IPF method contains a division by 0 operation which is undefined (Pukelsheim and Simeone, 2009). Another important limit is computation cost which grows exponentially with the number of attributes being synthesized, Pritchard (2008) proposes a list-based representation of attributes to avoid including a lot of sparse value in the com-putation. Memory cost is a major point limitation of IPF methods (Müller and Axhausen, 2010). In its more general description it is not able to handle a complexe structure (like individual and family), however later developments have accomplished this step with the
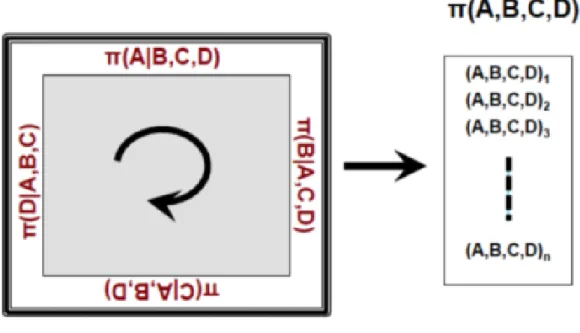
Iterative Proportional Update (Ye et al., 2009)(Müller and Axhausen, 2010). It is the most common population synthesis method. The combinatorial optimization method is described in Voas and Williamson (2000). It has the benefit of being able to handle data with very poor spatial repartition and output data at higher spatial resolution. It uses simulated annealing to find the best composition of agent to fit marginals. Then, in the same way IPF does, it expands the sampled population with weighting factors. Ryan et al. (2009) and Huang and Williamson (2001) propose a comparative study of IPF and combinatorial optimization meth-ods. They found that combinatorial optimization provide more stable population synthesis. It is also simpler to implement and less sensitive to sampling errors. However combinatorial optimization is sharing a major limitation with IPF: they are both cloning sampled data. There is a recent third methodology based on Monte Carlo Markov Chains sampler (Farooq et al., 2013a) which release the marginal fitting step. Two samplers are used either jointly or combined: Metropolis Hasting and Gibbs samplers. Instead of computing weighting factors for individual, it samples agent from the joint distribution underlying the sample and the universe population. It is done by randomly choosing an attribute then redistributing it according to the joint distribution of the population (see figure 2.2). Conditional distributions of attributes are known through the datasets available. The whole process is a Monte Carlo Markov Chain. It is able to handle two spatial level of information using importance sampling and it may be able to handle more. Farooq et al. (2013b) present a case study of this methodology on Brussel. They generated households agents with eight attributes. The methodology is applied in a software SimPSinz that is made open source. Its application is compared to an IPF approach application. The SimPSinz is stated as way more fast than the IPF approach. The framework presented is able to handle incomplete information (conditional distribution that are not known over every attributes), Farooq et al. (2013c) implements the methodology and recreate missing information using models. Farooq et al. (2013c) also contains an extensive comparison between IPF population synthesis and Gibbs sampling. The Gibbs sampling performs with more stability and without significant loss of marginal fitting (always ≤ 1%). The performance of population synthesis was assessed for various sample size (5%, 3% and 1%). Even if simulation based population synthesis is a recent methodology, it seems to provide more reliable results. Anderson et al. (2014) proposes an association method to distribute a role within the household. The methodology is based on the Hungarian algorithm (graph theory alrogithm): one set is the population, the other set are household roles available (head, spouse etc). Edges are weighted using utilities simulated from a multinomial logit model and the Hungarian algorithm is used to minimize the cost of associating a role to every person in the population.
Figure 2.2 Illustration of the working of Gibbs sampler. Source: Farooq et al. (2013a)
2.6 Trip chain choice model
When enriching smart card data with rule based approach, one of the major drawback is that it is blind imputation without considering any behavioral aspect. It results in poor granularity in the outcome. The modeling approach did not use any socio-demographic variables (because there wasn’t any available). Bonnel (2002) and Meyer and Miller (2001) defines the mobility of an individual, making a difference between the trip, the activity, the trip leg, the mode, the frequency of trips and activities. All this information is available or can be inferred from smart card data for public transit users, but there are few work to model the entire mobility. Some models focus on modeling long term decision reporting such as mode choice (Mokhtarian, 1991), place of living (De Palma et al., 2014), car ownership (Vovsha and Petersen, 2009) and other onetime choices with persistent effect on daily life. Roorda et al. (2009) propose a model combining activity scheduling and long term decision based on the definition of a stress function measuring actual state and distance to ideal state for each household. In a more general way, Land Use Transport Integrated models (LUTI) are good examples of work that model those interactions between long term and short term decisions: projects such as UrbanSim (Waddell, 2002), ILUTE (Salvini and Miller, 2005) (Miller et al., 2004)(Miller and Salvini, 2001), ILUMASS (Wagner and Wegener, 2007), TRESIS (Hensher and Ton, 2002) etc. There are two kinds of LUTI models: agent based and aggregated
models, agent based model are more relevant to our work since we are trying to work at the smart card holder level. See Renner et al. (2014) and Bierlaire et al. (2015) for more detailed literature reviews on LUTI models.
In a complete mobility, there are many choices to accomplish (mode choice, number of ac-tivities, activity locations, departure hours etc) and these choices may be correlated, for instance having a great number of activities in various locations may be an incentive to use a car. There are two ways to model those choices: either jointly or sequentially (Doherty and Axhausen, 1999). Sequential models are assuming that there is a natural causality between choices that can be captured and that there is a logical order of choices which creates a nested structure of choices. Most tour based model are relying on a ’tree logit’ form (Miller et al., 2005) .Bowman and Ben-Akiva (2001) propose a five nests structure under the main assumption that there is a natural difference between the main activity and secondary activ-ities and that the main activity structures secondary activity choices. This is an important assumption that was later used in other sequential models: FAMOS (Pendyala et al., 2005) TASHA(Miller and Roorda, 2003)(Roorda et al., 2005) and more generally all the activity choice models generating full day schedule in a LUTI. In models which strategy is scheduling the time use (based on Hägerstraand (1970) work), sequential models are often used. An-other good point about sequential model is that they can be included in Computer Based Model (CPM) because their different layers can be applied dynamically in unlinked parts. Used this way, they can be estimated separately which is much easier. This alliance between CPM models and stochastics model is called ’weak CPM’ in Yasmin et al. (2015).
One of the major downside of sequential models is that they are ignoring endogeneity that is not explicitly considered in the tree structure. On the other hand, joint models does not rely on any causal assumptions and are able to capture those latent effects (Guo and Bhat, 2001) Golob (2003). Joint models have been used for estimating pollution(Paleti et al., 2011), study latent demand for new highways (Fujii and Kitamura, 2000) Bhat and Singh (1997) propose a joint model of work mode choice and secondary stops (other than work), they are able to get a good understanding interaction between choices. Golob (2000) proposes a joint model of household activity participation and trip chain generation. Joint models present strong theoretical ground, however from a practical point of view joint models are limited and cannot consider too many attributes and attribute’s categories since traditional model estimation techniques are not performing enough (Bhat, 2011). Bhat and Eluru (2010) provide an extensive literature review of recent econometric models.
CHAPTER 3 METHODOLOGY
Our methodology is independent of the datasets available, however it is more understandable if presented with a context. At first, we present the available information, then a broad description of the methodology is given. Each step of the methodology is detailed. Eventually, the ideal validation method is described.
3.1 Context
This section presents the datasets that we used.
3.1.1 Smart card dataset
The research was conducted using AFC data from Gatineau’s public transit system (Canada). The public transit system operator is Société de Transport de l’Outaouais (STO). STO is serving a population of 259 800 persons (according to iTRANS Consulting Inc. (2006)) and it is covering an area of 637 km2 (iTRANS Consulting Inc., 2006). A very detailed historical
description of this organism is available in Blanchette (2009). We use data from November 2005, at that time there was a bus-based public transit network (no metro, no bus rapid transit) with 112 bus lines (figure 3.1 is a map of the location of bus stops), including a night service. For this period, there are 23 549 smart card holders which represent close to 80% of public transit users (Blanchette, 2009). The whole fleet was equipped with AFC system in 2001 as well as an AVL system therefore the data is quite reliable since there was time to find errors, correct them and improve the AFC and the AVL system. Data available contains, for each smart card transaction:
• date and time of boarding
• fare (regular, express, interzone, student, senior) • line number and direction
• boarding bus stop number • alighting bus stop number
Alighting bus stops were inferred using Trépanier et al. (2007) methods. There are 831 119 validations for November 2005 and the alighting inference algorithm resulted in estimating successfully 718 539 trip leg’s destinations (86%). A distance threshold of 2 km was used to detect missing trip (the walking distance threshold is 1 km, but it is assuming that there could be an activity in between the two stops). The remaining 14% is kept in our dataset since the developed methodology is not affected.
Figure 3.1 The bus stops of the STO’s network.
3.1.2 Origin-Destination survey
The travel survey dataset of the metropolitan area of Ottawa-Gatineau is the Origin-Destination survey. It is a land-line based survey with a sampling rate of 5.1%. It represents an average week-day, reporting only for 11 years old or older. The whole family’s mobility is reported. It is actualy a trip diary survey for the whole day for the entire family. The survey was conducted between September 21st, 2005 and November 29th, 2005. The metropolitan area
of Ottawa-Gatineau is divided in two by a river (see figure 3.1). The STO is running a bus service in the Gatineau area and part of Ottawa downtown. In this area, public transit trips represent approximately 20% of all trips (iTRANS Consulting Inc., 2006). However public transit trips include trips on the STO network as well as trips on the school transportation network or other public transit services (such OC transport, the Ottawa public transporta-tion network). Only 13.5% of all trips in the Gatineau area are made on the STO network. Therefore, with the smart card data we have approximately 11% of all trips made on the STO network in the Gatineau area.
3.1.3 Canadian census
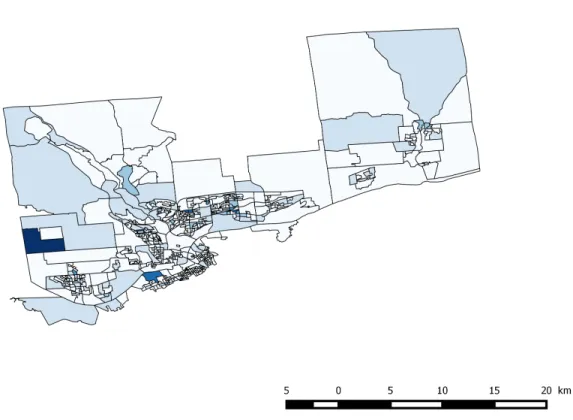
The Canadian census dataset is ran by Statistics Canada and provides good information about the whole population. It provides marginal distributions of attributes such as age and gender at the dissemination area level. Dissemination areas are spatial areas which are designed to be uniform with a population count targeted between 400 and 700 individuals (Canada, 2016), therefore, in dense urban neighborhood, this can result in a zone with a area of a few hectares (15 to 50 ha). It was held on May, 2006.
3.1.4 Public Use Microdata Sample
Public Use Microdata Sample (PUMS) is an extension of the Canadian census. It samples 20% of the whole population. It is a disaggregated sample, therefore cross-distribution infor-mation can be drawn. For privacy concerns geographic inforinfor-mation is limited to a very large scale (at the metropolitan area level). It contains information about age, gender, family size, income, language etc. It was held on May, 2006.
3.2 The broad picture
Our data evolves in a complex space that we reduce to four dimension for explanatory pur-pose. First, the spatial dimension. A strong spatial information is known at a very low scale. Secondly, temporal dimension. A strong temporal information is available at a disaggregate level for a long time window (longitudinal data) whereas a weak temporal information is a one day information. Third, the socio-demographic attributes: a strong information is known at the disaggregate level while a weak information are marginal distributions. Fourth, the mobility choice dimension. A strong information is the knowledge of the complete trip chain including the mode use, time of departures, activity purposes etc (see figure 3.2) while a weaker information would be missing something.
Figure 3.2 Decomposition of a trip chain.
Table 3.1 Problem dimensions.
Dimension Spatial Temporal Socio-demographic Mobility choices
Travel Survey Weak . . . Medium Strong
Census Strong . . . Medium . . .
PUMS . . . Strong . . .
AFC data Strong Strong Weak Medium
To make the best out of our data strengths and weaknesses (see table 3.1) we came up with three core hypothesis. The first hypothesis is that the first boarding of a user is within the neighborhood of the houser’s home (this is derived from the assumption that there is a walking distance threshold). Therefore, if we know the most frequent daily first boarding, we know the smart card holder is to be found in the local population which can be known through census. The second hypothesis is that individuals have various travel behaviours with respect to their socio-demographic attributes. Therefore, within the local population some persons are more likely to be the owner of a smart card that fit their travel habits. Travel habits can be modeled. The third hypothesis is that the faring policy is well understood by everyone, it induces that the fare applied can provide some information about the smart card holder’s attributes (there is often a social faring policy with student fare, retired fare etc). We expect that those combined assumptions can allow us to attach socio-demographic attributes to smart cards. Figure 3.3 illustrates the process.
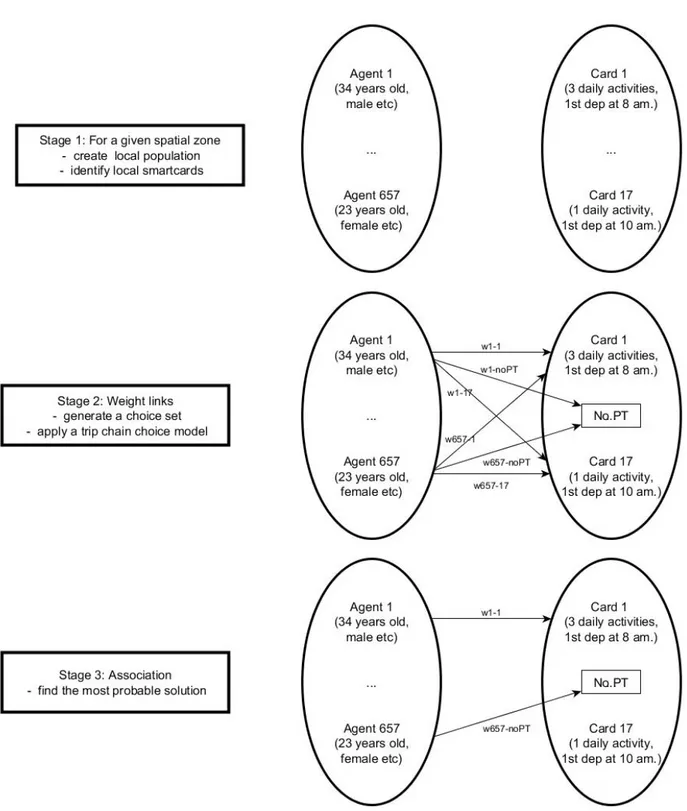
The first stage of our methodology is to use our first hypothesis: for a given spatial zone, we have the local population and smart cards that are based in the spatial zone. On the first hand, the population is known through the Canadian census data, the PUMS data and the travel survey and its information can be known at the dissemination area level (smallest geographic area available for census data: it is designed to contain approximately 700 persons). On the other hand, we assume that the most frequent station for daily first boarding is a good proxy to estimate smart card owner’s living area. This gives us a set of persons and a set of smart cards which are from the same spatial zone.
The second stage consists in weighting possible links between the two sets using our second hypothesis. From a smart card records, we observe a travel pattern on the public transit network. We use behavioural discrete choice model: each individual in the population is an agent who can choose a travel pattern among the smart card set or choose not to use public transit. The discrete choice model provides us with utility functions and probabilities which can be used to weight the links between the population and the smart cards (a similar methodology was used in Anderson et al. (2014) to assign individual agent to a household role). The idea to work the other way around (let the smart card choose its owner) was raised. However socio-demographic characteristics are not only correlated to travel patterns, they also have a causal effect on them. As it is a causal link, we can not make the hypothesis that knowing the mobility of an individual is enough to infer his attributes. There is no bijection between socio-demographic attributes and mobility patterns; as public transit users clustering work has shown, different types of individuals can have a similar travel pattern (Ortega-Tong, 2013).
The third stage consists in actually assigning a single smart card to a single owner, assuring that this is the most probable solution. This is done using the Hungarian algorithm (Anderson et al. (2014) used it in a similar way). This solution was chosen because it was the most straightforward, but any association algorithm can be used.