HAL Id: hal-00994577
https://hal.archives-ouvertes.fr/hal-00994577
Preprint submitted on 21 May 2014
HAL is a multi-disciplinary open access
archive for the deposit and dissemination of
sci-entific research documents, whether they are
pub-lished or not. The documents may come from
teaching and research institutions in France or
L’archive ouverte pluridisciplinaire HAL, est
destinée au dépôt et à la diffusion de documents
scientifiques de niveau recherche, publiés ou non,
émanant des établissements d’enseignement et de
recherche français ou étrangers, des laboratoires
borosilicate glass enriched in MoO3 studied by in situ
Raman spectroscopy at high temperature
Magali Magnin, Sophie Schuller, Daniel Caurant, Odile Majérus, Dominique
de Ligny, Thierry Advocat
To cite this version:
Magali Magnin, Sophie Schuller, Daniel Caurant, Odile Majérus, Dominique de Ligny, et al.. Phase
separation and crystallization in soda-lime borosilicate glass enriched in MoO3 studied by in situ
Raman spectroscopy at high temperature. 2008. �hal-00994577�
Phase Separation and Crystallization in soda-lime borosilicate glass enriched in MoO3 studied by in situ Raman spectroscopy at high temperature
M. Magnin1*, S. Schuller1, D. Caurant2, O. Majérus2, D. de Ligny3, T. Advocat1
* Corresponding author Tel: (+33) 466 397 290; Fax: (+33) 466 793 060; Email: magali.magnin@cea.fr
1
CEA Valrhô, DEN/DTCD/SCDV Laboratoire d’Etude de Base sur les Verres BP 17171, 30207 Bagnols-sur-Cèze Cedex, France
2Laboratoire de Chimie de la Matière Condensée de Paris- LCMCP (UMR-CNRS 7574)
Ecole Nationale Supérieure de Chimie de Paris (ENSCP, Paristech) 75231 Paris, France
3 Laboratoire de Physico-Chimie des Matériaux Luminescents- LPCML (UMR-CNRS 5620) Université Claude Bernard Lyon1
69622 Villeurbanne, France
Abstract – Phase separation and crystallisation processes may arise in molten glass when the MoO3
content exceeds its solubility limit. Molybdenum combined with other elements such as alkali and alkaline-earth may form crystalline molybdates, known as “yellow phases” in nuclear glasses. In order to establish the sequence of phase separation and crystallization processes occurring during the cooling of the melt, a non-radioactive simplified glass composition was chosen in the SiO2–B2O3–Na2O–CaO system, with
2mol.% MoO3 . Various cooling scenarios were tested: cooling by air blowing, quenching between two
copper plates and cooling on metallic plate. The resulting glass specimens were then characterized by scanning electron microscopy (SEM), transmission electron microscopy (TEM), X-ray diffraction (XRD) and Raman spectroscopy in temperature. These observations made it possible to determine the sequence and the appearance temperature of phenomena upon cooling: first, a phase separation occurs, (small droplets dispersed in the molten glass) followed by molybdates crystallization inside the droplets.
INTRODUCTION
In order to confine the high level wastes (HLW) such as fission product solutions, arising from reprocessing of high burn-up UOX-type nuclear spent fuels, a new glass composition is being optimized [1]. The studies conducted to date on this borosilicate glass revealed that above about for more than 3 wt%, molybdenum oxide can lead (for glasses fabricated at 1200°C), to a glass-in-glass phase separation, followed by crystallization upon cooling. Concerning the structural role of molybdenum in silicate and borosilicate glasses, X-ray absorption spectroscopy showed that hexavalent
molybdenum cations are located in unconnected tetrahedral MoO42- entities within alkali and
alkaline-earth rich depolymerised regions outside the silicate or borosilicate network (i.e., the oxygen atoms of MoO42- units are not bounded to
Si or B) [2-5]. The same kind of isolated molybdate tetrahedral entities are present in the Na2MoO4 and CaMoO4 phases that can form in
some nuclear borosilicate glasses. On account of
the solubility of alkali molybdates in water, this phase separation may decrease the chemical durability of the vitrified nuclear waste material [6]. The similarity between the local
environment of MoO42- entities in glasses and in
molybdate crystalline phases may explain the low solubility of molybdenum in glasses and their tendency to crystallize during slow cooling of melts or heat treatment of glasses.
The present work was performed to identify the different steps of the transformation from the melt to the glass of a borosilicate glass rich in MoO3 with Raman spectroscopy in temperature.
A composition containing 2mol.% MoO3 was
chosen because depending on the type of cooling applied it allows to obtain an homogenous or partially crystallized glass.
EXPERIMENTAL PROCEDURE Glass Preparation
For this study, a non-radioactive simplified glass composition was chosen in the SiO2–B2O3–
Na2O–CaO system derived from that of a HLW
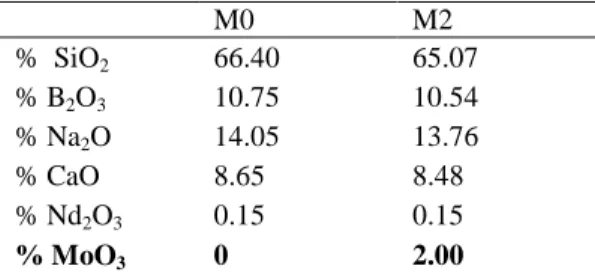
glass keeping the same oxides ratio as in this complex composition. Two glass compositions (Table I) were prepared for this study: one with 2mol.% of MoO3 (M2) and another without
MoO3 (M0). For all samples, 0.15 mol.% Nd2O3
was introduced to facilitate 29Si and 95Mo nuclei relaxation during MAS NMR experiments and to perform optical studies not presented in this paper.
TABLE I. Nominal Glass Compositions (oxide mol.%). M0 M2 % SiO2 66.40 65.07 % B2O3 10.75 10.54 % Na2O 14.05 13.76 % CaO 8.65 8.48 % Nd2O3 0.15 0.15 % MoO3 0 2.00
All glasses (~ 50 g batch) were prepared using reagent grade SiO2, CaCO3, Na2CO3, H3BO3,
MoO3, and Nd2O3 powders and melted under air
in platinum/gold crucibles at 1300°C for 3 h. Various cooling scenarios were tested for each composition: quenching between two copper plates (speed cooling about 104°C/min), cooling on metallic plate (speed cooling about
103°C/min). Moreover, M2 glass was also cooled by air blowing according to the method
described by Schuller et al [7]: the sample were taken directly in the platinum crucible at 1100°C using a ring-tipped platinum rod then blown with compressed air through a nozzle. After blowing the samples were very thin films of glass about 10 µm thick formed by bursting of glass bubbles, and constitute the very fast-quenched specimens. This method of cooling permitted to quench the molten glass at higher temperature than the two other methods (with a speed cooling higher than 104°C/min).
Samples Characterization
M2 samples quenched between copper plates or cooled on metallic plate were characterized by XRD on a Philips X’Pert Pro theta-theta X-ray diffractometer using monochromatised Cu Kα radiation (λ = 0.15406 nm). Crystalline phases were identified by comparison of XRD powder
patterns with the crystallographic data base of the International Center of Diffraction data. The M2 sample cooled on metallic plate (opalescent) was studied by SEM and energy dispersive X-ray analysis (EDX).
Very fast-quenched M2 samples prepared by air blowing or quenched between two copper plates were analyzed by TEM and EDX.
In order to establish the phase separation and crystallisation sequence occurring during the cooling, the Raman spectra of the M2 glass quenched between two copper plates were recorded in the temperature range 1100-25°C (after melting again at 1100°C).
Raman spectra of crystalline phases Na2MoO4
(commercial sample) and CaMoO4 (ceramic
sample prepared in our laboratory) was also recorded in the same range of temperature for comparison with our partially crystallized samples and for temperature calibration. For this Raman experiment, an Aramis Jobin– Yvon confocal microRaman spectrometer equipped with a CCD detector was used. The 325 nm line of a Coherent He-Cd laser was the excitation source. High-temperature Raman observations were carried out in a Linkam T1500 heated stage for the collection of in-situ Raman spectra. Samples were put into the Pt crucible of heated stage and directly melted at 1100°C. Then, samples were cooled at the rate of 100°C/min.
All Raman spectra were corrected for
temperature and frequency-dependent scattering intensity as described by Long [8] and then normalized to the data point of highest intensity.
RESULTS
Microstructural Characterization of M2 glass quenched at different rates
As shown in Fig. 1, the M2 glasses obtained after quenching between two copper plates or blowing by air were transparent and totally amorphous according to XRD and TEM. However, the M2 sample cooled on metallic plate glass was opalescent and the back-scattered SEM image showed white spherical micrometer size particles homogeneously dispersed in the bulk (Fig. 1c). XRD pattern of this sample revealed the presence of CaMoO4 (powellite) and γ-Na2MoO4
crystals (Fig. 1e). Powellite has the same tetragonal structure as scheelite (CaWO4) with
nearly regular isolated MoO42- tetrahedra and one
site for Ca2+ ions in which these cations are surrounded by eight close oxygen atoms. According to literature [9, 10], γ-Na2MoO4 is an
orthorhombic phase stable only at high temperature (between 592 and 637°C)[10]. The apparent spherical shape of the Mo-rich particles tends to indicate that molybdate crystallized in spherical shape particles previously formed by liquid–liquid phase separation in the melt during cooling. These liquid spherical particles would concentrate Mo and would then facilitate molybdate
crystallization [11].
Study of M2 Glass During Cooling
In order to determine the appearance temperature of phase separation and crystallization
phenomenon, the M2 glass obtained after quenching between two copper plates was selected and studied by Raman spectroscopy in temperature during the cooling (from 1100°C to room temperature).
For each temperature, the Raman spectra of M2 sample were compared with those of molybdate crystalline phases (CaMoO4 and Na2MoO4)
recorded separately in the same temperature range.
For this high temperature study, Raman spectra were recorded from 100 to 1200cm-1.
Consequently, the principal vibration bands (internal modes) of MoO42- entities which are in
crystallized (as CaMoO4 or Na2MoO4) or in
amorphous environment were observed.
From 1100°C To 950°C
The image (Fig. 1a) of M2 sample cooled by air blowing from 1100°C showed that this glass was homogeneous at the TEM scale (no crystalline phase was detected). It is supposed that molybdenum is totally located inside the glassy network at this temperature.
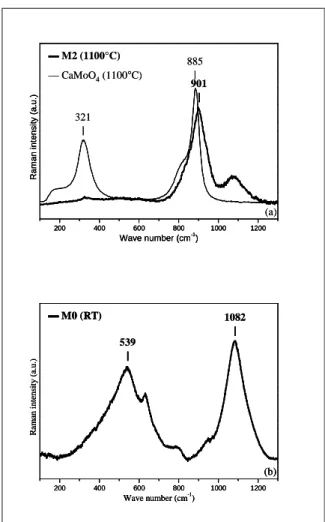
The Raman spectrum of M2 sample (melt) recorded at 1100°C (Fig. 2a) reveals the presence of a main band at 901 cm-1. The Raman spectrum (recorded at room temperature) of the glass M0 without molybdenum (Fig. 2b) shows that this band is not present without molybdenum. Thus, this band may be associated with a vibration band of MoO42- entities in a glassy environment.
50 nm (a) Sample 50 nm (a) Sample (a) 50 nm Sample (b) 50 nm Sample (a) 50 nm Sample (b) 50 nm Sample (a) 50 nm Sample (b) 50 nm Sample 10 µm (c) 10 µm 10 µm 10 µm (c) 15 20 25 30 35 2θ (degrees) Nγ P Nγ P (c) (e) Nγ: γ-Na2MoO4 P : CaMoO4 15 20 25 30 35 2θ (degrees) Nγ P Nγ P (c) (e) 15 20 25 30 35 2θ (degrees) Nγ P Nγ P (c) (e) Nγ: γ-Na2MoO4 P : CaMoO4
Fig. 1. TEM images of M2 samples cooled by blowing air at 1100°C (a) or quenched between
two copper plates (b). Back-scattered electron (SEM) image of M2 sample cooled on metallic plate (c). X-ray diffraction (XRD) patterns of the
quenched glasses between two copper plates (d) or cooled on metallic plate (e).
The fact that the Raman spectrum of glass M2 could not be correlated with the spectrum of crystalline CaMoO4 whose main band is
narrower and is located at 885 cm-1 (T = 1100°C) confirms that molybdenum is not located in molybdate crystals. According to Sarantopoulou
et al [12] the band at 885 cm-1 is associated to the symmetric stretching vibration band of MoO42- entities in the crystalline phase CaMoO4
at 1100 ° C.
Upon cooling from 1000 to 950°C there are not modifications of the vibration band associated with the elongation of MoO42- entities. Thus it
appears that in this temperature range, tetrahedral MoO42- entities are only located in a glassy
environment. The absence of stretching vibration bands characteristics of MoO42- inside
crystallized environment indicates that the melt is not crystallized in the temperature range from 1100 to 950°C.
From 950°C to room temperature
Below 950°C, a strong evolution of the bands associated with MoO42- entities vibration is
observed.
Indeed, the Raman spectrum of M2 sample recorded at 900°C shows now a main vibration band at 867 cm-1 (Fig. 3a). This wave number is associated with vibration bands of tetrahedral MoO42- entities in a crystallized environment of
CaMoO4 type. The new band at 780cm-1 (Fig.
3a) also corresponds to a vibration band of tetrahedral MoO42- entities in CaMoO4 crystals.
Moreover a weak shoulder is observed near 900 cm-1 which is characteristic of the MoO4
2-vibration band in the glass as shown in Fig. 2a. This shoulder appears in all Raman spectra recorded for each temperature.
Between 800 and 700°C, Raman spectra of M2 (Fig. 3b,c) remained similar; the elongation vibration band of MoO42- tetrahedra in CaMoO4
is always observed.
Starting from 650°C, a low-intensity shoulder appeared at 890 cm-1 in the M2 Raman spectrum (Fig. 3d). The intensity of this shoulder increased in the Raman spectrum recorded at 550°C (Fig. 3e). When comparing this spectrum with that of Na2MoO4 recorded at the same temperature, we
can see that this band may be associated with a vibration band of tetrahedral MoO42- entities in
200 400 600 800 1000 1200 R a m a n i n te n s it y ( a .u .) Wave number (cm-1 ) 901 |||| 885 | ▬ M2 (1100°C) — CaMoO4(1100°C) (a) 321 | 200 400 600 800 1000 1200 R a m a n i n te n s it y ( a .u .) Wave number (cm-1 ) 200 400 600 800 1000 1200 R a m a n i n te n s it y ( a .u .) Wave number (cm-1 ) 901 |||| 885 | ▬ M2 (1100°C) — CaMoO4(1100°C) (a) 321 | 1082 |||| 200 400 600 800 1000 1200 R a m an i n te n si ty ( a. u .) Wave number (cm-1) (b) ▬ M0 (RT) 539 |||| 1082 |||| 200 400 600 800 1000 1200 R a m an i n te n si ty ( a. u .) Wave number (cm-1) (b) ▬ M0 (RT) 200 400 600 800 1000 1200 R a m an i n te n si ty ( a. u .) Wave number (cm-1) (b) ▬ M0 (RT) 539 ||||
Fig. 2. (a) . Normalized Raman spectra of M2 sample (melt) recorded at 1100°C. Raman spectra
of CaMoO4 crystalline phase at the same
temperature also shown for comparison. (b) Normalized Raman spectra of M0 glass recorded at
room temperature.
the crystalline phase Na2MoO4. But we cannot
determine its allotropic form.
After cooling down to room temperature we can see the three elongation band contributions of tetrahedral MoO42- entities following if they are
located in the glass, in CaMoO4 or Na2MoO4
700 800 900 1000 R a m a n i n te n s it y ( a .u .) Wave number (cm-1 ) 867 |||| 780 | ▬ M2 (900°C) — CaMoO4(890°C) (a) 700 800 900 1000 R a m a n i n te n s it y ( a .u .) Wave number (cm-1 ) 867 |||| 780 | ▬ M2 (900°C) — CaMoO4(890°C) (a) 700 800 900 1000 R a m a n i n te n s it y ( a .u .) Wave number (cm-1 ) 869 |||| 782 | ▬ M2 (800°C) — CaMoO4(820°C) (b) 700 800 900 1000 R a m a n i n te n s it y ( a .u .) Wave number (cm-1 ) 869 |||| 782 | ▬ M2 (800°C) — CaMoO4(820°C) (b) 700 800 900 1000 R a m a n i n te n s it y ( a .u .) Wave number (cm-1 ) 872 |||| 786 | ▬ M2 (700°C) — CaMoO4(695°C) (c) 700 800 900 1000 R a m a n i n te n s it y ( a .u .) Wave number (cm-1 ) 872 |||| 786 | ▬ M2 (700°C) — CaMoO4(695°C) (c) 700 800 900 1000 R a m a n i n te n s it y ( a .u .) Wave number (cm-1 ) ▬ M2 (650°C) — CaMoO4(695°C) — Na2MoO4(642°C) 890 | 900 |||| 869 |||| 784 | (d) 700 800 900 1000 R a m a n i n te n s it y ( a .u .) Wave number (cm-1 ) ▬ M2 (650°C) — CaMoO4(695°C) — Na2MoO4(642°C) 890 | 900 |||| 869 |||| 784 | (d) 700 800 900 1000 R a m a n i n te n s it y ( a .u .) Wave number (cm-1) ▬ M2 (550°C) — CaMoO4(582°C) — Na2MoO4(575°C) 890 | 870 |||| 785 | (e) 700 800 900 1000 R a m a n i n te n s it y ( a .u .) Wave number (cm-1) ▬ M2 (550°C) — CaMoO4(582°C) — Na2MoO4(575°C) 890 | 870 |||| 785 | (e) 700 800 900 1000 R a m a n i n te n s it y ( a .u .) Wave number (cm-1 ) ▬ M2 (return at RT) — CaMoO4(RT) — Na2MoO4(RT) 880 |||| 793 | (f) 890 | 813 | 700 800 900 1000 R a m a n i n te n s it y ( a .u .) Wave number (cm-1 ) ▬ M2 (return at RT) — CaMoO4(RT) — Na2MoO4(RT) 880 |||| 793 | (f) 890 | 813 |
Fig. 3. Normalized Raman spectra of M2 sample recorded in situ during the cooling in the temperature range from 900°C to room temperature.
M2’ : melt rich in Mo,
Na, (ε) Ca
a : CaMoO4
M1: melt rich in Si,O
M2: melt rich in Mo, Ca,
Na,O
M1: melt rich in Si,O
2dstep : liquid-liquid phase separation
3rdstep : CaMoO 4 crystallization inside the
droplets
4thstep : Na 2MoO4 crystallization inside the
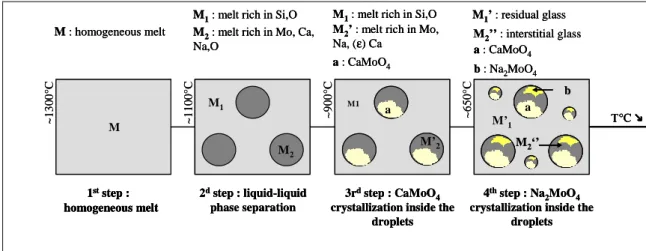
droplets b : Na2MoO4 M1’ : residual glass T°C M1 a a b M M1 M’2 M’1 M2‘’ a : CaMoO4 M2 M : homogeneous melt 1ststep : homogeneous melt M2’’ : interstitial glass ~ 1 3 0 0 °C ~ 1 1 0 0 °C ~ 9 0 0 °C ~ 6 5 0 °C
M2’ : melt rich in Mo,
Na, (ε) Ca
a : CaMoO4
M1: melt rich in Si,O
M2: melt rich in Mo, Ca,
Na,O
M1: melt rich in Si,O
2dstep : liquid-liquid phase separation
3rdstep : CaMoO 4 crystallization inside the
droplets
4thstep : Na 2MoO4 crystallization inside the
droplets b : Na2MoO4 M1’ : residual glass T°C M1 a a b M M1 M’2 M’1 M2‘’ a : CaMoO4 M2 M : homogeneous melt 1ststep : homogeneous melt M2’’ : interstitial glass M2’ : melt rich in Mo,
Na, (ε) Ca
a : CaMoO4
M1: melt rich in Si,O
M2: melt rich in Mo, Ca,
Na,O
M1: melt rich in Si,O
2dstep : liquid-liquid phase separation
3rdstep : CaMoO 4 crystallization inside the
droplets
4thstep : Na 2MoO4 crystallization inside the
droplets b : Na2MoO4 M1’ : residual glass T°C T°C M1 a a b b M M1 M’2 M’1 M2‘’ M2‘’ a : CaMoO4 M2 M : homogeneous melt 1ststep : homogeneous melt 1ststep : homogeneous melt M2’’ : interstitial glass ~ 1 3 0 0 °C ~ 1 1 0 0 °C ~ 9 0 0 °C ~ 6 5 0 °C
Fig. 4. Synthetic scheme of probable scenario occurring during the cooling of M2 melt.
DISCUSSION
The TEM image of M2 sample quenched by air blowing from 1100°C argues that the melt is homogeneous at this temperature. The Raman spectrum recorded at 1100°C confirms that the tetrahedral MoO42- entities are in a glassy
environment (absence of crystallization). During melt cooling of M2 sample from 1100°C to 950°C, there is no evolution of Raman spectra. However, the microstructure of M2 cooled on metallic plate suggests that the phenomenon of phase separation appears before crystallization. Therefore, it is expected to observe the liquid-liquid phase separation phenomenon in this temperature range.
The first CaMoO4 crystals appear between 950
and 900°C, and this crystalline phase remains up to room temperature.
Between 700 and 650°C, two low-intensity shoulders appear which can be correlated with stretching elongation bands of MoO42- entities in
the crystalline phase Na2MoO4 type and in the
glass.
The probable scenario of the different
phenomenon occurring during M2 melt cooling deduced from all our results is reported in Fig. 4.
CONCLUSIONS
The aim of this work was to study a glass belonging to the SiO2–B2O3–Na2O–CaO system
rich in MoO3. The glass quickly cooled at
104°C/min is homogenous. But when it is cooled more slowly (about 103°C/min) CaMoO4 and
Na2MoO4 crystallization occurs in the bulk. By
Raman spectroscopy investigations from the melt temperature (1100°C) to room temperature, CaMoO4 crystallization occurs near 900°C while
the Na2MoO4 crystallization appears at
lower-temperature (near 650°C).
Thus we identified the occurrence temperatures of crystalline phase CaMoO4 and Na2MoO4 in
borosilicate glass rich in MoO3 during slow
cooling. In order to quantify the thermal stability areas of these crystalline phases, a study on glass heating is under progress.
Further studies will be carried out in order to determine the appearance temperature of the phase separation phenomenon, and to describe the microstructural evolution of glass M2. In addition, the composition effects will be studied with the aim of increasing the solubility of MoO3
in borosilicate glasses.
REFERENCES
1. I. BARDEZ, D.CAURANT,
J.L.DUSSOSSOY, P.LOISEAU, C.GERVAIS, F.RIBOT, D.R. NEUVILLE, N. BAFER, C. FILLET, Nucl. Sci. Eng., 153, pp. 272-284 (2006).
2. G. E. BROWN, F. FARGES, G. CALAS,
Rev. Mineral., 2, pp. 317–410 (1995).
3. G. CALAS, M. LE GRAND, L. GALOISY, D. GHALEB, J. Nucl. Mater., 322, pp. 15–20 (2003).
4. R. J. SHORT, R. J. HAND, N. C. HYATT, G. MOBUS, J. Nucl. Mater., 340, pp. 179–186 (2005).
5. N. SAWAGUCHI, T. YOKOKAWA, K. KAWAMURA, Phys. Chem. Glasses, 37, pp. 13–18 (1996).
6. Y. KAWAMOTO, K. CLEMENS, M. TOMOZAWA, J. Am. Ceram. Soc., 64, pp. 292-296 (1981).
7. S. SCHULLER, O. PINET, A.
GRANDJEAN, J. Non-Cryst. Solids, 354, pp. 296-300 (2008).
8. D.A. LONG, Raman Spectroscopy, McGraw-Hill, New York, pp. 276 (1977). 9. Y. G. PETROSYAN, E. V. TKACHENKO, V. M. ZHUKOVSKII, Inorg. Mater., 11, pp. 1381–1384 (1975).
10. C. W. T. PISTORIUS, J. Chem. Phys., 44, pp. 4532–4537 (1966).
11. D. CAURANT, O. MAJERUS E. FADEL, M. LENOIR, C. GERVAIS, O. PINET, J. Am.
Ceram. Soc., 90, pp. 774-783 (2007).
12. E SARANTOPOULOU, C RAPTIS, S VES, D CHRISTOFILOS, G A KOUROUFLIS, J.
Phys.: Condens. Matter, 14, pp. 8925-8938