Any correspondence concerning this service should be sent to the repository administrator:
[email protected]
To link to this article:
DOI:10.1016/j.powtec.2011.06.022
http://dx.doi.org/10.1016/j.powtec.2011.06.022
This is an author-deposited version published in:
http://oatao.univ-toulouse.fr/
Eprints ID: 6315
To cite this version:
Ansart, Renaud and Letourneau, Jean-Jacques and de Ryck, Alain and Dodds,
John A. Dust emission by powder handling: Influence of the hopper outlet on the
dust plume. (2011) Powder Technology, vol. 212 (n° 3). pp. 418-424. ISSN
0032-5910
O
pen
A
rchive
T
oulouse
A
rchive
O
uverte (
OATAO
)
OATAO is an open access repository that collects the work of Toulouse researchers and
makes it freely available over the web where possible.
Dust emission by powder handling: Influence of the hopper outlet on the dust plume
Renaud Ansart
⁎
, Jean-Jacques Letourneau, Alain de Ryck, John A. Dodds
Université de Toulouse, Mines Albi, RAPSODEE, Campus Jarlard, F-81013 Albi, France CNRS, Centre RAPSODEE, Campus Jarlard, F-81013 Albi, France
a b s t r a c t
Keywords: Dust emission Plume Image analysis PIVDust generation in solids handling involving free fall of bulk materials and impacts on a stockpile can cause many problems in industry and be a great danger for operators health. This paper describes an experimental set up to characterize the dust plume formed in free fall of powders from a hopper and investigates the influence of various outlet geometries on the dust plume. For this purpose an image analysis technique was developed to quantify the characteristics of the dust plume.
1. Introduction
Cooper and Arnold [1] have distinguished two opposite and extreme situations of the behavior of free falling particle columns. The first corresponds to when a bulk material composed of massive particles falls from a hopper.
Here, all particles in the stream accelerate at a rate equal to the gravitational constant. This situation generates high dust emission at impact because of the high kinetic energy developed during acceleration. The second case, more relevant for the study of dust emission during free fall, is when a stream of a very fine powder falls from the outlet of a hopper. This situation produces an important dust emission during the free fall (Fig. 1).
The aim of this present work is to study the influence of different kinds of hopper outlet geometries on dust emission during the free fall of fine particles. By using a PIV system, we were able to determine the velocity field of the falling particles and obtain a measurement of the spread angle of the plume which is correlated to the entrainment constant defined by Liu[2,3].
In addition, the vertical particle velocity upwas fitted by a Gaussian
curve[3], expressed as:
up= upmax:exp −ln2: 2r bg
!2!
; ð1Þ
Here, upmaxis the maximum particle velocity at the center line and
bg is the full width of the Gaussian distribution defined at half
maximum.
However, a limitation of velocity PIV systems is that pertinent measurements cannot be made when the particle flow is too concentrated, for example close to the outlet, or for high mass flow rates. In these high concentrated zones of the plume, the algorithm of cross correlation cannot calculate the motion of each particle, meaning that the particle velocities will be underestimated. Hence, we cannot use the PIV technique to estimate the plume radius. For this reason, we have developed an image analysis method, complemen-tary to the PIV analysis, to determine the plume width even when there is a highly concentrated flow of particle.
First of all, this paper describes the experimental set up and the different hopper outlet geometries used. Then, the image analysis method for the estimation of the plume radius is explained. This method is then applied to two inserts fitted at the outlet of the silo and the consequence on the dust emission is determined. Finally, we explain how this image analysis method can be used to estimate the particle concentration in the plume.
2. Experimental setup
The experimental set up is divided into two parts (Fig. 2). The first comprises a pneumatic conveyor (not shown in the figure) to transfer the solid material into a silo. The silo can be fitted with various outlet configurations to produce different mass flow rates of powder. The entire arrangement is mounted on three mass flow sensors.
The solid material flows out of the hopper and then undergoes free fall into the second section which is the test enclosure. This box is divided horizontally into two parts by an orifice plate which separates
⁎ Corresponding author.
E-mail address:[email protected](R. Ansart).
the dust produced by free fall and that due to the impact on the stockpile. Two air vents are located on the top of the box to allow the plume to expand freely as in quiescent ambient air. It is necessary that these vents be large enough to avoid the lowering of pressure created
by the induced air, which could cause the falling column of powder to contract. To achieve this, a pressure sensor is used to measure the air pressure between the top of the test box and the ambient environ-ment. We use Honeywell DC series with an accuracy of ±0.25% of full scale (2 500 Pa). Two other vents have been put on to the bottom part of the box to avoid an over-pressure generated by the particles impact on the stockpile. The size of these vents was determined in the same way by means of a pressure sensor. This box is mounted on a frame that can be raised or lowered to change drop height.
During the test, fluctuations were observed in the mass flow rate from the outlet of the hopper. This is caused by the flow resistance of the displaced interstitial air in the hopper. It is known that air pressure gradients across a flowing bed of powder can cause oscillatory flow (“ticking”) out of the nozzle[4,5]. It occurs because the movement of air is impeded inside a porous medium [6]. This is especially important for systems such as that dealt with here where the particle size is less than 100 μm. The mass flow is constant during the dis-charge to a tolerance of ± 0.5%.Fig. 3shows the residual fluctuations in the flow. We may also note that the jet contracts immediately after exiting from the hopper outlet and thereafter maintains an approx-imately constant radius for a considerable height before expanding afterwards.
For this study, we wanted to estimate the influence of different outlet devices on dust emission during the free falling process. A release tube of 6 mm was set in the middle of the test bin. It was inserted vertically into position near the outlet of the hopper (Fig. 4). In addition, a porous tube of 10 μm diameter with a length of 25 mm (Fig. 4) was set at the end of the release tube. By means of a pump connected to this release tube, we were able to create a radial aspiration just under the outlet and to measure the influence of this aspiration on the width of the plume. Then, we lengthened the release tube to modify the position of the porous tube in the plume. The first results lead us to study the influence of the release tube alone.
A PIV system is located in the top part of the equipment to take pictures of the plume. A pulsed laser sheet, generated by a laser Nd: YAG (wavelength: 532 nm, energy/pulse: 30 mJ, pulse duration: 4 ns and frequency: 15 Hz), illuminates a plane in the flow (Fig. 5) and the position of the particles are recorded. The CCD camera is able to acquire images up to 30 Hz pulse repetition rate.
However, due to the small fluctuations discussed above, it is impossible to determine a stationary flow of powder. Thus, a mean particle image is created by adding a sequence of 500 images. Finally, it has been shown that over 500 images the correction on the mean value is less than ±0.5%.
stockpile Fugitive dust
Entrained air
Hopper
Dilating material
Core of particle plume
Boundary layer
Fig. 1.Dust generation for falling stream of material.
Fig. 2.Sketch of the experimental set up. Fig. 3.Photo of the first 30 cm of a powder stream from the hopper outlet. –
The silica gel used in this study is a sieve fraction of 40 to 60 μm. The particle density is ρp= 1000 kg.m− 3 and loose poured bulk
density , ρb= 550 kg.m− 3. The same powder has been reused and no
particular variation in the measured properties has been noticed between the first and last experiments. If attrition occurs, it has no observable consequences on the aerodynamical properties studied here.
Since the hopper is made of PMMA and the release tube is in stainless steel it was necessary to study if this powder is prone to electrostatic charging. First of all, the electrostatic relaxation time of the powder was measured: the silica gel is laid on an earthed steel sheet, then charged by a corona and the time for the potential to fall to 36.8% of it initial value is measured. The relaxation time of the silica gel is less than 30 ms and it is just able to reach only 10% of the initial potential applied. Hence, if this powder acquires any electric potential, its discharge will be
quasi-instantaneous. Moreover, triboelectrification tests have demonstrated that the silica gel is insensitive to stainless steel and PMMA.
3. Image analysis
This section presents the alternative method based on an image analysis algorithm which is used for plume measurements when the flow rate of particles is too high for the standard PIV technique. The algorithm has been developed with Matlab® and its Image Processing Toolbox, and the aim is to determine the value of the plume width using the images obtained with the experimental setup used for the PIV.
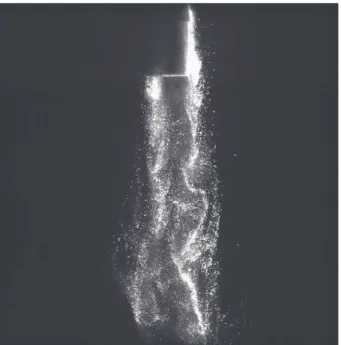
Each set of images corresponds to 505 pictures taken with a frequency of 15Hz, in which the falling particles are lit by the laser sheet. Fig. 6 gives an example of one of the 500 pictures. The corresponding experimental set up is: mass flow rate = 0.9 g s− 1,
drop height = 22 cm, tube = yes, tube length = 17 cm. The tube around which the particles flow is visible in this picture.
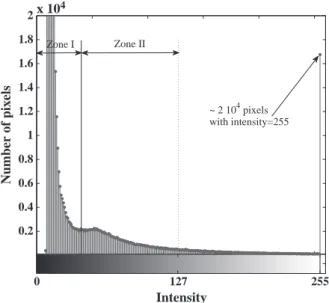
Fig. 7is the pixel histogram of the grayscale image 6, which shows the distribution of the pixel intensity values in the range [0–255]. Most of the pixels of this image (900,000 among a total of 1000 × 1016 pixels) have a low intensity and correspond to the background of this image. In the histogram, they are group together as the ’Zone I’. Zone II corresponds to the pixels that are not directly lit up by the laser beam but receive enough diffracted and reflected light to be detected on a picture. The pixels from the zones I and II have to be subtracted, and only those which are in the laser sheet are to be taken into account. We use a global threshold to convert each picture of a image set to a series of binary images. The intensity level is first calculated by Otsu's method[7], but since the overall number of pixels of intensities in the range 100–254 is not relevant compared to those of intensity 255, we simplify the algorithm and use a constant threshold level of 127. The thresholded binary image generated from picture 6 is shown inFig. 8. In this image, each white pixel (110 × 110 μm2) corresponds to the
presence of material in the laser sheet.
An example of a mean image constructed by adding all the thresholded images of a same series is presented inFig. 9. This image has been obtained for the experiment with tube shown inFig. 6. It can be noticed that the resulting image (Fig. 9) is non-symmetric. This is due to the presence of reflects of the laser sheet on the surface of the tube and on the particles. Even without tube this non-symmetry
Fig. 4.Hopper with the tube.
occurs on the same side as the laser one, but it becomes visible only for high flow rates and it enlarges when increasing the particle density in the plume.
In the mean image the gray intensity of a pixel normalized to range [0,1], gives the number of white pixels versus the number of images of the series. The mean image has been used as the base to calculate macroscopic properties characterizing the plume. A high frequency noise is present in the intensity surface of this image in the [x, y, intensity] space. A DFT (Discrete Fourier Transform) or a spline filtering could be used to partially suppress this noise.Fig. 10shows an example of this surface generated with the center part of the image 9. In this figure, the concavity at the bottom of the tube can be seen. This concavity slowly decreases downstream from the tube as the stream of particles become narrower.
For a given height, the intensity is function of horizontal posi-tion. We use a Levenberg Marquardt algorithm to fit this curve with a 3-parameter Gaussian model as shown inFig. 11. For experiments without an outlet tube, the curve fits almost perfectly as shown in
Fig. 12. For these two figures, the chosen height is the middle height of the corresponding mean images. Several trials have been done on mean images to evaluate at sight what could be the width of the
particle flow plume. The best corresponding definition seems to be the width of the base (CD) of the ABCD trapezium shown inFig. 11. The points A and B of the trapezium are the inflection points of each side of the Gaussian curve and the lines (AC) (BD) are tangent to the curve. It has been noticed that the non-symmetry of the mean image such asFig. 9, has no influence on the symmetry of the resulting base (CD).
The values of the trapezium base for each experiment have been used to compare experiments with different mass flow rates with and without a tube.
4. Results and discussion
The width of the plume has been determined by image analysis.
Fig. 13illustrates the evolution of the Gaussian fitted intensity profile of the particles during free fall without tube. It may be noted that when the drop height increases the maximum of the Gaussian curve becomes less, while the width of the trapezium base increases (Fig. 14). Hence, we may define a slope of the plume corresponding to the spread angle which is close to 4%.
This spread angle, corresponding to the dilation behavior of the plume, is strongly dependent on the characteristics of the powder, in particular its particle size distribution. For a bulk material of massive particles falling from the hopper, the stream takes the shape of a column. On the other hand, for very fine powder falling from the outlet of a hopper, the flow should develop as a miscible plume.
What can also be noticed is the overall decrease of the integral under the curve with the drop height. As mentioned above, this surface is linked to the quantity of particles inside the laser sheet. So this decrease is obviously correlated to the expansion of the plume of particles, which occurs in all directions as a function of the drop height.
4.1. Influence of the aspiration
We have tried to reduce the plume width by sucking in the ambient air induced into the plume by means of a porous tube connected to a pump, set just below the outlet (L = 0 cmFig. 4). The first measurements show that it is very difficult to create a radial aspiration in this zone since the powder sticks on the porous surface of the tube. Moreover as mentioned above, the jet contracts by itself immediately after exiting from the outlet. The lower pressure created by the particle acceleration just after the outlet combine to the slope
Intensity
0 127 255 0.2 0.4 0.6 0.8 1 1.2 1.4 1.6 1.8 2x 10
4Number o
f p
ixels
Zone I Zone II ~ 2 104 pixels with intensity=255Fig. 7.Histogram distribution of picture 6.
Fig. 8.Thresholded image from picture 6.
of the hopper converging generate a reduction of the plume section just on few centimeters after the outlet.
We have also tested the influence of the porous tube set further down from the outlet (L = 15 cmFig. 4) in the expansion zone of the plume. Three different volume flow rates of aspiration have been tested on the plume for two mass flow rates about Qm= 3.3 kg.s− 1
and Qm= 0.9 kg.s− 1. The width of the plume is estimated at 22 cm
from the outlet.
The width is measured to be exactly the same for various intensities of the radial aspiration (Table 1). This result can be explained by the study of the images. The meanimage 9shows that the flow of particles around the tube takes the exact shape of the tube. Thus, we have to study the influence of the stainless steal tube alone on the plume.
4.2. Influence of the tube
To determine the influence of the release tube alone, we have measured the width of the plume at 7 cm below the tube. This tube is set at 15 cm from the outlet in the jet, without the porous tube. The measurement done for a low mass flow rate equal to Qm= 0.9 kg.s− 1,
shows that the plume without the tube is about 11% thicker than with the tube.
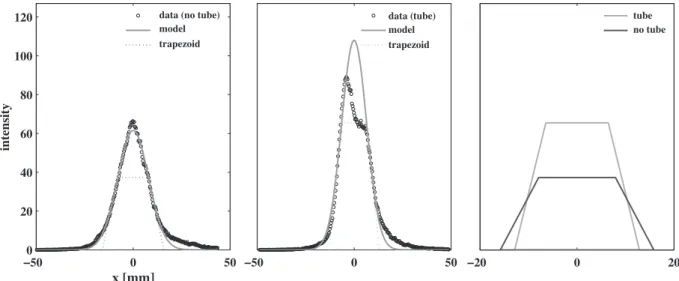
For a tube of 45 cm, the images have been taken at 50 cm from the outlet and the intensity profile obtained is presented in Fig. 15
showing the influence of the long tube on the intensity profile. The plume width is estimated by the base length of the trapezium. The plume with the tube is narrower than that without the tube. The width reduction is about 14% for a mass flow rate equal to
Qm= 0.9 kg.s− 1. Moreover, the maximum of the intensity of the
Gaussian profile of the plume with the tube is higher than that without the tube. This may be correlated to a higher particle volume fraction. In fact, the intensity corresponds to a quantity of powder. The tube induces a lower porosity of the air/particle mixture behind itself.
It is noteworthy that this reduction depends on the tube length. The reduction of the plume radius is about 14% for a length tube of 45 cm and 11% for a tube of 15 cm. As discussed above, this powder is not prone to electrostatic charge so this width reduction may be attributed to the friction between the powder and the tube. For this
Fig. 10.Splined surface of image 9.
Fig. 11.Intensity profile with the tube.
Fig. 12.Intensity profile without the tube.
-30 -20 -10 0 10 20 30
x [mm]
intensity
80 40 0reason the effect may be taken to be due to the friction between the powder and the tube. However, further experiments must be done to confirm this result. Nevertheless, this hypothesis made on the friction seems to be confirmed byFig. 16which presents the vertical particle velocity profile with and without the tube. We note that the profile is a Gaussian curve with a maximum at the center. This maximum of the velocity is about 12% lower with the tube than without, and the Gaussian velocity is narrower with the tube. Moreover, we may note that the Gaussian velocity with the tube is not completely smooth. This fact may be assigned to the way the stream is re-formed behind the bottom of the tube. The presence of the tube in the stream contracts the plume, keeps a high particle volume fraction and prevents the particles from breaking away from the core and becoming airborne. The contact of the particles with the tube during
the free fall generates shear which is responsible of the reduction of the particle velocity as the particles are slowed down by the friction on the tube.
4.3. Correlation of the intensity of light diffracted by the particle and the particle volume fraction
The intensity profile of light diffracted by the particles has been fitted by a Gaussian curve for a given drop height. This intensity is proportional to the particle concentration and may be written as:
i = imax·exp −
r lg
!2!
; ð2Þ
where imaxis the maximum of the light intensity at the peak of the
Gaussian curve and lg the width of the Gaussian defined at the
inflection points.
We assumed, as a first step, that this light intensity is proportional to the particle concentration in the plume: i = a ⋅ (ρpϕ), where a is a
constant parameter, ρp is the particle density and ϕ the particle
volume fraction. 16 26 36 46 56 66 18 20 22 24 26 28 30 32
drop height [cm]
plume width [mm]
Fig. 14.Plume width of curves (Fig. 13).
Table 1
Process parameters.
Qa= 0 ml.s− 1 Qa= 2 ml.s− 1 Qa= 4 ml.s− 1
Qm= 0.9 g.s− 1 W = 27.09 mm W = 27.53 mm W = 26.82 mm
Qm= 3.2 g.s− 1 W = 32.54 mm W = 33 mm W = 32.34 mm
Fig. 15.Influence of the tube in the dust plume, Qm= 0.9 g s− 1, drop height= 50 cm. On the right image, the two trapezoids of the left images are displayed.
40 30 20 10 0 10 20 30 40 -1.5 1 0.5 0
X [mm]
Particle velocity [m/s]
tube no tubeFig. 16.Particle velocity, Qm= 0.9 g s− 1, drop height = 50 cm. –
The mass flow rate through an horizontal section S of the plume may be written as:
Qm=∬
Sρpϕ·up·ndS; ð3Þ
where upis the vertical particle velocity expressed by the Eq.(1).
These equations lead to rearranging the mass flow rate as: Qm= imax·upmax·
π a 1 l2 g + 4ln2 b2 g !−1 : ð4Þ
During the free fall process, the image series have been taken with the same mass flow rate for the different drop heights. As the parameter a is assumed to be constant, the parameter β defined by: β= imax·upmax· 1
lg+ 4ln2 b2 g !−1 ð5Þ should also be constant. To make this calculation, imax and lg are
obtained from the intensity profile of light diffracted by the particles. We are not able to measure the particle velocity in all of the stream, especially in the very high concentration zone, so the maximum particle velocities at the peak upmaxare estimated from the numerical
two-phase flow model of Liu[2]that we have previously validated in other experiments[3].
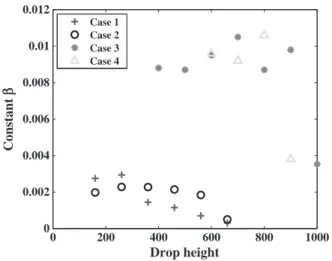
Fig. 17, corresponding to the operating condition ofTable 2, shows that the parameter β is almost constant for the same free fall process except when the drop height is too high. In fact, when the flow is much too dilute the value of β decreases. In this case, the plume width is not easily measurable since the corresponding profile is very flat. A sensitivity analysis of the various parameters of the equation of β shows that the width lgof this curve is the parameter with the greatest
influence on the expression of β.
It is worthwhile noting that the image analysis method was developed here for concentrated particle flow, but is not easily applicable to dilute flow because the variations of the plume width lg
are too high.
Finally, it is noteworthy, that the constant parameter β changes with the process studied. The value of the parameter a, which
connects the particle concentration with the light intensity diffracted by the particle, is a function of the optical set up used for the each image series.
Thus, a calibration of the camera system, for a constant mass flow rate, according to the particle velocity obtained by the PIV, enables us to determine the particle concentration. We assume that parameter a is constant which correlates the concentration of particles with the mean value of light intensity diffracted by particles on a series of images. The parameter a is a function of the optical set up used for each image series.
For a flow of particles slightly dense and symmetric, we are able to use a specific calibration to obtain the β parameter. Hence, we can access to the radius of the plume for several heights and the concentration of particles at each point of the stream. However, for a concentrated flow or non symmetric, we can determine the border of the plume and estimate the spread angle of the plume. This spread angle is the only parameter needed to predict the plume behavior.
5. Conclusion
This paper presents an image analysis method for determining the characteristics of a falling plume of powder even when the flow of particles is too concentrated. In this method, we generate a mean image of the thresholded series of images for a given experiment, which allows us to define a width of the powder plume and to quantify the influence of various outlet geometries.
The image analysis method has shown that the radial aspiration created by a porous tube connected to a pump has no influence on the dilatation behavior of a plume. The authors think that a radial aspira-tion in the plume is probably a valid idea for controlling powder plume expansion, but using a release tube to connect the pump and the porous tube is not a suitable way of doing this as the presence of the release tube in the jet disturbs the particles stream.
Nevertheless, this release tube creates another phenomenon by slowing down the particles and concentrating the plume by friction forces which reduces the possibility of particles becoming airborne. By using this tube, we have been able to reduce the width of the plume by 14% for a free fall of 50 cm.
Finally, the image analysis method enables for a symmetric flow to access to the particle concentration in the diluted zone of the dusty plume. In the dense zone of the plume, we can determine the evolution of the plume through the measurement of the plume radius.
Acknowledgments
The authors would like to thank Jean-Raymond Fontaine, Fabien Gerardin and Michel Pourquet of the INRS for the discussions on this subject. This research is financed by INRS, CNRS and FNS as part of an ACI project.
References
[1] Paul Cooper, Peter C. Arnold, Air entrainment and dust generation from a falling stream of bulk material, Kona 13 (1995) 125–134.
[2] Ze Qin Liu, Air entrainment in free falling bulk materials University of Wollongong PhD, 2001.
[3] Ansart Renaud, Alain de Ryck, John A. Dodds, Roudet Matthieu, Fabre David, Charru François, Dust emission by powder handling: comparison between numerical analysis and experimental results, Powder Technology 190 (1–2) (2009) 274–281. [4] X.-l. Wu, K.J. Maloy, A. Hansen, M. Ammi, D. Bideau, Why hour glasses tick, Physical
Review Letters 71 (1993) 1363–1366.
[5] C. Veje, P. Dimon, The dynamics of granular flow in an hourglass, Granular Matter 3 (2001) Number 3 / August.
[6] Matthias E. Mobius, Clustering instability in a e freely falling granular jet, Physical Review E 74 (5) (2006).
[7] N. Otsu, A threshold selection method from gray level histograms, IEEE Trans-actions on Systems, Man, and Cybernetics 9 (1) (1979) 62–66.
0 200 400 600 800 1000 0 0.002 0.004 0.006 0.008 0.01
Drop height
Constant
β
Case 1 Case 2 Case 3 Case 4 0.012Fig. 17.Variations of the parameter β.
Table 2
Process parameter for the calculation of the parameter β.
Case 1: 60 μm Qm= 0.2 g.s− 1 Case 2: 130 μm Qm= 0.5 g.s− 1 Case 3: 130 μm Qm= 1.9 g.s− 1 Case 4: mix. 60/130 μm Qm= 2.2 g.s− 1