Open Archive TOULOUSE Archive Ouverte (OATAO)
OATAO is an open access repository that collects the work of Toulouse researchers and
makes it freely available over the web where possible.
This is an author-deposited version published in :
http://oatao.univ-toulouse.fr/
Eprints ID : 10044
To link to this article : DOI:10.1016/j.envpol.2013.08.006
URL :
http://dx.doi.org/10.1016/j.envpol.2013.08.006
To cite this version :
Foan, Louise and Leblond, Sébastien and Thöni, Lotti and Raynaud,
Christine and Santamaria, Jesus Miguel and Sebilo, Mathieu and
Simon, Valérie Spatial distribution of PAH concentrations and
stable isotope signatures (į13C, į15N) in mosses from three
European areas – Characterization by multivariate analysis. (2014)
Environmental Pollution, vol. 184 . pp. 113-122. ISSN 0269-7491
Any correspondance concerning this service should be sent to the repository
administrator:
[email protected]
Spatial distribution of PAH concentrations and stable isotope
signatures (
d
13
C,
d
15
N) in mosses from three European
areas
e Characterization by multivariate analysis
L. Foan
a,b,*, S. Leblond
c, L. Thöni
d, C. Raynaud
a,b, J.M. Santamaría
e, M. Sebilo
f,
V. Simon
a,baUniversité de Toulouse, INPT, LCA (Laboratoire de Chimie Agro-Industrielle), ENSIACET, 4 Allée Emile Monso, F-31030 Toulouse, France bINRA, LCA (Laboratoire de Chimie Agro-Industrielle), F-31030 Toulouse, France
cMuseum National d’Histoire Naturelle, Service du Patrimoine Naturel, UMR7205 (OSEB), 57 rue Cuvier, 75005 Paris, France dFUB, Research Group for Environmental Monitoring, Alte Jonastrasse 83, CH-8640 Rapperswil-Jona, Switzerland
eUniversidad de Navarra, Departamento de Química y Edafología, LICA (Laboratorio Integrado de Calidad Ambiental), c/Irunlarrea 1,
31008 Pamplona, Spain
fUPMC Univ Paris 06, UMR Bioemco, 4 place Jussieu, 75252 Paris Cedex 05, France
a b s t r a c t
Polycyclic aromatic hydrocarbon (PAH) concentrations and N, C stable isotope signatures were deter-mined in mosses Hypnum cupressiforme Hedw. from 61 sites of 3 European regions: Île-de-France (France); Navarra (Spain); the Swiss Plateau and Basel area (Switzerland). Total PAH concentrations of 100e700 ng g!1, as well asd13C values of !32 to !29& andd15N values of !11 to !3& were measured.
Pearson correlation tests revealed opposite trends between high molecular weight PAH (4e6 aromatic rings) content andd13C values. Partial Least Square regressions explained the very significant correlations (r > 0.91, p < 0.001) between high molecular weight PAH concentrations by local urban land use (<10 km) and environmental factors such as elevation and pluviometry. Finally, specific correlations between heavy metal and PAH concentrations were attributed to industrial emissions in Switzerland and road traffic emissions in Spain.
1. Introduction
Persistent organic pollutants (POPs) are defined as organic substances which are a concern for the environment and human health as they: possess toxic characteristics; are persistent; bio-accumulate; are prone to long-range transboundary atmospheric transport and deposition; are likely to cause significant adverse human health or environmental effects near to and distant from their source (UNECE, 1998). They are mainly of anthropogenic origin, show weak degradability and consequently are distributed in the environment worldwide, including in remote areas like Poles (Gustafsson et al., 2005). The combination of resistance to meta-bolism and lipophilicity means that POPs will accumulate in
foodchains (Jones and de Voogt, 1999). The 1998 Aarhus Protocol on POPs (LRTAP Convention) and the 2001 Stockholm Convention on POPs e a global treaty under the United Nations Environment Programme (UNEP) e aim at eliminating and/or restricting the production and use of selected POPs.
Polycyclic aromatic hydrocarbons (PAHs) are a family of chemical compounds composed of carbon and hydrogen atoms which form at least two condensed aromatic rings. PAHs originate from fossil or non-fossil fuels by pyrolysis or pyrosynthesis. They are emitted into the atmosphere mainly from anthropogenic sources but they also originate from natural ones such as volcanic eruptions and forest fires (Simonich and Hites, 1995). The main sources of PAHs in the environment are aluminium production, coke production from coal, wood preservation and fossil fuel combustion (traffic, domestic heating, electricity production) (Wegener et al., 1992). PAHs are considered as POPs due to their low rates of degradation, toxicity and potential for both long-range transport and bioaccumulation in living organisms (Holoubek et al., 2007a). Regulation of PAH emissions and reliable monitoring of PAH concentration in ambient air is thus of paramount importance for public health.
* Corresponding author.
E-mail addresses: [email protected], [email protected] (L. Foan),
[email protected](S. Leblond),[email protected](L. Thöni),[email protected]
(J.M. Santamaría), [email protected] (M. Sebilo),[email protected]
Despite recent effort to investigate PAH distribution and fate in air, water and soil, few studies have provided extensive information on spatial and temporal trends of PAH atmospheric deposition, due to high investment and running costs of adapted analytical devices. Biological monitoring is an alternative method consisting of an integrative technique able to assess the environment contamina-tion based on studies of living organisms exposed to pollucontamina-tion. Because of their capacity to act as efficient interceptors and accu-mulators of chemicals, plants are widely used as passive bio-monitors in urban and rural environments (Garrec and Van Haluwyn, 2002; Market et al., 2003). The most common bio-monitor systems are conifer needles (Ratola et al., 2010), lichens (Blasco et al., 2011) and mosses (Harmens et al., 2013).
Bryophytes in particular have been employed over the past de-cades as biomonitors for the assessment of airborne deposition of heavy metals (Rühling and Tyler, 1969; Tyler, 1990; Harmens et al., 2012), radionuclides (Sumerling, 1984; Sawidis et al., 2009), POPs (Carlberg et al., 1983; Cipro et al., 2011), nitrogen (Solga et al., 2005; Harmens et al., 2011b) and stable isotopes of carbon, sulphur and nitrogen (Solga et al., 2005; Xiao et al., 2010; Cipro et al., 2011). Characteristics of mosses make them excellent subjects for bio-monitoring. As they do not have any root system and barely no cuticle, mosses obtain most of their nutrients from the atmosphere (wet and dry deposition). Rhizoids can assure a part of mosses ni-trogen nutrition by leading water from the soil to the plant by capillary external conduction (Schofield, 1981; Glime, 2007). How-ever,Ayres et al. (2006)showed, for two different types of pleuro-carpous mosses, that nitrogen assimilation from wet deposition is fairly more important than from the soil. Moreover, mosses high cationic exchange capacity and surface to volume ratio favour the accumulation of large amounts of pollutants (Gerdol et al., 2002a).
The present study takes part in a pilot project of the Interna-tional Cooperative Programme on Effects of Air Pollution on Natural Vegetation and Crops (ICP-Vegetation) established under the United Nation Economic Commission for Europe (UNECE) Convention on Long-Range Transboundary Air Pollution (LRTAP) to investigate the suitability of mosses as biomonitors of POPs at a large spatial scale (Harmens et al., 2011a). The participants of ICP-Vegetation have determined heavy metals and nitrogen contents in mosses sampled over Europe with a high spatial resolution (25 " 25 km) every 5 years (Rühling and Tyler, 1969; Tyler, 1990; Harmens et al., 2010, 2011b, 2012). The pilot study may lead to an extension of the programme to POPs, particularly to PAHs.
To further investigate the quantitative importance of different sources of deposition, the use of natural stable isotopes abundance levels in mosses provides a powerful approach for understanding environmental interactions. Isotope composition of elements, such as carbon and nitrogen, changes in predictable ways during their course through the biosphere, which makes them ideal tracers of the pathways and origins of these elements (Tcherkez, 2010). The ICP-Vegetation programme is therefore also focused on stable isotope signatures for studying atmospheric deposition (Harmens et al., 2011a).
This study presents the PAH concentrations and
d
13C andd
15N measured in mosses Hypnum cupressiforme Hedw. from 61 sites of three European areas located in France, Spain and Switzerland. To identify common trends between pollutants and the parameters of influence on their content in mosses, data was submitted to multivariate analysis with site-specific and regional data.2. Material and methods
2.1. Study area
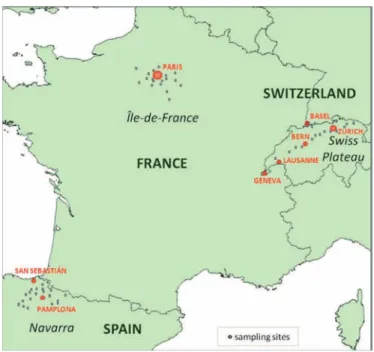
The study was carried out over three European areas: Île-de-France, France (18 sites); Navarra, Spain (23 sites); Swiss Plateau and Basel region, Switzerland (20
sites). The sampling covered a total land surface of 40 000 km2(Fig. 1). The regions
were chosen for their different geomorphologic, climatic and soil occupation
char-acteristics. Île-de-France is located in the Paris Basin (43e173 m of elevation) and
characterized by an oceanic climate (583e755 mm of rainfall) (MeteoFrance, 2011).
The area is strongly urbanized by Paris metropolitan area (972 hab km!2) but the
land is also occupied by intensive cereal farming (INSEE, 2009). Located in the
Western Pyrenees and close to the Biscay Bay, the sites of Navarra are mountainous
(215e1220 m) and generally very humid (377e1900 mm) (GN, 2011). The area is
covered by forests and grasslands dedicated to livestock farming. Urbanization is
poor (97 hab km!2) and population is concentrated in industrial areas such as
Pamplona (Navarra’s capital city) and the border with the Basque country in the
Northwest (IEN, 2011). The Mitteland is formed by a vast plateau stretching across
Switzerland, between the Alps and Jura mountain ranges (270e685 m). The climate
is continental but relatively humid (826e1214 mm) due to the Alps which act as a
weather front barrier (Meteotest, 2008). Population density is intermediate between
the two other regions (450 hab km!2) (OFS, 2011). The land is occupied by a mosaic
of cities (Zürich, Geneva, Basel, Berne, Lausanne.) separated by intensive cereal farming areas. Basel area is characterized by very intense industrial activity.
2.2. Study design and sample collection
The study was designed and the samples were collected following the
recom-mendations of the ICP-Vegetation manual elaborated for moss surveys (
ICP-Vegetation, 2010). Sampling was carried out with a minimal resolution of 20 " 20 km. All sites were located in forests, at least at 300 m from main roads (highways), villages and industries, and at least at 100 m from smaller roads and houses. One composite sample, consisting of five to ten subsamples, was collected from each sampling point within an area of 50 " 50 m. In order to determine the overall variability associated with the entire procedure (sampling and analysis), triplicate moss samples were collected from 10 sites of Île-de-France.
Sampling was conducted between August and October 2010: Aug 18eOct 18 in
Switzerland, Sept 19eOct 16 in Spain and Oct 4eOct 10 in France. Approximately
0.04 m2of the species Hypnum cupressiforme Hedw. was collected per sample from
horizontal parts of non decomposed deadwood (bark of branches or tree stumps) with disposable powderless nitrile gloves. Samples were taken exclusively from wood to reduce contamination by soil and run-off water. The canopy was mainly constituted by deciduous broad-leaved trees in France and Spain and by mixed forests of deciduous broad-leaved trees and conifers in Switzerland. The sub-samples were laid side by side in 1 L polyethylene bags, and then placed in iceboxes for
trans-portation to local laboratories, where they were frozen at !20#C: Museum National
d’Histoire Naturelle (MNHN) in France, Laboratorio Integrado de Calidad Ambiental
(LICA) in Spain and Forschungsstelle für Umweltbeobachtung (FUB) in Switzerland. The samples were kept frozen during transportation to the Laboratoire de Chimie
Agro-industrielle (LCA) in Toulouse (France) where sample preparation was conducted.
2.3. Sample preparation
Extraneous material attached to the moss samples was removed with stainless
steel tweezers. The green and greenebrown shoots from the last three years growth
were withdrawn using stainless steel tweezers and scissors. The unwashed samples
were freeze-dried with an Alpha 2e4 LD apparatus for 24 h (Martin Christ, Osterode
am Harz, Germany), then ground to a fine powder in a stainless steel mill (particle size < 0.5 mm).
2.4. PAH determination
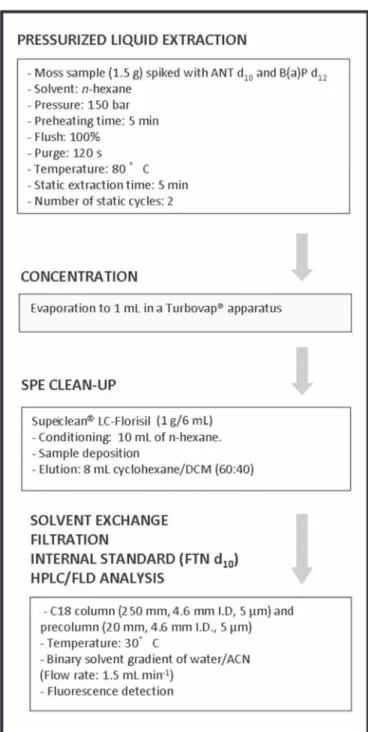
PAH content in mosses was determined by pressurized liquid extraction (PLE) and solid-phase extraction (SPE) cleanup, in association with analysis by high per-formance liquid chromatography coupled with fluorescence detection (HPLCeFLD).
Main parameters are summarized inFig. 2. Details on the analytical method, its
optimization, quality assurance and quality control (QA/QC) are described in a
previous study (Foan and Simon, 2012). The linearity range for the PAH analysis
extends from 0 to 150 ng mL!1with regression coefficients of 0.9993e0.9999. The
repeatability of the analysis, determined with a 2 ng mL!1standard solution
(n ¼ 10), showed uncertainty lower than 10%. Quantification limits in mosses range
between 0.1 and 2.5 ng g!1(dry weight). The reproducibility of the method, tested
by repeating the entire extractionepurificationeanalysis procedure (n ¼ 6), showed
standard deviations for each PAH between 1 and 22%. The accuracy was also verified with the reference material IAEA-140-OC (ANALAB, Bischheim, France). All PAHs measured were included in the reference concentration ranges (95% confidence intervals) except for B(a)A, overestimated because of interferences with other reference molecules (PCBs or pesticides).
A standard mix containing acenaphthene (ACE), fluorene (FLR), phenanthrene (PHE), anthracene (ANT), fluoranthene (FTN), pyrene (PYR), benz(a)anthracene (B(a) A), chrysene (CHR), benzo(b)fluoranthene (B(b)F), benzo(k)fluoranthene (B(k)F), benzo(a)pyrene (B(a)P), dibenz(a,h)anthracene (D(ah)A), and benzo(ghi)perylene
(B(ghi)P) at 10mg mL!1of acetonitrile, was used for calibration (Mix 16 HAP, LGC
Standards, Teddington, UK). Deuterated PAHs were used as surrogate standards
(anthracene d10and benzo(a)pyrene d12at 10mg mL!1in acetonitrile) and as
in-ternal standard (fluoranthene d10at 100mg mL!1in acetonitrile) (LGC Standards,
Teddington, UK). All solvents were HPLC grade: acetonitrile (ACN), cyclohexane, dichloromethane (DCM) and n-hexane were provided by Scharlau (Sentmenat, Spain) and Milli-Q water by Millipore (Molsheim, France).
2.5. Elemental analysis and isotopic measurements
Moss samples were also analysed at the Laboratoire de biogéochimie et écologie
des milieux continentaux (Paris, France) for their carbon and nitrogen content and
their respective stable isotope signatures (d13C andd15N). Tissue C and N contents (%,
dry weight) were determined by an elemental analyzer (EA1108, Eurovector, Milan, Italy) with an analytical precision of 0.1%. Calibration was performed using tyrosine (ThermoQuest Italia, Radano, Italy).
Moss samples were thermally decomposed to CO2and N2and isotope ratios of
total carbon and nitrogen were determined by an elemental analyser coupled to a continuous flow isotope ratio mass spectrometer (EA-CF-IRMS) (Elementar-Iso-prime, Manchester, UK). Based on the measurements of %C and %N, samples were
weighed and put in tin capsules (250mg for C and 150mg for N). Carbon and nitrogen
isotope data are expressed in the usual delta notation (d13C andd15N), defined as:
dsampleð&Þ ¼ !R sample Rstandard! 1 " " 1000
where R is the isotope ratio13C/12C or15N/14N. The international standard for C is Pee
Dee Belemnite (PDB) for which the ratio13C/12C is 0.01112372. The international
standard for N is atmospheric nitrogen (Mariotti, 1983, 1984), for which the ratio
15N/14N is 0.0036765.
Different reference materials were used for carbon and nitrogen: tyrosine
(d13C ¼ !23.2&,d15N ¼ 9.98&, laboratory standard), IAEA-N
1(d15N ¼ 0.3&),
IAEA-N2 (d15N ¼ 20.3&) and IAEA-N3 (d15N ¼ 4.5&) and VPDB (d13C ¼ !23.2&).
Analytical precision is about '0.1& ford13C and '0.2& ford15N.
2.6. Statistical analysis
One-way analysis of variance (ANOVA) was performed to validate the sampling procedure and to identify significant differences between moss data obtained in the three European areas. To study correlations between the variables, Pearson’s cor-relation coefficients were calculated. Partial least square (PLS) regression was per-formed to determine the influence of site-specific and regional parameters on pollutant content in mosses. The statistical analysis was conducted using XLSTAT 2008 (Addinsoft, Paris, France) software.
3. Results
3.1. Validation of the sampling procedure
At a 95% confidence level, individual PAH concentrations were determined with a maximal variability between the triplicate samples ranging between 16% and 25%, for benzo(k)fluoranthene and pyrene respectively. Total PAH concentrations (for 13 com-pounds) were measured with a maximal variability of 20%. Elemental analysis revealed up to 4% and 11% variability for carbon and nitrogen respectively, as
d
13C andd
15N values were measured with respective maximal uncertainties of 2% and 15% (95% confi-dence level). ANOVA showed significantly higher differences be-tween PAH concentrations, C and N content and stable isotope signatures measured in the mosses from the 10 French sites than the variability between triplicates collected at the sites (p < 0.0001). Therefore, composite sampling with 5e10 sub-samples appears to integrate well spatial variability on the sam-pling site.Fig. 2. Diagram illustrating all operations of the analytical procedure to determine PAH concentrations in moss samples by solvent extraction.
3.2. PAH concentrations
Individual and total PAH concentrations of 13 compounds measured in mosses from the three areas of Europe are presented inTable 1. Total concentrations ranged from 98.1 to 697.8 ng g!1 (dry weight). Average content was significantly higher in France and Switzerland, with respective values of 264.0 and 241.5 ng g!1, against 182.1 ng g!1in Spain (ANOVA, p < 0.05). The mosses from Switzerland showed the widest range of concentrations (98.1e 697.8 ng g!1), those from France the lowest (148.5
e359.9 ng g!1). However, the minimal total content was significantly higher in French samples (ANOVA, p < 0.05). In the three regions, the major compounds were, by increasing order of importance, phenan-threne, fluoranthene, fluorene and pyrene. Their content in mosses generally exceeds 10 ng g!1and can reach values over 100 ng g!1. On the contrary, acenaphtene, anthracene and dibenzo(a,h) anthracene presented concentrations close to quantification limits (wng g!1). Several compounds of high molecular weight (B(a)A, CHR, B(b)F, B(k)F, B(a)P, B(ghi)P) presented low concentrations in mosses from Spain (0.8e13.4 ng g!1), but were relatively more important in samples from France (4.9e33.9 ng g!1) and Switzerland (2.6e70.6 ng g!1). For example, benzo(a)pyrene, considered as the most toxic PAH (IARC, 2010), showed respective average concentrations of 11.2 and 9.9 ng g!1 in France and Switzerland, against 3.5 ng g!1in Spain.
3.3. Elemental and isotopic measurements
Carbon and nitrogen content as well as
d
13C andd
15N measured in mosses from the three areas of Europe are summarized inTable 1. Elemental analysis revealed carbon content ranging between 38.4 and 47.3% (dry weight) and nitrogen content ranging between 0.9 and 2.1% (dry weight). No significant differences were observed between the three regions studied. Stable isotope signatures ranged from !32.3& to !28.7& ford
13C and from !10.3& to !3.0& ford
15N.d
13C values were significantly higher in Spain than in the two other areas (ANOVA, p < 0.05), with an average value of !29.5 ' 0.6& (n ¼ 23), against !31.0 ' 0.7& (n ¼ 18) and !30.8 ' 0.7& (n ¼ 20) in France and Switzerland respectively.d
15N values showed similar ranges in France (!8.0& to !3.3&) and Spain (!7.9& to !3.0&), and close average values: !6.0& inFrance and !5.6& in Spain. The mosses from Switzerland pre-sented a wider range for
d
15N, with values from !10.8& to !3.3& and a significantly lower average value of !6.9% (ANOVA, p < 0.05).3.4. Correlation between variables
A Pearson correlation test was carried out on the data obtained from the 61 sites (Table 2). All individual PAH concentrations are linearly correlated with the total concentrations. Particularly, PHE and FTN concentrations are very significantly correlated with the total concentrations, with r ¼ 0.903 and 0.975 respectively (p < 0.0001). Several groups of individual PAH concentrations show significant linear correlations:
- light PAHs (2-ring compounds): ACE and FLR (r ¼ 0.625,
p < 0.0001),
- intermediate PAHs (3 and 4-ring compounds): PHE, ANT, FTN and PYR (r є [0.500; 0.886], p < 0.0001),
- heavy PAHs (4, 5 and 6-ring compounds): B(a)A, CHR, B(b)F, B(k)F, B(a)P, B(ghi)P, D(ah)A (r є [0.914; 0.997], p < 0.0001). There are also significant correlations between FLR and PHE (r ¼ 0.532, p < 0.0001), as well as between PHE, FTN and all heavy PAHs (r є [0.506; 0.759], p < 0.0001).
Concerning elemental and isotopic analysis,
d
15N values showed a low positive linear correlation with N content (r ¼ 0.305; p < 0.05) and a low negative linear correlation with C content (r ¼ !0.290,p < 0.05). N content showed low linear correlations with heavy
PAHs such as B(a)A, CHR, B(b)F and B(k)F (r є [0.253; 0.283],
p < 0.05).
d
13C values showed low negative linear correlations withFTN, all heavy PAHs and total PAH concentration (r є [!0.431; !0.302], p < 0.05).
3.5. Correlation with site-specific and regional characteristics
Partial least square (PLS) regression was carried out between the variables measured in mosses (quantitative variables) and site-specific and regional characteristics (explicative variables): alti-tude, annual precipitation and soil occupation, obtained from the CORINE Land Cover database. Regression coefficients obtained by PLS are given inTable 3. Altitude of sampling sites appeared as
Table 1
Mean, range and standard deviation (SD) of the values measured in mosses Hypnum cupressiforme Hedw. from three European countries: individual and total PAH
concen-trations (ng g!1, dry weight), carbon and nitrogen content (%) and isotope ratios (&). In italic, the total concentration of the 13 PAHs is given and is annotated S
13PAH.
France (n ¼ 18) Spain (n ¼ 23) Switzerland (n ¼ 20)
Mean Range SD Mean Range SD Mean Range SD
ACE 2.5 1.5e4.0 0.7 3.8 1.5e9.9 2.2 3.7 2.0e5.9 1.1
FLR 39.1 26.9e55.0 9.0 46.1 22.1e99.2 24.1 38.5 21.2e63.4 10.6
PHE 29.2 19.8e42.0 6.4 27.5 16.0e46.3 12.4 30.8 16.7e81.4 13.9
ANT 1.3 0.7e2.1 0.4 1.5 0.6e3.5 0.8 1.4 0.5e3.9 0.8
FTN 38.7 19.2e60.2 10.6 23.6 8.1e55.4 19.5 35.6 12.7e116.8 23.8
PYR 66.1 33.2e115.9 23.3 52.9 11.7e135.7 56.2 60.6 17.6e151.3 34.1
B(a)A 13.7 6.1e20.3 3.7 2.9 0.8e7.0 1.7 9.3 1.8e59.7 14.4
CHR 20.0 11.2e30.6 5.5 7.1 3.5e13.4 2.8 14.5 5.2e61.1 13.3
B(b)F 17.2 8.9e25.7 4.8 5.0 1.8e9.7 2.2 14.6 4.8e70.6 18.0
B(k)F 9.1 4.9e13.0 2.3 2.9 1.4e5.0 0.9 7.8 2.6e36.4 8.9
B(a)P 11.2 5.9e17.2 3.3 3.5 1.8e5.5 1.0 9.9 3.3e47.0 11.5
D(ah)A 2.6 1.3e3.8 0.7 1.1 0.5e1.9 0.4 2.4 0.9e10.9 2.8
B(ghi)P 13.3 5.3e33.9 6.6 4.3 1.9e8.0 1.6 12.4 4.1e55.1 14.1
S13PAH 264.0 148.5e359.9 61.0 182.1 99.7e355.7 105.3 241.5 98.1e697.8 139.8
%C 42.7 38.4e44.6 1.8 44.2 41.1e47.3 1.4 45.0 42.8e46.9 1.2
%N 1.6 1.2e2.1 0.2 1.3 0.9e1.9 0.3 1.4 1.1e1.9 0.2
d13C !31.0 [!32.3; !29.9] 0.6 !29.5 [!30.7; !28.7] 0.7 !30.8 [!31.9; !29.4] 0.7
T able 2 Pearson correla tion coef fi cients betw een indi vidual and to tal PAH concentra tions (ng g ! 1, dry weig ht), C, N cont ent (%), d 13C and d 15N (& ) measured in the mosses fr om the 61 Eur opean sites .The coef fi cients in bold ar e signi fi cant. Variables ACE FLR PHE ANT FTN PYR B(a)A CHR B(b)F B(k)F B(a)P D(ah)A B(ghi)P S13 HAP %C %N d 13C d 15N ACE 1 FLR 0.625 **** 1 PHE 0.389 0.532 **** 1 ANT 0.130 0.172 0.723 **** 1 FTN 0.292* 0.341** 0.886 **** 0.650 **** 1 PYR 0.401 ** 0.463 *** 0.730 **** 0.500 **** 0.819 **** 1 B(a)A ! 0.038 0.039 0.579 **** 0.459 *** 0.699 **** 0.204 1 CHR ! 0.041 0.037 0.609 **** 0.465 *** 0.759 **** 0.311* 0.962 **** 1 B(b)F ! 0.062 ! 0.048 0.506 **** 0.439 *** 0.626 **** 0.104 0.968 **** 0.932 **** 1 B(k)F ! 0.051 ! 0.021 0.531 **** 0.435 *** 0.644 **** 0.122 0.973 **** 0.938 **** 0.997 **** 1 B(a)P ! 0.039 ! 0.035 0.528 **** 0.461 *** 0.647 **** 0.123 0.971 **** 0.932 **** 0.996 **** 0.995 **** 1 D(ah)A ! 0.004 ! 0.023 0.518 **** 0.435 *** 0.622 **** 0.109 0.955 **** 0.914 **** 0.984 **** 0.984 **** 0.984 **** 1 B(ghi)P ! 0.004 ! 0.028 0.511 **** 0.479 **** 0.621 **** 0.146 0.914 **** 0.929 **** 0.933 **** 0.927 **** 0.927 **** 0.921 **** 1 S13 PAH 0.336 ** 0.449 *** 0.903 **** 0.644 **** 0.975 **** 0.761 **** 0.759 **** 0.805 **** 0.691 **** 0.708 **** 0.706 **** 0.691 **** 0.695 **** 1 %C 0.135 ! 0.069 ! 0.131 ! 0.013 ! 0.212 ! 0.190 ! 0.228 ! 0.210 ! 0.120 ! 0.141 ! 0.115 ! 0.065 ! 0.102 ! 0.208 1 %N L 0.259 * ! 0.036 ! 0.046 ! 0.064 0.119 ! 0.003 0.264 * 0.283 * 0.262 * 0.253 * 0.237 0.219 0.221 0.134 ! 0.226 1 d 13C 0.150 0.094 ! 0.194 ! 0.078 L 0.352 ** ! 0.168 L 0.388 ** L 0 .431 ** L 0.371 ** L 0.372 ** L 0.390 ** L 0 .302 * L 0.341 ** L 0 .322 * 0.122 ! 0.126 1 d 15N 0.027 0.056 ! 0.031 0.084 ! 0.020 0.014 0.009 ! 0.063 ! 0.078 ! 0.087 ! 0.064 ! 0.075 ! 0.098 ! 0.024 L 0.290* 0.305* 0.087 1 p -Values obtained by Student ’s t test and their degree of “ statistical signi fi cance ” : *p < 0.05, ** p < 0.01, *** p < 0.001, **** p < 0.0001. T able 3 Par tial Least Sq uar e (PL S) regress ion coef fi cients betw een variables measured in mosses and site -speci fi c and regional char act eristics. The coef fi cients in bold ar e signi fi cant. Predictor ACE FLR PHE ANT FT N PYR B(a)A CHR B(b)F B(k)F B(a)P D(ah)A B(ghi)P S13 HAP %C %N d 13 C d 15 N Altitude 0.251 0.319 0.025 0.029 ! 0.236 0.031 L 0.488 L 0.527 L 0.468 L 0.461 L 0.458 L 0.413 L 0.416 ! 0.213 0.304 ! 0.191 0.510 0.014 Annual precipitation 0.070 0.098 ! 0.156 0.170 L 0.324 ! 0.215 L 0.316 L 0.400 L 0.287 L 0.297 L 0.284 L 0.284 ! 0.245 L 0.291 0.278 0.020 0.284 0.149 Agricultural land use (10 km radius) 0.029 ! 0.208 ! 0.224 L 0.295 ! 0.081 ! 0.082 ! 0.110 ! 0.053 ! 0.060 ! 0.054 ! 0.048 ! 0.047 ! 0.012 ! 0.130 0.151 0.036 ! 0.162 L 0.339 Agricultural land use (25 km radius) 0.040 L 0.282 ! 0.172 L 0.250 0.054 0.022 0.006 0.081 0.036 0.044 0.043 0.048 0.069 ! 0.021 0.116 0.102 L 0.293 L 0.288 Agricultural land use (50 km radius) ! 0.137 L 0.275 ! 0.102 ! 0.196 0.202 0.062 0.279 0.376 0.285 0.288 0.279 0.247 0.297 0.156 ! 0.015 0.301 L 0.491 ! 0.239 Forestal land use (10 km radius) 0.032 0.044 0.016 0.199 ! 0.148 ! 0.022 ! 0.207 L 0.261 ! 0.190 ! 0.197 ! 0.209 ! 0.173 ! 0.166 ! 0.128 0.056 ! 0.032 0.338 0.071 Forestal land use (25 km radius) 0.172 0.165 0.136 0.304 ! 0.112 ! 0.007 ! 0.204 L 0.275 ! 0.166 ! 0.174 ! 0.173 ! 0.144 ! 0.115 ! 0.072 0.144 ! 0.167 0.382 0.088 Forestal land use (50 km radius) 0.290 0.153 0.144 0.239 ! 0.097 ! 0.023 ! 0.228 L 0.295 ! 0.159 ! 0.163 ! 0.149 ! 0.127 ! 0.103 ! 0.074 0.358 L 0.318 0.307 0.036 Urban land use (10 km radius) ! 0.215 ! 0.070 0.163 0.033 0.343 0.074 0.512 0.553 0.489 0.495 0.502 0.428 0.393 0.340 ! 0.172 0.232 L 0.563 0.087 Urban land use (25 km radius) L 0.265 ! 0.086 0.088 ! 0.028 0.275 0.062 0.450 0.502 0.429 0.430 0.434 0.373 0.337 0.282 ! 0.201 0.241 L 0.531 0.017 Urban land use (50 km radius) L 0.309 ! 0.146 0.060 ! 0.057 0.290 0.070 0.485 0.527 0.456 0.460 0.452 0.390 0.342 0.286 L 0.322 0.345 L 0.563 ! 0.008 Urban land use (75 km radius) L 0.326 ! 0.192 0.038 ! 0.080 0.300 0.074 0.510 0.557 0.479 0.483 0.467 0.409 0.380 0.293 L 0.366 0.425 L 0.578 ! 0.020 Urban land use (100 km radius) L 0.321 ! 0.206 0.028 ! 0.084 0.298 0.084 0.495 0.553 0.458 0.463 0.447 0.387 0.390 0.287 L 0.369 0.427 L 0.593 ! 0.035 Sources :e Annual precipitation : http://france.meteofrance.com ; http://meteo.navarra.es ; http ://www.meteotest.ch .e Soil occupation data: http://www.eea.europa;eu/publica tions/COR0-landcover .
significantly correlated with light PAH concentrations: ACE (r ¼ 0.251) and FLR (r ¼ 0.319), carbon content (r ¼ 0.304) and
d
13C values (r ¼ 0.510), as well as significantly anti-correlated with heavy PAHs: B(a)A, CHR, B(b)F, B(k)F, D(ah)A and B(ghi)P (r ¼ [!0.527; !0.413]). Annual precipitation was significantly anti-correlated with several individual PAHs: FTN, B(a)A, CHR, B(b)F, B(k)F, B(a)P, D(ah)A (r ¼ [!0.400; !0.284]) and total PAH concen-trations (r ¼ !0.291). Soil occupation by agriculture showed sig-nificant positive correlations with heavy PAH concentrations (r50 km¼ [0.247; 0.376]) and nitrogen content (r50 km¼ 0.301), as well as negative correlations with FLR (r25 km¼ !0.282) and ANT (r10 km¼ !0.295) concentrations,d
13C values (r50 km¼ !0.491) andd
15N values (r10 km ¼ !0.339). Forest land use was significantly correlated with ACE (r50 km¼ 0.290) and ANT (r25 km ¼ 0.304) concentrations, carbon content (r50 km¼ 0.358) andd
13C values (r25 km ¼ 0.382), and significantly anti-correlated with CHR concentrations (r50 km ¼ !0.295) and nitrogen content (r50 km ¼ !0.318). However, the most important correlations appeared between the variables and urban land use, with maximal positive values for urban occupation within a 10 km radius and FTN (r ¼ 0.343), heavy PAHs (r ¼ [0.393; 0.553]) and total PAH (r ¼ 0.340) concentrations, as well as for urban occupation within 100 km radius and nitrogen content (r ¼ 0.427). Maximal negative correlations appeared between urban land use within a 100 km radius and ACE concentrations (r ¼ !0.321), carbon content (r ¼ !0.369) andd
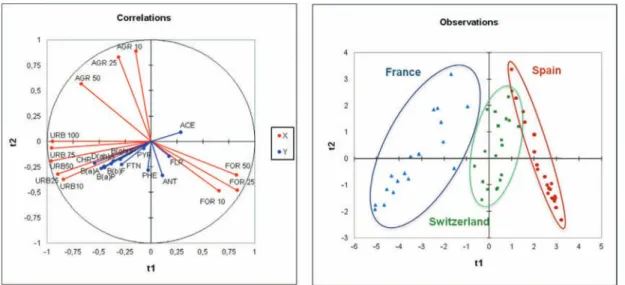
13C values (r ¼ !0.593).The PLS regressions obtained to explain PAH content in mosses with soil occupation data are represented inFig. 3. The correlations circle shows a t1 axis negatively correlated with urban land use at 10e100 km and positively correlated with forestry land use at 10e 50 km, as well as a t2 axis positively correlated with agricultural land use at 10e50 km. Most of the PAH concentrations are explained by the t1 axis: mosses sampled close to urban areas are highly contaminated by high molecular weight PAHs, as those from rural areas are characterized by lighter weight PAHs. The in-dividuals from the different regions are clearly differenciated by the PLS regressions: Île-de-France sites (France) are negatively corre-lated with t1, due to high urbanization of this area; Navarra sites (Spain) are positively correlated with t1, due to the high occupation of the land by forests and low urbanization; Switzerland shows an intermediate position. The individuals from the three areas are
dispersed along the t2 axis, due to highly variable agricultural activity.
3.6. Correlations with additional moss data
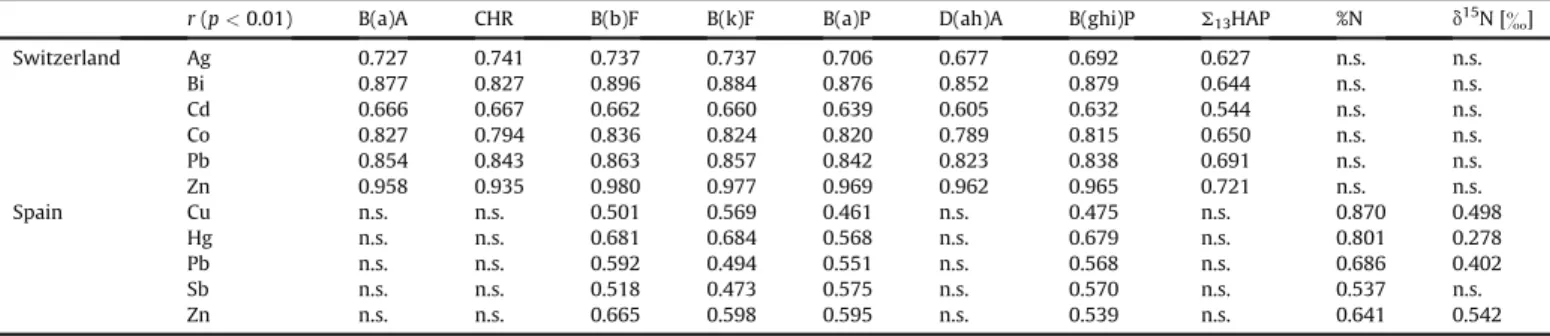
Heavy metal concentrations were determined in Hypnum
cupressiforme samples collected synchronously in Switzerland and
Spain following the method described inGonzalez-Miqueo (2009). A Pearson correlation test revealed for the mosses from Switzerland significant linear correlations (p < 0.01) between heavy PAHs (B(a)A, CHR, B(b)F, B(k)F, B(a)P, D(ah)A and B(ghi)P) and several heavy metals: silver (r > 0.677), bismuth (r > 0.827), cad-mium (r > 0.605), cobalt (r > 0.789), lead (r > 0.823) and zinc (r > 0.935) (Table 4). As a result, total PAH concentrations were significantly correlated with all heavy metal concentrations measured (r > 0.544, p < 0.01), which is particularly interesting as the different elements presented various levels: 0.01e0.07
mg g
!1 for Bi, 0.1e0.7mg g
!1 for Co, 2.0e6.5mg g
!1 for Pb and 17e 170mg g
!1 for Zn. In Navarra, significant linear correlations (p < 0.01) were also measured between concentrations of several heavy metals and heavy weight PAHs (Table 4):- Cu (2.3e7.7
mg g
!1) with B(b)F and B(k)F (r > 0.501),- Hg (0.02e0.07
mg g
!1) with B(b)F, B(k)F, B(a)P and B(ghi)P (r > 0.568),- Pb (1.0e10.3
mg g
!1) with B(b)F, B(k)F, B(a)P and B(ghi)P (r > 0.494),- Sb (0.04e0.12
mg g
!1) with B(b)F, B(a)P and B(ghi)P (r > 0.518), - Zn (13e38mg g
!1) with B(b)F, B(k)F, B(a)P and B(ghi)P(r > 0.539).
Nitrogen content showed significant linear correlations with the heavy metals concentrations (r > 0.54; p < 0.01). Common trends were also observed between metals and
d
15N values, with a maximum correlation for Zn (r ¼ 0.54; p < 0.01).4. Discussion
Several European studies revealed the same range of total PAH concentrations in mosses Hypnum cupressiforme Hedw. Indeed, values of 107e640 ng g!1were measured in Wienerwald Nature
Fig. 3. Graphical representation of the PLS regressions of PAH content in mosses in function of soil occupation data for 61 European sampling sites. The individuals are the European sites presented in the “Observations” graphic. On the correlations circle, the quantitative variables (Y) are individual PAH concentrations and explicative variables (X) are soil
Reserve (Austria) for the 13 studied PAHs (Krommer et al., 2007) and mosses from Kosetice observatory (Czech Republic) showed concentrations ranging from 47 to 112 ng g!1 for the 16 PAHs classified as priority pollutants by USEPA (Holoubek et al., 2007b). Moreover, total concentrations measured in Navarra (Spain) are of the same order as previous studies carried out in that area, which revealed values of approximately 130 ng g!1(Foan et al., 2010; Foan
and Simon, 2012).
Previous studies also showed the same major compounds: FLR, PHE, FTN, PYR. Their concentrations were significantly correlated (r > 0.50, p < 0.0001), due most importantly to their emission from petrol and diesel vehicles in urban and traffic areas (Ho et al., 2002; Omar et al., 2002; Orlinski, 2002; Ravindra et al., 2006). No com-mon trends between the major compounds and soil occupation was identified, as rural sites can be occupied by high traffic density. It is notably the case of Navarra region, which is crossed by main roads connecting Spain to France and is only occupied by 1% of urban land (Fig. 4). Correlations between PAHs and heavy metals Cu, Hg, Pb, Sb and Zn in this region (r > 0.46; p < 0.01) are related to their common emission by road traffic (Pearson et al., 2000; Zechmeister et al., 2006).
The high molecular weight PAHs (B(a)A, CHR, B(b)F, B(k)F, B(a)P, B(ghi)P) concentrations were very significantly correlated (r > 0.91,
p < 0.0001) and were significantly correlated with the percentage
of urban land use at 10 km around the sampling sites (r ¼ [0.40; 0.55], p < 0.05). Local soil occupation (within a 10 km radius) shows the highest correlations with PAH data, probably due to the fact that PAH concentrations in mosses follow an exponential decrease in the vicinity of contamination sources (Ares et al., 2009). Syn-chronous emission of these compounds by industries located in
urban areas may explain these trends (Ares et al., 2009, 2011). This is probable as strong correlations with the heavy metals Ag, Bi, Cd, Co, Pb and Zn emitted by industrial activity were observed in Switzerland (r > 0.66, p < 0.01). Heavy PAH concentrations were therefore relatively higher in Île-de-France and Switzerland, due to the high percentage of industrialized urban areas in these two re-gions (Fig. 4). Mosses from high altitudes were depleted in heavy PAHs, certainly due to fractionation of the compounds by particle sedimentation and PAH condensation under lower vapour pres-sures (Liu et al., 2005). Heavy PAH concentrations also tended to decrease with high precipitation levels. This fact may be related with particle leaching by wet deposition (Kinnersley et al., 1996; Couto et al., 2004).
Elemental and isotopic analysis also revealed similar values to previous studies. Indeed, in mosses Hypnum cupressiforme Hedw. from Navarra (Spain), carbon content ranged from 30.9% to 43.9%, nitrogen content from 0.8% to 1.5%,
d
13C values from !30.5& to !28.5& andd
15N from !6.0& to !4.0& (Foan et al., 2010). Mosses Haplocladium microphyllum (Hedw.) Broth. sampled be-tween 2005 and 2007 in China showed carbon content ranging from 37.8% to 45.7% in a mountainous and urban area respectively, andd
13C values ranged from !30.2& in the urban area to !26.5& in the mountains (Liu et al., 2008, 2010). Analysis of mossesPleu-rozium scheberi (Brid.) Mitt. and Scleropodium purum (Hedw.) from
8 rural sites in Germany showed nitrogen content of 0.7e2.3% and
d
15N values from !7.9& to !2.9& (Solga et al., 2005). Active bio-monitoring in Italy with Tortula muralis Hedw. revealed values ford
15N of !6& to 2& at urban areas (industrial, residential and city centers), against !7& to !2& at rural sites located at more than 10 km from stationary emission sources and more than 1 km fromTable 4
Significant Pearson correlations between heavy metal concentrations measured in mosses from Switzerland (n ¼ 20) and Spain (n ¼ 23) and individual PAH, total PAH (S13HAP)
concentrations, nitrogen content andd15N values.
r (p < 0.01) B(a)A CHR B(b)F B(k)F B(a)P D(ah)A B(ghi)P S13HAP %N d15N [&]
Switzerland Ag 0.727 0.741 0.737 0.737 0.706 0.677 0.692 0.627 n.s. n.s. Bi 0.877 0.827 0.896 0.884 0.876 0.852 0.879 0.644 n.s. n.s. Cd 0.666 0.667 0.662 0.660 0.639 0.605 0.632 0.544 n.s. n.s. Co 0.827 0.794 0.836 0.824 0.820 0.789 0.815 0.650 n.s. n.s. Pb 0.854 0.843 0.863 0.857 0.842 0.823 0.838 0.691 n.s. n.s. Zn 0.958 0.935 0.980 0.977 0.969 0.962 0.965 0.721 n.s. n.s. Spain Cu n.s. n.s. 0.501 0.569 0.461 n.s. 0.475 n.s. 0.870 0.498 Hg n.s. n.s. 0.681 0.684 0.568 n.s. 0.679 n.s. 0.801 0.278 Pb n.s. n.s. 0.592 0.494 0.551 n.s. 0.568 n.s. 0.686 0.402 Sb n.s. n.s. 0.518 0.473 0.575 n.s. 0.570 n.s. 0.537 n.s. Zn n.s. n.s. 0.665 0.598 0.595 n.s. 0.539 n.s. 0.641 0.542 n.s.: non-significant.
roads (Gerdol et al., 2002b). A study carried out in Chinese cities with mosses Haplocladium microphyllum showed values of !8 to 4& (Xiao et al., 2010).
Liu et al. (2010)observed over an urban to rural transect that moss carbon content was significantly correlated with nitrogen content and significantly anti-correlated with
d
13C values. Urbanized sites were characterized by higher C and N contents and lowd
13C values (strongly negative). This study did not reveal any significant linear correlation between C, N contents andd
13C values, probably because of the wide geographical extent and the various emission sources. However,d
13C values were significantly anti-correlated with the percentage of urban land use (r ¼ [!0.531; !0.593],p < 0.01), showing a clear depletion of13C in mosses from urbanized
areas. The significantly higher
d
13C values measured in Navarra (Spain) may therefore be explained by the low urbanization of the area (Fig. 4). The inversed trends betweend
13C and PAHs are prob-ably related with the emission of both CO2and PAHs during com-bustion of fossil fuels and biomass. The fact that mosses collected at high altitude sites were enriched in13C is difficult to interpret, as isotope fractionation is influenced by the composition of source CO2 as well as physiological factors (Körner et al., 1991).Solga et al. (2005)showed a significant positive linear correla-tion between nitrogen concentracorrela-tions in mosses and in bulk deposition, and a significant negative linear correlation between
d
15N values in mosses and NH4þ! N/NO3!! N concentration ra-tios in bulk deposition.Xiao et al. (2010)also observed a significant negative linear correlation betweend
15N and NH4þconcentrations in bulk deposition. It emerges that urbanized areas, characterized by high emissions of NOxoriginating from road traffic, show highd
15N levels in mosses (close to 0), whereas rural areas, character-ized by NH3 emissions from agriculture, show lowd
15N values (strongly negative). In this study, thed
15N levels measured are characteristic of rural sites, probably due to their remoteness from emission sources. N content andd
15N values are barely correlated, probably because N content is function of the total atmospheric nitrogen deposition, asd
15N is influenced by various emission sources. Significant linear correlations were observed in Navarra between N content,d
15N values and several heavy metals, probably due to the intensive road traffic emissions in that area.d
15N was negatively correlated with the percentage of agricultural land use at a 10 km radius (r ¼ !0.339, p < 0.01). Indeed, farm and agricultural activities induce the liberation of ammonia (gas), which is poorly enriched in15N. The mosses collected in areas close to farmland may have absorbed NH3and are therefore depleted in15N. Lowerd
15N values in Switzerland than the other areas may therefore be explained by the intensive agricultural activity over the Swiss Plateau. Indeed, at a 10 km radius around the sampling sites, farmland occupies 52% of the soil (Fig. 4).Liu et al. (2010)showed that high carbon content in urban areas can be related with the fertilizing effect of N deposition. This relation may explain the low anti-correlation between C content andd
15N values in mosses (r ¼ !0.290, p < 0.01). Finally, the common trends between N content and heavy PAH concentrations may be explained by their important deposition in urban areas (industry, road and domestic emissions.). Nevertheless, it should be noted that the forest can-opy may also have contributed to the N content andd
15N values in the European mosses, by enriching throughfall deposition in organic nitrogen (Cape et al., 2010; Drápelová, 2012).5. Conclusions
Total PAH concentrations measured in mosses Hypnum
cupres-siforme Hedw. from three European regions ranged from 100 to
700 ng g!1. Samples collected in Navarra, a rural area of Spain, were significantly less contaminated by PAHs than those from
Île-de-France (Paris metropolitan area) and the Swiss sampling points, especially those of the Basel region. The major compounds FLR, PHE, FTN and PYR were significantly correlated (r ¼ [0.34; 0.89], p < 0.01). Their distribution was not explained by soil occupation data (per-centage of farmland, forests and urban areas), as they are emitted mainly by road traffic. In further studies, predictions may be improved by introducing traffic density data in the PLS regressions. Heavy PAH concentrations (B(a)A, CHR, B(b)F, B(k)F, B(a)P, B(ghi)P) were very significantly correlated (r > 0.91; p < 0.0001). Their dis-tribution was partially explained by local urbanization in a 10 km radius (r ¼ [0.40; 0.55], p < 0.05). Spanish samples were therefore characterized by relatively low percentages of heavy PAHs due to low urbanization in this area (1%). Environmental parameters such as elevation and precipitation appeared as anti-correlated with heavy PAH content (respectively r ¼ [!0.53; !0.43] and
r ¼ [!0.40; !0.28], p < 0.05). The trends observed in Navarra may
therefore also be attributed to the relief and heavy rainfall of the area. Specific correlations with heavy metal concentrations confirmed that the main PAH emission sources were industrial ac-tivity in Switzerland and road traffic in Navarra.
d
13C values, which ranged from !32& to !29&, were signifi-cantly anti-correlated with local urbanization in a 10 km radius (r ¼ !0.53; p < 0.05). This may be attributed to13C depletion in anthropogenic emissions.d
13C values were also correlated with altitude (r ¼ 0.51; p < 0.05). Significantly higherd
13C values measured in mosses from Navarra (!29& against !31& in the two other areas) can therefore be explained by the low urbanization and relief of this area. Heavy PAHs andd
13C followed opposite trends (r ¼ [!0.30; !0.43]; p < 0.05).d
15N values, which ranged from !11& to !3&, were anti-correlated with land occupation by farming in a 10 km radius (r ¼ !0.34, p < 0.01), due to N emission under the reduced form depleted in15N. The very low minimum value measured in mosses from the Swiss Plateau (!11&) can therefore be attributed to the high percentage of farmland in this area (52%). However, no clear trends were observed in the three regions asd
15N is also influenced by NOxemissions in urban andtraffic areas, as well as canopy leaching on the sampling sites. Interpretation of isotope signatures in mosses is difficult. Future studies will have to include the analysis of source N and C composition for further exploitation of bioindication results. Moreover, for complementary information to identify contamina-tion sources, sulphur isotope signatures (34S/32S) should be measured. Several participants of ICP-Vegetation have recently started measuring them in mosses across Europe.
Acknowledgements
Sampling was funded in France by the Agence de l’Environne-ment et de la Maîtrise de l’Energie (ADEME), in Spain by the Foundation of the University of Navarra (FUNA) and CAN Founda-tion, and in Switzerland by the Federal Office for the Environment (FOEN). The analytical work at the LCA (Toulouse, France) was supported by the Communauté de Travail des Pyrénées/Commu-nidad de Trabajo de los Pirineos (CTP).
We thank Sheila Izquieta, Esther Lasheras, David Elustondo and Niklaus Müller for the moss sampling, Véronique Vaury for per-forming the isotopic analysis, Roland Pesch and Beat Rihm for providing metadata, and Harry Harmens for supporting this collaborative work during the ICP-Vegetation Task Force Meetings. References
Ares, A., Aboal, J.R., Fernández, J.A., Real, C., Carballeira, A., 2009. Use of the terrestrial moss Pseudoscleropodium purum to detect sources of small scale contamination by PAHs. Atmos. Environ. 43 (34), 5501e5509.
Ares, Á., Ángel Fernández, J., Ramón Aboal, J., Carballeira, A., 2011. Study of the air quality in industrial areas of Santa Cruz de Tenerife (Spain) by active bio-monitoring with Pseudoscleropodium purum. Ecotoxicol. Environ. Saf. 74 (3), 533e541.
Ayres, E., van der Wal, R., Sommerkorn, M., Bardgett, R.D., 2006. Direct uptake of soil nitrogen by mosses. Biol. Lett. 2 (2), 286e288.
Blasco, M., Domeno, C., Lopez, P., Nerin, C., 2011. Behaviour of different lichen species as biomonitors of air pollution by PAHs in natural ecosystems. J. Environ. Monit. 13 (9), 2588e2596.
Cape, J.N., Sheppard, L.J., Crossley, A., van Dijk, N., Tang, Y.S., 2010. Experimental field estimation of organic nitrogen formation in tree canopies. Environ. Pollut. 158, 2926e2933.
Carlberg, G.E., Ofstad, E.B., Drangsholt, H., Steinnes, E., 1983. Atmospheric deposi-tion of organic micropollutants in Norway studied by means of moss and lichen analysis. Chemosphere 12 (3), 341e356.
Cipro, C.V.Z., Yogui, G.T., Bustamante, P., Taniguchi, S., Sericano, J.L., Montone, R.C., 2011. Organic pollutants and their correlation with stable isotopes in vegetation from King George Island, Antarctica. Chemosphere 85 (3), 393e398.
Couto, J.A., Fernández, J.A., Aboal, J.R., Carballeira, A., 2004. Active biomonitoring of element uptake with terrestrial mosses: a comparison of bulk and dry depo-sition. Sci. Total Environ. 324 (1e3), 211e222.
Drápelová, I., 2012. Organic and inorganic nitrogen in precipitation and in forest throughfall at the Bílý K"rí"z site (Beskydy Mts., Czech Republic). J. For. Sci. 58, 88e100.
Foan, L., Sablayrolles, C., Elustondo, D., Lasheras, E., González, L., Ederra, A., Simon, V., Santamaría, J.M., 2010. Reconstructing historical trends of polycyclic aromatic hydrocarbon deposition in a remote area of Spain using herbarium moss material. Atmos. Environ. 44 (26), 3207e3214.
Foan, L., Simon, V., 2012. Optimization of pressurized liquid extraction using a multivariate chemometric approach and comparison of solid-phase extraction cleanup steps for the determination of polycyclic aromatic hydrocarbons in mosses. J. Chromatogr. A 1256, 22e31.
Garrec, J.P., Van Haluwyn, C., 2002. Biosurveillance végétale de la qualité de l’air e Concepts, méthodes et applications (Air Quality Biomonitoring with Plantse Concepts, Methods and Applications). Lavoisier, Paris, p. 117.
Gerdol, R., Bragazza, L., Marchesini, R., 2002a. Element concentrations in the forest moss Hylocomium splendens: variation associated with altitude, net primary production and soil chemistry. Environ. Pollut. 116 (1), 129e135.
Gerdol, R., Bragazza, L., Marchesini, R., Medici, A., Pedrini, P., Benedetti, S., Bovolenta, A., Coppi, S., 2002b. Use of moss (Tortula muralis Hedw.) for moni-toring organic and inorganic air pollution in urban and rural sites in Northern Italy. Atmos. Environ. 36 (25), 4069e4075.
Glime, J.M., 2007. Bryophyte Ecology. In: Physiocological Ecology, vol. 1. Ebook Sponsored by Michigan Technological University and the International
Associa-tion of Bryologists<http://www.bryoecol.mtu.edu/chapters/8-1NutrientRequire.
pdf>(19/07/2013).
GN, 2011. Meteorología y climatología de Navarra (Meteorology and climatology of Navarra). Departamento de Desarrollo Rural, Industria, Empleo y Medio
Ambientee Gobierno de Navarra.http://meteo.navarra.es/estaciones/estacion.
cfm?IDEstacion¼87(28/12/2012).
Gonzalez-Miqueo, L., 2009. Biomonitorización de contaminantes atmosféricos mediante la utilización de Hypnum cupressiforme Hedw. en la Comunidad Foral de Navarra y zonas limítrofes (Biomonitoring atmospheric contaminants with Hypnum cupressiforme Hedw.in Navarra region and surrounding areas) (PhD thesis). University of Navarra, Pamplona, Spain, p. 250.
Gustafsson, Ö., Andersson, P., Axelman, J., Bucheli, T.D., Kömp, P., McLachlan, M.S., Sobek, A., Thörngren, J.O., 2005. Observations of the PCB distribution within and in between ice, snow, ice-rafted debris, ice-interstitial water, and seawater in the Barents Sea marginal ice zone and the North Pole area. Sci. Total Environ. 342 (1e3), 261e279.
Harmens, H., Norris, D.A., Steinnes, E., Kubin, E., Piispanen, J., Alber, R., Aleksiayenak, Y., Blum, O., Coskun, M., Dam, M., De Temmerman, L., Fernández, J.A., Frolova, M., Frontasyeva, M., González-Miqueo, L., Grodzinska, K., Jeran, Z., Korzekwa, S., Krmar, M., Kvietkus, K., Leblond, S., Liiv, S., Magnússon, S.H., Mankovská, B., Pesch, R., Rühling, Å., Santamaria, J.M., Schröder, W., Spiric, Z., Suchara, I., Thöni, L., Urumov, V., Yurukova, L., Zechmeister, H.G., 2010. Mosses as biomonitors of atmospheric heavy metal deposition: spatial patterns and temporal trends in Europe. Environ. Pollut. 158 (10), 3144e3156.
Harmens, H., Mills, G., Hayes, H., Norris, D., 2011a. Air Pollution and Vegetatione
ICP Vegetation Annual Report 2010/2011. United Nations Economic Commission for Europe, Convention on Long-range Transboundary Air Pollution, Interna-tional Cooperative Programme on Effects of Air Pollution on Natural Vegetation
and Crops (ICP Vegetation), p. 50.http://icpvegetation.ceh.ac.uk/publications/
documents/ICPVegetationannualreport2010-11.pdf(28/12/2012).
Harmens, H., Norris, D.A., Cooper, D.M., Mills, G., Steinnes, E., Kubin, E., Thöni, L., Aboal, J.R., Alber, R., Carballeira, A., Coskun, M., De Temmerman, L., Frolova, M., Gonzalez-Miqueo, L., Jeran, Z., Leblond, S., Liiv, S., Mankovska, B., Pesch, R., Poikolainen, J., Rühling, A., Santamaria, J.M., Simonèiè, P., Schröder, W., Suchara, I., Yurukova, L., Zechmeister, H.G., 2011b. Nitrogen concentrations in mosses indicate the spatial distribution of atmospheric nitrogen deposition in Europe. Environ. Pollut. 159 (10), 2852e2860.
Harmens, H., Ilyin, I., Mills, G., Aboal, J.R., Alber, R., Blum, O., Coskun, M., De Temmerman, L., Fernandez, J.A., Figueira, R., Frontasyeva, M., Godzik, B., Goltsova, N., Jeran, Z., Korzekwa, S., Kubin, E., Kvietkus, K., Leblond, S., Liiv, S.,
Magnüsson, S.H., Mankovska, B., Nikodemus, O., Pesch, R., Poikolainen, J., Radnovic, D., Rühling, A., Santamaria, J.M., Schröder, W., Spiric, Z., Stafilov, T., Steinnes, E., Suchara, I., Tabors, G., Thoni, L., Turcsanyi, G., Yurukova, L., Zechmeister, H.G., 2012. Country-specific correlations across Europe between modelled atmospheric cadmium and lead deposition and concentrations in mosses. Environ. Pollut. 166 (0), 1e9.
Harmens, H., Foan, L., Simon, V., Mills, G., 2013. Terrestrial mosses as biomonitors of atmospheric POPs pollution: a review. Environ. Pollut. 173, 245e254. Ho, K.F., Lee, S.C., Chiu, G.M.Y., 2002. Characterization of selected volatile organic
compounds, polycyclic aromatic hydrocarbons and carbonyl compounds at a roadside monitoring station. Atmos. Environ. 36 (1), 57e65.
Holoubek, I., Klanova, J., Jarkovsky, J., Kohoutek, J., 2007a. Trends in background levels of persistent organic pollutants at Kosetice observatory, Czech Republic. Part I. Ambient air and wet deposition 1996e2005. J. Environ. Monitor. 9 (6), 557e563.
Holoubek, I., Klanova, J., Jarkovsky, J., Kubik, V., Helesic, J., 2007b. Trends in back-ground levels of persistent organic pollutants at Kosetice observatory, Czech Republic. Part II. Aquatic and terrestrial environments 1996e2005. J. Environ. Monitor. 9 (6), 564e571.
IARC, 2010. IARC Monographs on the Evaluation of Carcinogenic Risks to Humans. In: Some Non-heterocyclic Polycyclic Aromatic Hydrocarbons and Some Related Exposures, vol. 92. International Agency on Research on Cancer, Lyon,
France, p. 868.http://monographs.iarc.fr/ENG/Monographs/vol92/mono92.pdf
(9/06/13).
ICP-Vegetation, 2010. Heavy Metals in European Mosses: 2010 Survey. Monitoring Manual. ICP Vegetation Programme Coordination Centre, CEH, Bangor, UK, p. 16.
http://icpvegetation.ceh.ac.uk/manuals/documents/
UNECEHEAVYMETALSMOSSMANUAL2010POPsadaptedfinal_220510_.pdf (28/ 12/2012).
IEN, 2011. Población por nacionalidad y sexo. Datos del Padrón definitivo a 01/01/
2011. Instituto de Estadística de Navarra (IEN). http://www.cfnavarra.es/
estadistica/confindex.asp?i¼Informaci%F3n%2BEstad%EDstica&p¼ie/indice2. asp?qry¼01&d¼ie/idx_izq.asp?qry¼01&b¼Informaci%F3n(28/12/12). INSEE, 2009. Recensement de la population 2009. Institut National de la Statistique
et des Etudes Economiques, Paris.
http://www.insee.fr/fr/ppp/bases-de-donnees/recensement/populations-legales/default.asp?annee¼2009 (28/12/ 2012).
Jones, K.C., de Voogt, P., 1999. Persistent organic pollutants (POPs): state of the science. Environ. Pollut. 100 (1e3), 209e221.
Kinnersley, R.P., Shaw, G., Bell, J.N.B., Minski, M.J., Goddard, A.J.H., 1996. Loss of particulate contaminants from plant canopies under wet and dry conditions. Environ. Pollut. 91, 227e235.
Körner, C., Farquhar, G.D., Roksandic, Z., 1991. Carbon isotope discrimination by plants follows latitudinal and altitudinal trends. Oecologia 88, 30e40. Krommer, V., Zechmeister, H.G., Roder, I., Scharf, S., Hanus-Illnar, A., 2007.
Moni-toring atmospheric pollutants in the biosphere reserve Wienerwald by a combined approach of biomonitoring methods and technical measurements. Chemosphere 67 (10), 1956e1966.
Liu, X.-Y., Xiao, H.-Y., Liu, C.-Q., Li, Y.-Y., Xiao, H.-W., 2008. Stable carbon and nitrogen isotopes of the moss Haplocladium microphyllum in an urban and a background area (SW China): the role of environmental conditions and atmospheric nitrogen deposition. Atmos. Environ. 42 (21), 5413e 5423.
Liu, X.-Y., Xiao, H.-Y., Liu, C.-Q., Li, Y.-Y., Xiao, H.-W., Wang, Y.-L., 2010. Response of stable carbon isotope in epilithic mosses to atmospheric nitrogen deposition. Environ. Pollut. 158 (6), 2273e2281.
Liu, X., Zhang, G., Jones, K.C., Lic, X., Penga, X., Qid, S., 2005. Compositional frac-tionation of polycyclic aromatic hydrocarbons (PAHs) in mosses (Hypnum plu-maeformae WILS.) from the northern slope of Nanling Mountains, South China. Atmos. Environ. 39, 5490e5499.
Mariotti, A., 1983. Atmospheric nitrogen as a reliable standard for natural N-15 abundance measurements. Nature 303, 685e687.
Mariotti, A., 1984. Natural15N abundance measurements and atmospheric nitrogen
standard calibration. Nature 311, 251e252.
Market, B.A., Breure, A.M., Zechmeister, H.G. (Eds.), 2003. Bioindicators/Biomonitors (Principes, Assessment, Concepts). Elsevier, Amsterdam, p. 997.
MeteoFrance, 2011. Average Annual Precipitations in Île-de-France in 2010.http://
france.meteofrance.com(28/12/2012).
Meteotest, 2008. Average Annual Precipitations in Switzerland Between 2003 and
2007.http://meteotest.ch(28/12/2012).
OFS, 2011. La population de la Suisse 2010. Office fédéral de la statistique,
Neu-châtel. http://www.bfs.admin.ch/bfs/portal/fr/index/themen/01/22/publ.html?
publicationID¼4525(28/12/2012).
Omar, N.Y.M.J., Abas, M.R.B., Ketuly, K.A., Tahir, N.M., 2002. Concentrations of PAHs in atmospheric particles (PM-10) and roadside soil particles collected in Kuala Lumpur, Malaysia. Atmos. Environ. 36 (2), 247e254.
Orlinski, R., 2002. Multipoint moss passive samplers assessment of urban airborne polycyclic aromatic hydrocarbons: concentrations profile and distribution along Warsaw main streets. Chemosphere 48 (2), 181e186.
Pearson, J., Wells, D.M., Seller, K.J., Bennett, A., Soares, A., Woodall, J., Ingrouille, M.J., 2000. Traffic exposure increases natural15N and heavy metal concentrations in
mosses. New Phytol. 147 (2), 317e326.
Ratola, N., Amigo, J.M., Alves, A., 2010. Comprehensive assessment of pine needles as bioindicators of PAHs using multivariate analysis. The importance of tem-poral trends. Chemosphere 81 (11), 1517e1525.
Ravindra, K., Bencs, L., Wauters, E., de Hoog, J., Deutsch, F., Roekens, E., Bleux, N., Berghmans, P., Van Grieken, R., 2006. Seasonal and site-specific variation in vapour and aerosol phase PAHs over Flanders (Belgium) and their relation with anthropogenic activities. Atmos. Environ. 40 (4), 771e785.
Rühling, Å., Tyler, G., 1969. Ecology of heavy metalse a regional and historical study. Bot. Notiser 122, 248e259.
Sawidis, T., Tsikritzis, L., Tsigaridas, K., 2009. Cesium-137 monitoring using mosses from W. Macedonia, N. Greece. J. Environ. Manage. 90 (8), 2620e2627. Schofield, W.B., 1981. Ecological significance of morphological characters in moss
gametophyte. Bryologist 84, 149e165.
Simonich, S.L., Hites, R.A., 1995. Organic pollutant accumulation in vegetation. En-viron. Sci. Technol. 29 (12), 2905e2914.
Solga, A., Burkhardt, J., Zechmeister, H.G., Frahm, J.P., 2005. Nitrogen content,15N
natural abundance and biomass of the two pleurocarpous mosses Pleurozium schreberi (Brid.) Mitt. and Scleropodium purum (Hedw.) Limpr. in relation to atmospheric nitrogen deposition. Environ. Pollut. 134 (3), 465e473. Sumerling, T.J., 1984. The use of mosses as indicators of airborne radionuclides near
a major nuclear installation. Sci. Total Environ. 35 (3), 251e265.
Tcherkez, G., 2010. Isotopie biologiquee Introduction aux effets isotopiques et à leurs applications en biologie. Lavoisier, Paris, p. 237.
Tyler, G., 1990. Bryophytes and heavy metals: a literature review. Bot. J. Linnean Soc. 104 (1e3), 231e253.
UNECE, 1998. Protocol on Persistent Organic Pollutants. Long-Range Transboundary Air Pollution Convention. United Nations Economic Commission for Europe,
Aarhus, Denmark.http://www.unece.org/fileadmin/DAM/env/lrtap/full%20text/
1998.Pops.f.pdf(28/12/12).
Wegener, J.W.M., van Schaik, M.J.M., Aiking, H., 1992. Active biomonitoring of poly-cyclic aromatic hydrocarbons by means of mosses. Environ. Pollut. 76 (1), 15e18. Xiao, H.-Y., Tang, C.-G., Xiao, H.-W., Wang, Y.-L., Liu, X.-Y., Liu, C.-Q., 2010. Tissue S/N ratios and stable isotopes (d34S andd15N) of epilithic mosses (Haplocladium microphyllum) for showing air pollution in urban cities in Southern China. Environ. Pollut. 158 (5), 1726e1732.
Zechmeister, H., Dullinger, S., Hohenwallner, D., Riss, A., Hanus-Illnar, A., Scharf, S., 2006. Pilot study on road traffic emissions (PAHs, heavy metals) measured by using mosses in a tunnel experiment in Vienna, Austria. Environ. Sci. Pollut. Res. 13 (6), 398e405.