"Sensor-in-Fibre" Optical Probes for Molecular Sensing
in the Gastrointestinal Tract of Murine Models
Mémoire
Victor Azzi
Maîtrise en biophotonique - avec mémoire
Maître ès sciences (M. Sc.)
"Sensor-in-Fibre" Optical Probes for Molecular
Sensing in the Gastrointestinal Tract of Murine
Models
Mémoire
Victor Azzi
Sous la direction de:
Denis Boudreau, directeur de recherche André Marette, codirecteur de recherche
Résumé
L’obésité et les maladies cardiométaboliques sont des problèmes de santé publique dans les populations nordiques du Canada ainsi qu’à travers le monde. Il est actuellement proposé que l’augmentation de ces désordres est en partie causée par divers facteurs environnemen-taux qui génèrent des changements importants du microbiote intestinal. Cette communauté microbienne qui peuple notre tractus gastrointestinal joue un rôle clé dans le métabolisme de nutriments, mais peut aussi avoir des effets néfastes lorsque son équilibre avec l’hôte est perturbé. Cette compréhension a mis en évidence le manque d’outils prédictifs permettant un diagnostic rapide et efficace dans le domaine biomédical. L’analyse actuelle du microbiote est réalisée à posteriori au niveau des selles, ce qui requiert du personnel hautement qualifié de même que des procédures longues et dispendieuses.
L’objectif de ce projet est de concevoir un capteur optique qui, une fois implanté dans l’intestin, permettra de détecter en temps réel des biomarqueurs clés produit par le microbiome intestinal. Dans le cadre d’une preuve de concept, une architecture fibrée simple permettant de mesurer quantitativement des variations de pH est démontrée. Contrairement aux cap-teurs fibrés traditionnels, la sonde optique de ce projet exploite l’onde évanescente générée sur la périphérie de l’interface pour exciter des nanomatériaux greffés dont les propriétés de fluorescence varient selon leur environnement chimique. Les mesures sont possibles grâce à un système optique mobile contrôlé par un logiciel convivial qui permet à un utilisateur non-expert d’utiliser l’appareil. Les résultats confirment qu’avec un étalonnage préalable il est possible avec cette sonde modèle de prendre des mesures quantitatives du pH en temps réel
in vitro. Les expériences préliminaires suggèrent que la sonde permet aussi de mesurer le pH
Abstract
Obesity and cardiometabolic diseases (CMD) are major public health issues among Canada’s northern population and throughout the world. It is believed that the exponential rise in CMD incidence is due to numerous environmental factors, which are driving important changes in the gut microbiome. This microbial community which populates our intestinal tract plays a key role in nutrient and energy metabolism, but can also drive pathogenic mechanisms when its interaction with the host is disrupted. This understanding has highlighted the lack of predictive tools and biomarkers for rapid and efficient diagnostic of various diseases within the medical field. Current analysis of the gut microbiota is mostly based on sequencing tech-nologies to determine microbial composition and gene expression, while functional analyses are limited to surrogate markers of microbial activities through stool metabolites.
The goal of this study is to develop a “Sensor-in-Fibre” probe with the capacity to detect key microbiome-derived molecules relevant to CMD pathogenesis in real time in vivo. The optical probe takes advantage of evanescent fields generated on its peripheral interface to excite species-selective surface-grafted sensing nanomaterials that have varying fluorescent properties based on the target molecules present in the surrounding environment. As a model system, FITC functionalized with (3-aminopropyl)triethoxysilane was grafted on the periph-ery of an optical fiber, leading to qualitative pH measurements revealed through fluorescence emission qualities. These measurements are possible due to the use of a mobile signal collec-tion apparatus in conjunccollec-tion with custom software made to enable a non-expert technician to use it. The experimental results demonstrate that, with the appropriate preparation, it is possible to quantitatively measure pH with this probe structure in vitro and preliminary studies suggest that the probe is also capable of measuring pH in vivo in real time.
Contents
Résumé ii
Abstract iii
Contents iv
List of Tables vii
List of Figures viii
Acknowledgements xiii Introduction 1 Research Context . . . 1 Project Objectives . . . 2 Main Objective . . . 2 Specific Objective . . . 4 Proposed Concept . . . 4 1 Theory 6 1.1 Gut Microbiota . . . 6
1.1.1 Composition & Modulation . . . 6
1.1.2 Role in Diseases . . . 7
1.1.3 Current Analytical Methods . . . 7
1.2 Optical Fibers . . . 8
1.2.1 Traditional Optical Transmission . . . 8
1.2.2 Evanescent Wave . . . 10
1.3 Fluorescence . . . 11
1.3.1 Mechanism . . . 11
1.3.2 Absorption Cross-section . . . 12
1.3.3 Quantum Yield & Fluorescence Lifetime . . . 13
1.3.4 Fluorophore Stability . . . 14
1.3.5 Ratiometric Measurement Capacity . . . 15
1.4 Plasmonic Nanomaterials . . . 15
1.4.1 Metal Enhanced Fluorescence (MEF) . . . 16
1.5 Raman Spectroscopy . . . 17
2.1 Characterisation Techniques . . . 19
2.1.1 Epifluorescence Microscopy . . . 19
2.1.2 Spectrometry . . . 20
2.1.3 UV-Visible Spectroscopy . . . 21
2.1.4 pH Measurement . . . 21
2.1.5 Transmission Electron Microscopy (TEM) . . . 21
2.1.6 Scanning Electron Microscopy (SEM) . . . 22
2.2 Synthesis Methods . . . 22
2.2.1 Fluorescein Isothiocyanate (3-Aminopropyl)triethoxysilane Conjugate 22 2.2.2 Silver Nanoparticles with FITC-doped Silica Shell . . . 23
2.2.3 Phosphate Buffer Solutions . . . 24
2.2.4 Feces Solutions . . . 24
2.3 Contributions . . . 25
3 Development of a pH-dependent optical probe for in vivo measurements 26 3.1 FITC-APS Conjugate Grafting to DoubleD Fiber . . . . 26
3.1.1 DoubleD Fiber . . . . 26
3.1.2 FITC-APS Grafting . . . 27
3.1.3 Characterisation . . . 28
3.2 Elongation of Optical Probe . . . 29
3.2.1 Large-core Multimodal Fiber . . . 29
3.2.2 Fusion Splicing . . . 29
3.2.3 Cleaving to Appropriate Length . . . 30
3.3 Biomedical Considerations . . . 31
3.3.1 Autofluorescence . . . 31
3.3.2 Mechanical Stresses . . . 32
3.3.3 Surgical Attachment . . . 32
3.4 Silver Nanoparticles with FITC Doped Silica Shell Grafting to DoubleD Fiber 33 3.5 Partial Conclusion . . . 35
4 Development of a platform for in vivo monitoring using novel optical probes 36 4.1 Signal Collection Apparatus . . . 36
4.1.1 Optical System . . . 36
4.1.2 Control & Analysis Instruments . . . 37
4.1.3 Communication System & Electric Supply . . . 38
4.1.4 Considerations & Limitations . . . 39
Arduino Controller . . . 39
Miniaturization . . . 39
4.2 Operating Software . . . 40
4.2.1 Graphical User Interface . . . 40
4.2.2 Typical Operation Procedure . . . 41
4.2.3 Acquisition Methodology . . . 42
4.2.4 Calibration Methodology . . . 43
4.2.5 Considerations & Limitations . . . 43
Ocean Optics USB2000+ Spectrometer . . . 43
Thorlabs Filter Changer . . . 44
4.3.1 Laser Risks . . . 45
4.3.2 Biological Risks . . . 45
4.4 Partial Conclusion . . . 46
5 In vitro validation of pH measurement using optical probe prototype system 47 5.1 Fluorescence Variation . . . 47 5.1.1 488nm Excitation . . . 48 5.1.2 450nm Excitation . . . 49 5.1.3 Ratiometric Variation . . . 50 5.2 Signal Stability . . . 51
5.2.1 Overlapping Raman Signal . . . 53
5.2.2 Fluorophore Conditioning . . . 55
5.3 Signal Robustness . . . 55
5.3.1 In vitro Feces Solutions . . . . 56
5.4 Experimental pH Measurement Validation . . . 57
5.5 Preliminary in vivo measurements . . . . 58
5.6 Partial Conclusion . . . 59
Conclusion 60 Bibliography 62 A Detailed Synthesis Protocols 69 A.1 FITC-APS Conjugate Synthesis . . . 69
A.2 FITC-APS Conjugate grafting to optical fiber . . . 69
A.3 Synthesis of Ag Nanoparticles . . . 71
A.4 Synthesis of FITC doped SiO2 shell on Ag Nanoparticles . . . 73
A.5 Immobilisation of Ag@SiO2@FITC on optical fibers . . . 74
A.6 Fusion Splicing of DoubleD to other silica fibers . . . . 78
A.7 Phosphate Buffer generation . . . 81
A.8 Method of addition of non-fluorescent paint and medical silicone to fiber probe . . . 82
A.9 Feces solutions for in vitro studies of fiber probe . . . . 84
B Detailed Program Code 86 B.1 Signal Collection Apparatus Software . . . 86
List of Tables
5.1 Theoretical Raman emission wavelength based on the peak Raman wavenumber
of the optical fiber material and the excitation wavelengths. . . 53 A.1 Optimized Settings for splicing 125 µm DoubleD fibers to other silica fibers . . 78 A.2 Phosphate buffer mixtures to achieve the predetermined pH . . . 82
List of Figures
0.1 Example of optical structures that can be generated using femtosecond laser
photoinscription techniques . . . 2 0.2 Overview of the individual aspect of the masters’ thesis and how they
respec-tively fall as part of the global objective. . . 5 1.1 Total internal reflection and Snell’s Law visualized . . . 8 1.2 Overview of basic components and their role in optical transmission . . . 9 1.3 Visual representation of Maxwell’s equations demonstrating a standing wave
generated in the dense medium and an evanescent wave generate in the rare
medium during TIR. . . 10 1.4 Penetration depth of evanescent wave as a function of incidence angle θ . . . . 11 1.5 Jablonski diagram representing the photoluminescent processes. . . 12 1.6 Photostability comparison of different commercial fluorophores . . . 14 1.7 Illustration of localized surface plasmon resonance through the irradiation of a
silver nanoparticle . . . 16 1.8 Poynting vector of an metal nanoparticle irradiated with a plane wave
corre-sponding to the plasmon frequency . . . 16 1.9 Jablonski diagram displaying elastic Raleigh scattering and both inelastic Stokes
and anti-Stokes scattering . . . 18 2.1 Schematic overview of the light path of an epifluorescence microscope . . . 20 2.2 OceanOptics 2000+ spectrometer apparatus view and schematic of internal
components. . . 20 2.3 Schematic of Agilent Cary 50 apparatus and the internal components. . . 21 2.4 Chemical structures of FITC, APS and the FITC-APS conjugate, respectively. 22 2.5 Model render of a silver nanoparticle of with a FITC-doped silica shell. . . 23 2.6 Transmission electron microscopy image of the Ag@SiO2@FITC particles. . . . 24 3.1 Dimensioned SEM image of a cleaved tip of the 125 µm DoubleD fiber. . . . 27 3.2 Overview of the covalent grafting process of the FITC-APS conjugate . . . 28 3.3 Epifluorescence microscopy image of the DoubleD fiber grafted with FITC. . . 28 3.4 Schematic of the multimodal fiber with a 105µm core coupled with the custom
DoubleD extrusion. . . 30 3.5 Brightfield microscopy image of the multimodal fiber spliced with the DoubleD
fiber. . . 30 3.6 Image of the loss of fluorescence length after fusion splicing of the multimodal
3.7 Bright field microscopy image of the opaque non-fluorescent paint added to the
tip of the DoubleD fiber. . . 32
3.8 Images of the medical silicone added to the tip of the DoubleD fiber to reduce mechanical stresses. . . 32
3.9 Stitched bright field microscopy image of the distal length of the fiber showing the proximal silicone balls used to attach the fiber to the gut wall on the left-hand side. . . 33
3.10 Schematic of the ”click” coupling scheme. . . 33
3.11 SEM images of the DoubleD fiber grafted with silver nanoparticles with FITC doped silica shells. . . 34
3.12 SEM image of the grafted DoubleD fiber surface. . . 34
3.13 Epifluorescence microscopy image of DoubleD fiber grafted with silver nanopar-ticles containing a FITC doped silica shell and FITC-APS fluorophore. . . 35
4.1 Signal collection apparatus schematic . . . 38
4.2 Views of the signal collection apparatus box . . . 39
4.3 Application screenshot of the acquisition pane. . . 40
4.4 Application screenshot of the settings pane. . . 41
4.5 Application screenshot of the settings pane after calibration is saved. . . 42
4.6 Software timing method to counteract the triggering limitation of the Ocean Optics USB2000+ spectrometer. . . 44
4.7 Examples of security items that were added to the signal collection apparatus to mitigate laser risks. . . 45
5.1 Overview of the in vitro experimental set-up. . . . 47
5.2 List of chemical forms of fluorescein. . . 48
5.3 Molar ratio of the fluorescein forms as a function of the environment’s pH. . . . 48
5.4 Absorption and emission of fluorescein at an excitation wavelength of 488 nm. . 49
5.5 Experimental fluorescence emission spectrum variation with respect to the en-vironments pH when excited at 488 nm. . . . 49
5.6 Absorption and emission of fluorescein at an excitation wavelength of 450 nm. . 50
5.7 Experimental fluorescence emission spectrum variation with respect to the en-vironments pH when excited at 450 nm. . . . 50
5.8 Variation of the calculated emission ratio of the fiber probe with respect to the environment’s pH. . . 51
5.9 Fluorescence emission spectrum measured over time at pH 7 for each excitation wavelength. . . 52
5.10 Calculated fluorescence emission for each excitation wavelength at pH 7 with respect to the consecutive measurement number. . . 52
5.11 Calculated ratio of fluorescence emission with respect to the consecutive mea-surement number. . . 53
5.12 Calculated ratio of adjusted fluorescence emission with respect to the consecu-tive measurement number. . . 54
5.13 Graphical representation of the overlap between the ”clean solution” measure-ments and the ”feces solution” measuremeasure-ments with their respective sigmoidal curves. . . 56
5.14 Graphical representation of the measurements done with the experimental ap-paratus. . . 57
5.15 Correlation between the laboratory verified pH of the solutions and the
exper-imentally measured pH using the optical probe. . . 58 5.16 Experimental in vivo measurements. . . 59 A.1 Normalized extinction spectra of the Ag seed-growth process . . . 73 A.2 Schematic of the thin tapered trailing filament of silicone to be created with
To my mother, Maria, who has put everything on hold to get me where I am today.
My code doesn’t work, I have no idea why. My code works, I have no idea why.
Anyone who has written code
”Qu’est-ce que tu fais ici‽” x10 Denis Boudreau
Acknowledgements
I would like to start by thanking both my co-directors André Marette and Denis Boudreau for welcoming me to their respective labs with open arms as I arrived to this new city. I could not have asked for a better duo in terms of intellectual stimulation, opportunity and true comedy. André, thank you for meeting me and seeing potential in my person. I will never forget that first meeting, when I discovered one of the most interesting, diverse and truly friendly persons alive. Denis, thank you for taking the time to nurture, listen and create the amazing atmosphere that is your laboratory. You are an inspiration for all your students, pushing them to the peak of their capacity while having the perspective for healthy work play balance. My time as part of the Boudreau’s will never be forgotten.
Thank yous are also due to the coordinator of the third thematic project of Sentinel North, Philippe St-Pierre, who has shown me that being a boss and being a friend are not mutually exclusive. Thank you for giving me scientific insight, being an additional mentor and drinking my beer. And remember; two gins is good, three gins is too much ¨⌣.
I’d like to thank everyone from the Boudreau group for all their support, from close or far, throughout my masters. Alexandre Grégoire, Nicolas Fontaine, Audrey Picard-Lafond, Jérémie Asselin, Marc-Antoine Bansept, Samuel Ouellet, Josée Richard-Daniel, Adolfo Sepul-veda, Alexis Lebrun, Marie-Pier Côté & Aurélie Berhault. Thank you for being an incredible team always willing to help a colleague out. You are all awesome, never change.
I’d also like to thank the Marette’s group. Although very large, the warmness and friendliness completely trumps the intimidating aspect of arriving as a new student. I’d like to very specifically thank the people I have spent most of my bar time with: Noëmie Daniel, Laurence Daoust, Mélanie Le Barz, Arianne Morissette, Béatrice Choi, Ida Søgaard Larsen, Benjamin Jensen & Marianne Jensen, thank you for all the cheers (and all the help, but lets face it, the beers were more fun).
Of course, one can not ignore the rest of the French population of Québec, who have made my time all that much more enjoyable. Cécile Vors & Marjorie Palmino, thank you for all the laughs.
Vallée’s group, who have been exceptional help in terms of ideas and recommendations on the optical side of the project on top of being all around great people to be with.
Thank you to Béatrice Choi, my significant other who has been behind all my good ideas. Beautiful, smart and ever so positive, you have helped me through my studies, have been my partner in all my adventures and have kept me calm and composed throughout the years. I could not imagine what this ride would be like without you and I wouldn’t repeat it otherwise. Thank you to my uncle and aunt Jean-Luc & Fabiola Charbonneau who have always helped my mother and I throughout my youth. Kind and generous, you guys were critical to me growing up and played an important role in developing the interests I have today. If I studied engineering and have an interest in sciences, its because of the common geeky enjoyment of learning about the newest and latest gadgets with you, uncle Jean-Luc, and for that I am truly grateful.
Thank you to the Martinez; Tatiana, Apolinar, Tañusha and Roberto. You guys have been a second family to me and have played an enormous role in sculpting who I am today. Thank you for bringing some perspective to my scientific life and always enduring me during Roberto and I’s chill sessions.
And finally I’d like to thank my brother Alexandro Azzi and, in particular, my mother Maria del Carmen Lazzaro, who has always encouraged me to follow my dreams and be the best rendition of myself. Through thick and thin, you have always found a way to help. Whether it be through making me breakfast because you knew I would skip it to sleep in that extra 15 minutes or spend quite literally all night awake to push me through a french exam that we both barely understood. You have always been strong, determined, extremely hard working and have put everything on hold to make sure your kids have all the opportunities in the world. Well, its time to rest, mom, because we, you and I, have made it.
Introduction
Research Context
Obesity has slowly become a global public health issue. In 2008, 25.4% of the Canadian adult population was deemed obese [1]. This value follows a dramatic rise in the prevalence of obesity in recent years, a trend that is also being seen around the globe [2; 3]. The World Health Organisation (WHO) has determined that approximately 1.9 billion adults around the world are overweight or obese [4], making this no rare occurrence. Its incidence is additionally accentuated in remote locations, such as in Canada’s first nation populations, where the prevalence of obesity reaches 1.6 times the national average [5], due to the social and lifestyle changes of the past 60 years.
Obesity is documented to be associated with a number of cardiometabolic diseases (CMD), such as type 2 diabetes mellitus [6; 7], which has been shown to reduce the length and quality of life [8] and to impact one’s mental health [9]. There is growing evidence that the incidence of obesity is linked to important changes in the gut microbiome, which may be a causal pathogenic mechanism in the development of CMD [10]. The composition of this community of microorganisms inhabiting the gastrointestinal tract varies between hosts and can be influenced through an assortment of factors, including the method of birth[11; 12], the type of diet and lifestyle [7] as well as the use of antibiotics [13; 14], to name a few. These microorganisms are symbiotic and often aid in physiological processes beneficial to the host, however, microbial dysbiosis can be associated with detrimental processes associated to obesity such as increase in low-grade inflammation and increase in energy absorption from food [10].
This new understanding is causing a shift in the biomedical field. The current tools lack the capacity to quickly and efficiently monitor the gut microbiota with adequate spatial and temporal precision, making preventive diagnostic and identification of key microbiota-derived biomarkers for alleviating such diseases difficult to identify. Current analysis of the gut microbiota is generally done through the use of sequencing techniques on stool samples collected at predefined time points. This approach relies on the extraction of DNA and high efficiency sequencing technologies, which permits identifying and quantifying the phelotypes
present in the collective genomes of the environment [15].
Although being a thorough technique generating large amounts of information about the bacterial species proportional presence, this method is complex, time consuming, requires highly trained personnel and only yields global results. That is, the stool samples collected are assumed to be an overall representation of the gut microbiota, when it is known that the microbial species proportions vary throughout the gastrointestinal tract [16]. Hence, current use of metagenomic techniques yields results with no spatial information and offers a poor temporal resolution that is often averaged over extended durations due to the labor intensive task of collecting stool sample, whether this be through clinical or animal model studies.
Project Objectives
Main ObjectiveWith the lack of appropriate biomedical tools for spacial and temporal gut microbiota analysis and the increase prevalence of obesity highlighted in the recent years, a project linked to the Sentinel North strategy, of which the works presented in this thesis are part of, was undertaken. This project aims to create the next generation of biomedical devices, based on optic and photonic techniques, to locally interrogate the gut microbiota for key markers known to be linked to cardiometabolic diseases in real time.
Given the magnitude of the goals pursued, this project incorporated various key players and highly qualified personnel specialized in different fields. The works can be grouped into 4 main aspects:
1. Optical Fiber Structures: Unlike traditionnal optical fibers containing a core, which permits transmission of light through the tip, the optical probe proposed uses the latest advances in femtosecond laser photoinscription techniques as depicted by J. R. Grenier [17].
Figure 0.1: Example of optical structures that can be generated using femtosecond laser photoinscription techniques. Adapted from [17].
As shown with line c in Figure 0.1 above, the concept is to photoinscribe a core that can deviate arbitrarily close to the surface, permitting the evanescent wave to interact with the environment around its periphery [18]. This opens the door to the possibility of having various interrogation sites around a single optical fiber.
2. Species Selective Fluorescent Nanoparticles: For the optical fiber to act as a probe, a light-based reporter needs to be used. On the periphery of the optical fiber, where the photoinscribed core is arbitrarily close to the surface and generates an evanescent wave, species-selective fluorescent nanoparticles are placed. These fluorescent particles can interact with the surrounding environment, leading to variations in fluorescence intensity or wavelength with the presence of metabolites of interest. These variations are detected by the optical detection system and allows the user to extract the information of interest.
3. Optical Signal Detection and Instrument Integration: For the new optical probe with fluorescent nanoparticles to be used as a medical device, its integration to an optical detection system is required. This turnkey section includes the connection to the optical fiber, the optical excitation/collection system as well as the software which transforms the raw optical information to viable data of interest. The work presented in this thesis is part of this aspect of the project.
4. In vivo Implantation: The probe was initially tested in murine animal models, which means that a surgeon was required to develop a implantation method which would permit proper fixation of the optical fiber while permitting the animal to preserve its standard living habits.
In the spirit of advancing the main objective promptly, the individual aspects described above were broken down into separate goals that would permit to individually demonstrate its ap-plication and feasibility rapidly before combining them in an operable tool. The Optical Fiber
Structures as well as the Species Selective Fluorescent Nanoparticles aspects are both upstream
of the tools’ development, which means that their goals were mainly unchanged. The Optical
Signal Detection and Instrument Integration however, relies on the optical structures as well
as the species selective fluorescent interrogators in order to properly design and integrate the required system. For this reason, the Optical Signal Detection and Instrument Integration aspect took advantage of a simplified optical fiber structure as well as a simplified fluores-cent reporter, which would permit the development of an initial system that uses the same principles as expected in the final structures. Similarly, the In vivo Implantation aspect uses the simplified optical sensor probe developed in the Optical Signal Detection and Instrument
Specific Objective
The works presented in this thesis encompass the Optical Signal Detection and Instrument
Integration aspect shown above, which aims to develop an initial optical fiber probe and
mobile detection system for in vivo measurements, illustrated in Figure 0.2. The project will therefore focus on achieving the following objectives:
• The development of a simple optical fiber structure which uses evanescent wave as a method of interrogation of surface-bound molecular probes;
• The development of a simple fluorescent reporter of a characteristic of interest with respects to the gut microbiota;
• The development of a mobile optical detection platform;
• The development of control and analysis software with graphical user interface;
• The integration of the optical fiber probe with the prototype detection system for vali-dation in vitro and in vivo.
Proposed Concept
Within the scope of this masters’ thesis, an optical probe composed of two sections of optical fiber, core-cladding and coreless, was developed. This probe permits the transmission of the interrogative excitation light and collection of the resulting light over several meters to and from the probing region. The structure exploits the concept of an evanescent wave interacting with fluorescent reporters grafted on the peripheral glass surface. The reporter was chosen for its natural pH dependent fluorescent emission properties. The choice of pH as the first reporter with respect to the gut microbiota comes from the pH dependence of many living organisms and its specific capacity to influence the diversity of the phylotypes inhabiting regions of the gastrointestinal tract. The aspects concerning the development of the pH optical probe are described in detail in chapter 3.
For the optical probe to have the capacity to returns viable results to the user, a turnkey aspect is also incorporated in the works. The development of an optical system permitting the proper injection of light to the optical probe as well as collection of the returning signal was built, optimized and validated. Accompanying software was developed to control the system as well as analyze the brute data into information that is relevant to the user. The details concerning the development of the optical system and the corresponding software are discussed in chapter 4.
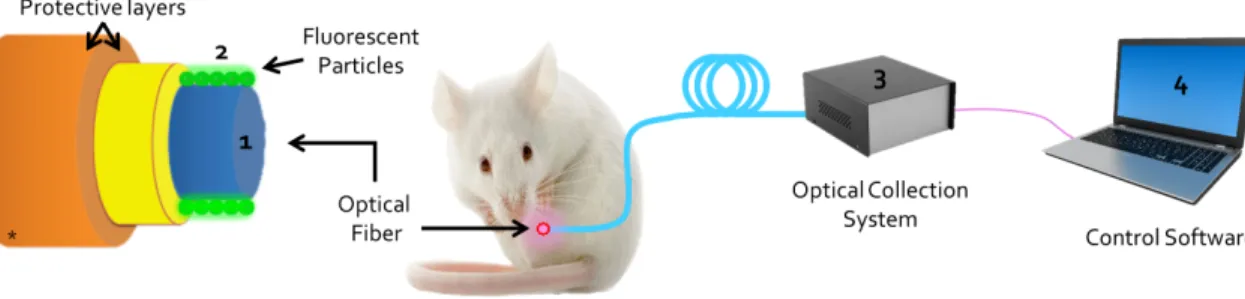
The integration of all elements; fiber, fluorescent sensor, optical excitation and collection system as well as software is applied and validated in vitro in chapter 5. An overview of the individual elements as they correspond in global objective can be seen below.
Figure 0.2: Overview of the individual aspect of the masters’ thesis and how they respectively fall as part of the global objective. (1) Optical fiber, (2) Fluorescent particles, (3) Optical Collection System and (4) the control and analysis software. (*) adapted from
Chapter 1
Theory
This chapter of the thesis introduces the theoretical aspects relevant to the results generated and discussed in the following chapters. After reading this section, the reader should have the capacity to offer a critical view of the work done.
1.1
Gut Microbiota
The human gastrointestinal tract, on top of being one of the largest interfaces with the external environment, is home to an impressive collection of microorganisms. Its composition is estimated to be over 104 separate microorganisms with a collective genome containing 100
times the amount of genes compared to the human genome [20].
1.1.1 Composition & Modulation
This community of bacteria, archaea and eukarya is termed the gut microbiota and is the main motivation for this masters project. This community is still far from being fully identified, especially due to the fact that it can vary greatly between hosts, yet microbial repertoires already have over 2000 isolated species cataloged [21] with a majority of them being a member of Proteobacteria, Firmicutes or Bacteroidetes phyla [22]. Its exact composition is governed by a complex combination of factors, including the type of delivery method when born [11; 12], the environment [23], the use of antibiotics [13; 14], one’s genetic background [24] and, of course, the type of diet [7]. The relationship of the host with gut microbiota has often been described as commensal, when it is in fact mutualistic. That is, this community has been shown to play important beneficial functions, whether it be metabolic, such as the fermentation of large polysaccharides, trophic, through the control of the intestinal epithelial cell proliferation, or protective, as a barrier for foreign pathogens [25]. On the other hand, the microorganisms also benefit from the host by being supplied with rich nutrients to feed on and, in the case of the anaerobic organisms mainly inhabiting the colon, an anoxic environment
1.1.2 Role in Diseases
As can be expected, no two microbiotas are identical as they are molded to equilibrium by one’s life events. Yet, as their composition is modulable, there is potential for microbial balances to be disrupted, commonly known as dysbiosis. With advances in the methods of analysis of the recent years, the role of the gut microbiota on one’s health has become increas-ingly evident. Various studies reveal relationships with asthma [26], chronic liver diseases [27], their role on the autism spectrum [28] as well as obesity and type 2 diabetes [7], demonstrating the importance of this ensemble of organisms.
The marker of microbiome activity on function in this project was determined to be pH as its variation reflects on the gut bacteria diversity and taxa abundance relative to other taxa. For example, it has recently been shown that the fecal pH of infants has significantly shifted in the past 100 years and, with it, bacterial families, with an important decrease in Bifidobacterium abundance [29]. The profound impact of pH variation over a short time scale is easily seen in the colon, where many anaerobic bacteria participate in fermentation processes and where an increase of only 1 pH unit leads up to 4-fold shifts in short-chain fatty acid production [30]. Hence, it is clear that the organisms inhabiting the gastrointestinal tract play an important role in one’s health and that even a simple marker such as pH leads to important variations, making this a good first marker of interest for detecting microbial functional changes.
1.1.3 Current Analytical Methods
Current analytical methods are based on sequencing techniques, which directly isolate the entirety of the genetic material present in a sample without prior isolation or microorganism culture. Two main methods are currently used in the analysis of gut microbial communities; primary targeted amplicon sequencing and whole metagenome shotgun sequencing [31]. In either methods, the inherent logic and most of the labour intensive steps remain the same. That is, stool samples must be collected and conserved until the end of the experimental protocol, when the analysis can take place. The samples are then broken down in order to extract the totality of the genetic material present using isolation kits and are then sequenced using Next Generation Sequencing (NGS) techniques, which permit the sequencing of millions of DNA reads simultaneously. The output of this sequencing then goes through filtering and bioinformatic processes, in order to make the information accessible and cvomparable while interpretation is accomplished by differentiation of the accessible transformed information of the test samples with the control samples [32]. The sample preparation steps are often done by the same personnel that collect the samples and interpret the data, while the analysis is often done by a highly trained bioinformatician.
1.2
Optical Fibers
The transmission of light through media has long been discussed in the 20th century. Today
optical fiber structures can range widely in material, shape and size depending on the aimed application, with high interest in the field of telecommunications due to the small overall size as well as the high speed and bandwidth capacity of modern structures.
The intrinsic properties of optical fibers can be easily understood through the use of the concept of total internal reflection (TIR), Figure 1.1. This phenomena is a specific case when light travelling through a medium of high refractive index (n1), also known as a dense medium,
reaches the interface with an environment containing a lower refractive index (n2), the rare medium. The properties of this phenomena are well described by Snell’s law, relating the indices of refraction of the medium to the incidence angle θ and the typical angle of refraction
φ.
n1sinθ = n2sinφ (1.1)
However, when the incident angle θ leads to a refraction angle φ of 90°, total internal reflec-tion arises. This angle of incidence is called the critical angle θc and can be determined by
rearranging equation 1.1 above.
θc= sin−1(
n2
n1
) (1.2)
A ray arriving at the interface with a incident angle θ of equal or superior value to the critical angle θc is reflected with the same angle θ into the dense medium instead of being refracted in the rare medium.
Figure 1.1: Total internal reflection and Snell’s law visualized [19]
1.2.1 Traditional Optical Transmission
index of refraction than the core, which is often silica doped with another chemical species [33]. By looking at the system in a ray optics point of view, a light ray injected into the core with an incident core-cladding angle of θ, which is greater or equal to the critical critical angle θc, will undergo total internal reflection as shown in Figure 1.2. The ray is then reflected
towards another core-cladding interface where, due to the cylindrical symmetry of the fiber structure, it will once again be subject to TIR and propagated throughout the length of the structure until reaching a new termination.
(a) Rendered 3D view of the components of an optical fiber [34].
(b) Side cut view of the components of an optical fiber and their role in ray propagating. Adapted
from [33].
Figure 1.2: Overview of basic components and their role in optical transmission
It is therefore evident that light entering the core with angle φ, complimentary to θ shown in Figure 1.2b, smaller than the critical injection angle φc can be guided [35]. This range of
acceptable angles are better known as the dimensionless number called numerical aperture, which is defined as N A = sinφ = 1 n0 √ n2 core− n2clad (1.3)
where n0, ncore and ncladare the index of refraction of the surrounding medium, the core and the cladding, respectively.
Although Figure 1.2 demonstrates the light propagation concept well, these diagrams are only representative of step-index multi-mode fibers, which consists of a core whose diameter is a large multiple of the propagating wavelength λ. When the core diameter is reduced to approach the size of the propagating wavelength, diffraction effects begin to dominate, leading to light being confined to a single mode propagating along the waveguide axis [35]. These types of fibers are denoted single-mode step-index fibers.
In both cases, in properly adapted fibers, light injected through a properly cleaved extremity is transmitted through the core until reaching a termination. The light transmitted is typically not accessible throughout the length of the optical fiber.
1.2.2 Evanescent Wave
As described at the introduction of chapter 1.2, light travelling in medium n1 striking an
interface with n2, where n1 > n2, at an incidence angle θ greater than the critical angle
θc will undergo total internal reflection. In this scenario, the Maxwell’s equations properly
predict a standing wave in the material of n1 containing the incident wave but also reckons a
perpendicular, non-propagating, exponentially decaying electromagnetic disturbance on the opposite side of the interface, in the rarer material [36; 37], demonstrated in Figure 1.3. This disturbance is commonly known under the name of evanescent wave due to its failure to propagate and rapid amplitude decrease from the interface.
Figure 1.3: Visual representation of Maxwell’s equations demonstrating a standing wave generated in the dense medium and an evanescent wave generate in the rare medium during
TIR [36].
This evanescent wave is of same nature than the standing wave, yet the amplitude of the electric field generated is evanescent in nature with an exponential decay defined by
E(z) = E0e−z/dp (1.4)
where E(z) and E0 define the electric field amplitude at distance z from the interface and at
the interface, respectively, as shown in Figure 1.3. dp is defined as follows:
dp= λex 2πn1 √ 1 sin2(θ)− (n2 n1) 2 (1.5)
It represents the distance necessary for E(z) to decrease to a value of 1/e from E0 and is known as the penetration depth.
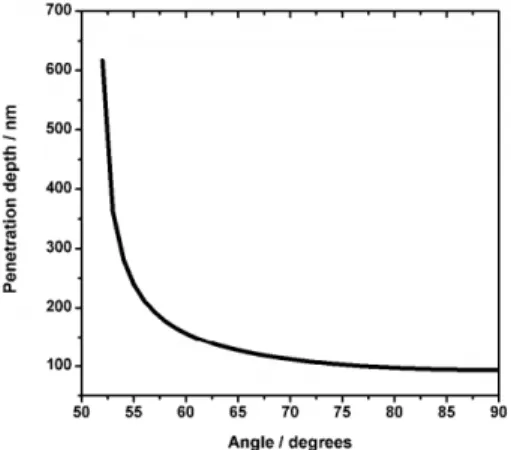
As can be seen in equation 1.5 the penetration depth of this phenomena depends on the incident wavelength λex and the indices of refraction of the two media n1 & n2, but more importantly depends on the incidence angle of the light at the interface θ. As the angle of
Shown in Figure 1.4, C. Tregidgo et al. demonstrated the calculated penetration depth at a glass prism (n = 1.70) - aqueous buffer solution (n = 1.33) interface (θc= 51.5°) illuminated with a 467 nm source as a function of the incidence angle θ [37], which resembles some of the conditions presented in this thesis.
Figure 1.4: Penetration depth of evanescent wave as a function of incidence angle θ. Interface is between a glass prism with refraction index of n = 1.70 and a aqueous buffer solution with refraction index of n = 1.33. Critical angle was determined to be θc= 51.5°.
Illuminated with a 467 nm source. [37]
1.3
Fluorescence
Fluorescence and phosphorescence are the two photoluminescent phenomena that arise from the interaction between light and matter. This elastic process is characterized by the non-radiative loss of energy through vibrational relaxation between the undertaking of absorption and emission to and from an excited state. The distinction between fluorescence and phos-phorescence is often associated to the major difference in emission times, where fluorescence happens in the order of 10 ns where as phosphorescence rates are noticeably slower with rates in the order of milliseconds to seconds. This major contrast arises from the difference between the nature of the excited state, one being in the singlet state in contrast to the triplet state [38]. The processes are often represented through a Jablonski diagram, as shown in Figure 1.5 below.
1.3.1 Mechanism
Fluorescence begins by the absorption of a photon of specific wavelength characteristics (λex)
defined by the photoluminescent material. This process happens in the order of 10−15s and,
following the Franck-Condon principle, excites the fluorophore from the ground electronic state to a higher vibrational state of the first S1 or second S2 singlet electronic state. In the case that the molecule is excited to the S2 electronic state, rapid (10−12s)
Figure 1.5: Jablonski diagram representing the photoluminescent processes. λex, λF and λP
represent the excitation wavelength, fluorescent emission wavelength and phosphorescent emission, respectively. S0, S1 and S2 are the ground, first and second singlet electronic
states, respectively, while T1 indicates the first triplet state.
state S1. Similarly, as the molecule attempts to reach thermal equilibrium in the excited state, vibrational relaxation (10−12s) occurs, often bringing the molecule to the lowest vibrational
state of S1 before proceeding through further process. Return to one of the vibrational levels
of the ground electronic state (10−8s) occurs through the emission of a photon which is
typically of lower energy and therefore of higher wavelength (λF). This difference in peak
spectral wavenumber during excitation and emission is known as the Stokes shift and is characteristic to each fluorophore.
Although emission of a photon through fluorescence (10−8s) is the process of interest in these
works, it is important to note that fluorescent emission competes with other processes that may arise. Non-radiative extinction of fluorescence is possible through collisional quenching with another molecule (not shown), through Förster Resonance Energy Transfer (FRET, not shown), or through internal or external conversion to a high vibrational level of the ground electronic state S0 [39]. Another process is through intersystem crossing, which brings the fluorophore to the triplet state T1. A transition from this state to S0 is forbidden and hence
results in transition times several order of magnitudes longer (102 − 10−3s) compared to
fluorescence emission. This transition is termed phosphorescence and often emits a photon of lower energy than fluorescence, consequently explaining its typical longer wavelengths λP
[38].
1.3.2 Absorption Cross-section
For fluorescence to occur, initial photon absorption by the molecule must take place. Al-though a certain fluorophore might have an important molecular cross-section, it does not necessarily correlate with the effective cross-section of absorption. Many compounds display
a smal absorption cross-section meaning that certain photons, although reaching a molecule in its ground electronic state, will not lead to excitation. Experimental determination of the effective cross-section of absorption can easily be established due to its direct relation to the molar extinction coefficient [38]. If we consider a sample solution of thickness d, containing n molecules per cm3 being irradiated I, the Beer-Lambert law can be represented as follows:
lnI0
I = σnd (1.6)
where σ is the effective cross-section of absorption in cm2. Yet Beer-Lambert’s can also be
represented as
logI0
I = ϵcd (1.7)
where ϵ is the molar extinction coefficient in M−1cm−1 and c is the concentration in M /L. By combining equations 1.6 and 1.7 together while noticing that n and c are related through Avogadro’s number, a relation between σ and ϵ can be evident:
σ = 3.82∗ 10−21ϵ (1.8)
1.3.3 Quantum Yield & Fluorescence Lifetime
Following excitation through the absorption of a photon, the molecule goes through one of the processes introduced in section 1.3.1. The processes that may occur leads to the definition of quantum yield (Q) & fluorescence lifetime (τ ). Quantum yield is defined as the ratio of fluorescent emitted photons to the number of absorbed photons. Given that an excited molecule must return to S0, the quantum yield can be calculated as a ratio of
rates of fluorescence emission kr depopulating the excited state compared to the totality of depopulation factors, that is, both the radiative fluorescent emission rates kr and all other
non-radiative decay processes knr.
Q = kr kr+ knr
(1.9) A quantum yield Q that approaches unity indicates a high rate of fluorescence emission and low non-radiative process competition [38].
Fluorescence lifetime is defined by the average time the fluorophore spends in the excited state before returning to the ground state. It is an important concept, as this defines the amount of time the molecule is available to interact with its environment, possibly leading to an increase in non-radiative decay knr or non-reversible deactivation of the molecule. This will be further discussed in section 1.3.4 below. The average lifetime can be calculated as follows:
τ = 1 kr+ knr
Following the excitation of a single fluorescent species through a light pulse following a dirac
δ function, a exponential fluorescent decay defined by equation 1.11 can be measured.
If(t) = kr[A∗]0e−
t
τ (1.11)
where If(t) is the fluorescence intensity at time t and [A∗]0 is the initial concentration of
fluorophores excited [39]. As any single exponential equation, although some photons are emitted at time t = τ , the lifetime defines the time for 63% of the molecules to decay [38]. Products with high Q and low τ are often desired as they not only display the highest emission ratios for the excitation power supplied, but also exhibit high rate of emission, leading to a higher overall brightness. However, it is important to note that this is not always the case as the preeminent conditions vary depending on the application of interest.
1.3.4 Fluorophore Stability
As a fluorophore continuously cycles through the excited and ground state, it can be perturbed due to internal or external factors to a point where it loses its fluorescent capacity. All fluorophores are subject to this phenomena, known as photobleaching, at different rates, Figure 1.6. This may occur during internal conversion, where the molecule is perturbed in its
Figure 1.6: Photostability comparison of different commercial fluorophores [38]. resonant structure, leading to failure of a bond and therefore loss of its fluorescent properties. Another photobleaching occurrence can be due to interaction between the molecule in the excited state and an oxidizing species, leading to structural changes [38]. As mentioned in section 1.3.3, the fluorescence lifetime plays an important role in the vulnerability of the fluorophore to this type of bleaching given that it dictates the amount of time the molecules spends in the excited vulnerable state.
In either case, the excitation of the fluorophore inevitably leads to a decrease in fluorescent population with each repeated exposure.
1.3.5 Ratiometric Measurement Capacity
Fluorescence, on top of being a fascinating phenomena, can be used as a reporter to extract information about its environment. The local environment can have a profound effect on the emission spectrum, excitation spectrum and/or the quantum yield of a fluorophore. Just as most fluorescent properties, their reporting capacity varies greatly on the chemical structure of these fluorophores and the method of interrogation [40]. Many fluorescent reporters have been developed throughout the years for different applications, such as calcium (Ca2+) [41]
and Zinc (Zn2+) [42] detection, pH measurement [43] as well as the imaging of ascorbic acid
[44], to name a few.
Depending on the analyte, different methods of observable fluorescence variations can be used to measure the factor of interest, this includes the use of anisotropy, time-domain lifetime, phase-modulation and, the most direct method, intensity measurements [38]. However, reli-able intensity measurements are often difficult to achieve and reproduce due to the intersam-ple net fluorophore variation, the decaying nature explained in section 1.3.4 and instrumental variations that can be difficult to control [45].
When possible, ratiometric intensity measurements of the fluorophores is a favorable method of extracting the information. If the fluorophore exhibits spectral shifts upon interacting with the target, the ratio of these variations can be correlated with the analyte. This method relies on taking the ratio of fluorescence intensities emitted by either exciting at two separate wavelengths (named as dual excitation) or collecting at two emission ranges (named dual emission). This method permits the correction of intrasample biases that may arise due to uneven loading or heterogeneous distribution of the sensing substrate or volume, intersample biases due to focus or fluorophore concentrations, variations due to instrumental loses and photobleaching [38; 40; 45].
1.4
Plasmonic Nanomaterials
The interest in nanosized metallic particles can be traced back to the roman times, where their interesting optical properties were used to generate unique colours in glass [46]. Since then, these properties have been explained as the collective oscillation of the free electrons of theses nanoparticles (NPs), known as the surface plasmon oscillation [47].
Noble metal structures, most specifically gold and silver, of nanometric size exhibit partic-ular optical properties when irradiated with a wavelength superior to their size. In certain conditions, the irradiation light can cause the electron density to polarize to one surface and resonate with the light’s frequency, generating a standing oscillation [47]. This is known as localized surface plasmon resonance (LSPR) and, in its simplest form, is analogous to a driven mass-spring harmonic oscillator [48].
Figure 1.7: Illustration of localized surface plasmon resonance (LSPR) through the irradiation of a silver nanoparticle [47]
In the case of silver and gold nanoparticles, their absorption is mainly found in the visible, but their spectrum can be fine-tuned for different applications by modulating the material, shape, size as well as the refractive index of its surrounding [49].
When irradiated with the corresponding plasmon frequency, this standing oscillation has the ability to produce a large local electromagnetic field enhancement through an increase in absorption capacity, as shown in Figure 1.8, while also displaying an increase in scattering properties. This so-called plasmon can be exploited in a variety of methods, from generating local heat to induce cellular hyperthermia in squamous cell carinoma in mice through pho-tothermal effects [50] to enhancing spectroscopy techniques such as through surface-enhanced Raman scattering (SERS).
Figure 1.8: Poynting vector of an metal nanoparticle irradiated with a plane wave corresponding to the plasmon frequency [51]
1.4.1 Metal Enhanced Fluorescence (MEF)
The plasmon has additionally been exploited to favorably modify fluorescent properties of molecules in proximity to the metallic substrate, hence its name: metal enhanced
fluores-limited by its photostability and its quantum yield, yet when placed in range of the surface plasmon electrons, new, favorable, excitation and relaxation pathways are made available to the fluorophore [52].
An excitation pathway is made available to the fluorophore by taking advantage of the sub-stantially larger absorption cross-section and enhanced localized magnetic field that is gener-ated by the metallic nanoparticle.
The relaxation pathway is best described by the addition of a new emissive rate km to
equa-tions 1.9 and 1.10, which describe the quantum yield and fluorescence lifetime of a standard fluorophore. When placed in proximity of a metal (m), the metal enhanced quantum yield
Qm can be defined as
Qm=
kr+ km
kr+ km+ knr
(1.12) and the metal enhance fluorescence lifetime τm as
τm=
1
kr+ km+ knr
(1.13)
As can be seen in the equations above, an increase in metallic emission rate km generates both an increase in quantum yield and a decrease in lifetime, leading to superior fluorescence emission and photostability [53].
On top of a greater quantum yield, the complimentary effects of superior excitation and shorter emission times leads to a higher cycling rate of the fluorophores coupled with the plasmonic material. This translates into a net rise in fluorescence perceived over a period of time, permitting to achieve a better signal to noise ratio and/or to reduce the incident irradiation power.
1.5
Raman Spectroscopy
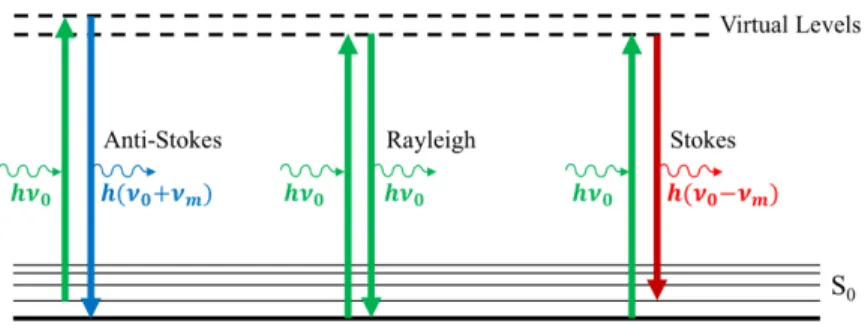
Raman spectroscopy, similar to infrared spectroscopy, exploits the interaction of light with low-frequency modes such as vibrational and rotational movement of molecular structures. This leads to spectral data that is often known as a ”fingerprint” of the substance of interest based on its chemical bonds. Raman signals are generated from light-induced distortions in the electron cloud of the molecule. These reflect the vibrationnal modes from the structure, where the main Raman peaks are generated from symmetrical vibrations. In a classical view, a molecule can be considered as a complex mechanical system, where each bond/atom pair follows the principles of a hamornic oscillator [54].
A sample being irradiated most often undergoes a perfectly elastic process known as Rayleigh scattering. That is, the incident beam excites the electron to a virtual state and scatters a photon of identical energy when returning to its ground vibrational state. However, a
fine portion of the light goes through an inelastic process: Raman scattering. This process radiates a photon of different frequency than the incident light ν0 based on the structure of the molecule. This can be of greater wavelength (lower frequency ν0 − νm), known as
a Stokes transition, or of lower wavelength (higher frequency ν0+ νm), known as an
anti-Stokes transition. The former arises when the electron relaxes to a vibrational level higher in energy than the ground state, hence leading to a net loss in energy, while the latter arises when the electron is excited from a thermally-populated excited vibrational level and relaxes to the ground state [54; 55; 56]. It is important to note that, due to the Maxwell-Boltzmann distribution of levels at room temperature, Stokes scattering is often stronger than anti-stokes scattering. These transitions are also not to be confused with fluorescence and phosphorescence discussed in section 1.3 as they occur far below the electronic excited states (S1,S2,. . . ).
Figure 1.9: Jablonski diagram displaying elastic Raleigh scattering and both inelastic Stokes and anti-Stokes scattering
Chapter 2
Experimental Methods
2.1 Characterisation Techniques
2.1.1 Epifluorescence Microscopy
Epifluorescence microscopy is a well known method of visualizing fluorescent structures in complement to the standard scattered, reflected and absorbed light of traditional microscopy. A Olympus BX53 fluorescence microscope was used to visualize and validate many of the structures presented in this thesis.
The backbone of the technique relies on the use of interference filters to control the excitation wavelength, i.e. the light irradiating the sample, and the emission wavelength, i.e. the light being emitted by the fluorophores that arrives to the detectors. These filters are selected based on the fluorophore of interest given peak excitation and emission wavelengths [57]. The set of 3 filters, excitation, dichroic and emission, are usually placed on a fluorescence cube for ease of adjustment. A continuum light source is sent to the excitation filter, which selects the peak excitation wavelength to be reflected by the dichroic mirror and sent to the sample. As the sample cycles between excited and ground state, fluorescent light being of higher wavelength is emitted and collected through the same optical path until it is transmitted through the dichroic mirror and emission filter to reach the detector. An overview of the concept can be seen in Figure 2.1 below.
Figure 2.1: Schematic overview of the light path of an epifluorescence microscope
2.1.2 Spectrometry
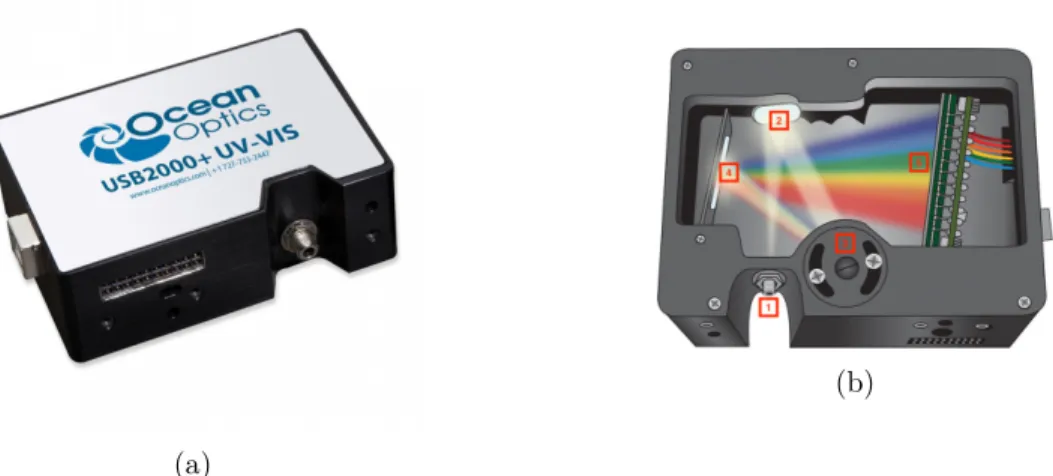
The light collected through the optical system presented in chapter 4 is analyzed through a OceanOptics USB2000+ spectrometer. The spectrometer sends the light to a diffraction grating, which disperses it on a charge couple device (CCD), which then converts photons into a digital signal. The signal is transferred to the appropriate software through a USB port. The spectrometer and schematic of the internal components can be seen in Figure 2.2 below.
(a)
(b)
Figure 2.2: OceanOptics 2000+ spectrometer (a) Apparatus view. (b) Schematic of internal components. 1) Fiber connector, 2) Collimating mirror, 3) Diffraction grating, 4) Focusing
2.1.3 UV-Visible Spectroscopy
In order to characterize the absorption and diffusion of substrates of interest, a UV-visible spectrometer was used. The Agilent Cary 50 was the apparatus used. It contain a xenon light source, which permits the emission of light ranging from 190 to 1100 nm. A monochromator permits to sweep the light wavelength being sent to the sample, which can either be in a solvent or a solid substrate. Transmitted light through the sample is measured through a detector placed behind it [59]. The main components that be seen in the schematic of the apparatus below.
Figure 2.3: Schematic of Agilent Cary 50 apparatus and the internal components. 1) Xenon lamp source, 2) Monochromator, 3) Sample and 4) Detector. Adapted from [59]
2.1.4 pH Measurement
As a control method, commercial pH meters were used. These apparatus use electrodes and rely on the electric conductivity of a solution. Given that acidic solutions has a greater amount of positively charged hydrogen ions, it has a greater electrical current potential. With the use of a glass bulb containing sodium and calcium compounds as well as a reference electrode, the apparatus measures the charge difference between both probes. This variation, often in the order of millivolts, can be calibrated to known buffer solutions, hence permitting the system to report repeatable pH measurements based on this potential [60; 61].
2.1.5 Transmission Electron Microscopy (TEM)
Transmission electron microscopy (TEM) was used to determine the size and morphology of the metallic nanoparticles synthesized as part of this thesis. The concept works based on irradiation of a specimen with an electron beam generated from a tungsten filament. This beam is manipulated through a series of condensers and lenses until passing the specimen and reaching a detector, which permits visualizing and measuring the structures of interest [62].
2.1.6 Scanning Electron Microscopy (SEM)
Unlike transmission electron microscopy, scanning electron microscopy (SEM) is capable of analyzing bulk specimens as it relies on the reflection and scattering of a focalized electron beam to generate an image. In the context of the works presented here, SEM is used to visualize and confirm the grafting of the nanoparticles on our glass substrate, that is, our optical fibers. It permits visualizing individual nanoparticles as well as their distribution on the substrate [63].
2.2 Synthesis Methods
2.2.1 Fluorescein Isothiocyanate (3-Aminopropyl)triethoxysilane
Conjugate
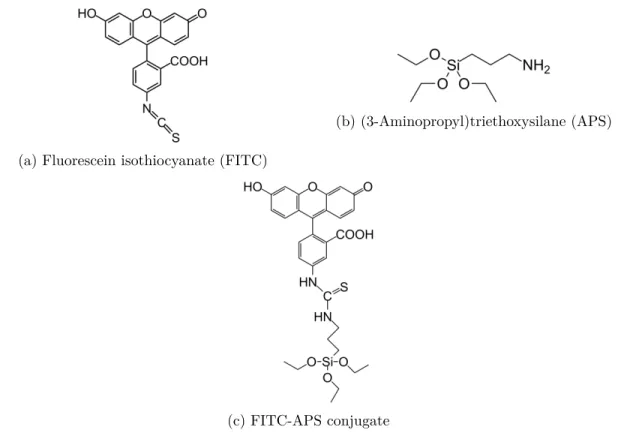
Fluorescein isothiocyanate (FITC) is the main fluorescent reporter discussed in this thesis. On itself, however, FITC does not contain the required structures to covalently bond onto a silica substrate. Through the mixing of the fluorophore with triethylamine, dimethylfor-mamide (DMF) and (3-Aminopropyl)triethoxysilane, referred to APS, a conjugate FITC-APS structure was synthesized. The individual structures as well as the conjugate can be seen in Figure 2.4.
(a) Fluorescein isothiocyanate (FITC)
(b) (3-Aminopropyl)triethoxysilane (APS)
(c) FITC-APS conjugate
The triethoxysilane end of the APS permits a silylation process to occur, which will be used in section 3.1.2. The detailed protocol concerning the synthesis of this conjugate can be found in appendix A.1.
2.2.2 Silver Nanoparticles with FITC-doped Silica Shell
A magnification in the fluorescent properties of the FITC-APS structure from 2.2.1 was ex-plored through the use of metal enhance fluorescence (MEF) with the use of silver nanoparti-cles. The proposed structure is a 80 nm spherical silver nanoparticle with a 10 nm FITC-doped silica shell grown over the structure refered to as Ag@SiO2@FITC, as shown in the model render of Figure 2.5. This permits for plasmonic properties to be generated and interact
Figure 2.5: Model render of a silver nanoparticle of 80 nm with a 10 nm FITC-doped silica shell. Section cut was made for visualization purposes.
with the fluorophore which is fixed in proximity to the core [64], while being capable of ions transfer with the environment.
The development of this structure is done through a seed-growth method, where an initial homogeneous colloid mixture is used to grow the nanoparticles in a controlled fashion to the desired size [65]. The synthesis begins with the creation of metallic seeds through the reduction of silver nitrate (AgNO3) with sodium borohydride (NaBH4). This strong reducer generates nucleation points where the silver seeds form, while stabilizing the solution and avoiding interparticle aggregation. Final size of the particles is controlled by the successive stepwise addition of the metallic salt and sodium citrate to generate growth. The FITC-doped silica shell is synthesized by the initial mixing of the colloidal suspension in ethanol with tetraethyl orthosilicate (TEOS) and dimethylamine (DMA). This generates a thin silica layer on the silver nanoparticles before adding the FITC-APS solution to the mixture for the rest of the silica shell. The detailed synthesis protocols can be found in appendix A.3 and A.4
(TEM) and revealed that the structure display spherical-like structures with a silica shell clearly visible on its periphery.
Figure 2.6: Transmission electron microscopy image of the Ag@SiO2@FITC particles. Spherical morphology of the silver core (opaque) and FITC doped silica shell (transparent).
The opaque dots seen in the shell are silver seeds from the seed-growth process to generate nanoparticles.
2.2.3 Phosphate Buffer Solutions
Calibration of pH measurement were done using laboratory-made phosphate buffers. Be-ing quite simply a balance of potassium dihydrogen phosphate (KH2PO4) and dipotassium hydrogen phosphate (K2HPO4), these solutions were made at a concentration of 10 mM as required during the experiments below and will be referred to as phosphate buffer solutions from now on. The detailed protocol can be found in appendix A.7.
2.2.4 Feces Solutions
In vitro measurements were done by generating solutions with known pH values that contained
the complex matrix of the gut. Dry, Chow diet fed, mice feces were collected by collaborators at the CRIUCPQ and ground into a fine powder. A quantity of 1% dry mass was added to each of the 10 mM phosphate buffers having pH values between 5.5 and 8.5. The solutions then go through a sonication and vortex mixing process, repeated every 24 hours for a period of 2 days, in order to ensure homogeneity. The solutions pH were verified using a dedicated portable pH meter, in order to avoid contamination of the laboratory equipment. Any discrepancies between the buffer pH before addition of ground feces was adjusted through the addition of dilute hydrochloric acid (HCl) or potassium hydroxide (KOH) depending on the direction of adjustment, as done by other groups for various biomedical applications [66]. The detailed protocol can be found in appendix A.9.
2.3
Contributions
It is important to note that much of the work presented in this thesis have been completed in collaboration with various actors. The contributions vary in scope and are mentioned below.
• Nicolas Fontaine: His contributions pertain to aiding me in the optimization and generation of the fluorescein isothiocyanate conjugate of section 2.2.1, aiding me in the optimization and generation of the silver nanoparticles with FITC-doped silica shell 2.2.2 and aiding me in the development of the method of grafting of FITC doped silica shell to the DoubleD fiber as described in section 3.2.
• Adolfo Sepulveda: His contributions pertain in aiding in the collection of in vitro and
in vivo measurements as described in sections 5.
• Vanessa Vilela: Her contribution pertains to the execution of surgeries at the IUCPQ. • Jérôme Lapointe and Jean-Philippe Bérubé: Their contributions pertain to trans-ferring knowledge with regards to fusion splicing and fiber cleaving as described in 3.2. • Jérémie Asselin: His contribution pertains in transferring knowledge with regards to
the generation of phosphate buffer solutions of sections 2.2.3.
• Béatrice Choi: Her contribution pertains to the collection of mice feces as described in section 2.2.4.
• Steeve Morency and Younès Messaddeq’s laboratory: Their contribution per-tains to the extrusion of the DoubleD fiber as described in section 3.1.1.
Chapter 3
Development of a pH-dependent
optical probe for in vivo
measurements
As described in the Introduction, an optical probe composed of two optical fibers was de-veloped. The probe exploits the concept of evanescent wave to interact with the fluorescent interrogators placed on its periphery. The following subsections break down the steps in-volved in the development of the first and second aspect of the masters’ thesis, as shown in Figure 0.2.
3.1
FITC-APS Conjugate Grafting to DoubleD Fiber
3.1.1 DoubleD Fiber
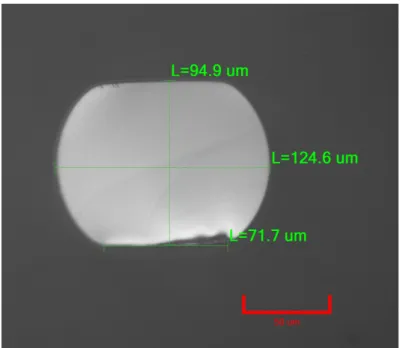
Keeping in mind that the main objective of the project involves the development of custom optical fiber containing a core that deviates arbitrarily close to the surface and taking into account femtosecond laser photoinscription considerations, a custom coreless fiber has been used for the sensing length of the probe. This extrusion is of 125 µm diameter and comprises two flat surfaces, as shown in Figure 3.1.
Figure 3.1: Dimensioned SEM image of a cleaved tip of the 125 µm DoubleD fiber.
The structure is referred to as the DoubleD fiber due to its similarity to two D characters placed back to back. The material is a high purity silica with low OH, known as F 300 by glass manufacturers.
The lack of core and the high index of refraction n of this structure permits evanescent wave generation throughout its periphery for all angles of incidence below the critical angle θc, hence permitting the interaction with elements in its immediate vicinity.
3.1.2 FITC-APS Grafting
In order to have a sensing region on the probe, the surfaces of the DoubleD fiber is covalently grafted with the FITC-APS fluorophore. The silica substrate is placed in a piranha solution, a strong oxidizing reagent, for a period of 30 minutes. The reason behind this is two-fold; clean and remove any grease or debris on the surface while generating hydroxyl groups, hence activating the silica surface. The substrate is then rinsed, dried and placed in a 2% FITC-APS/ethanol solution for 3 hours. During this reaction time, the free hydroxyl groups and APS end of the fluorophore conjugate passively, hence generating a bond and releasing an H2O molecule in the process.
Figure 3.2: Overview of the covalent grafting process of the FITC-APS conjugate. Left: Optical fibe placed in piranha solution, bubble shows hydroxyl groups generated on the surface. Right: Optical fiber placed in 2% FITC-APS/Ethanol solution, bubble shows the
covalent bond generated between the APS of the fluorophore conjugate and the silica substrate.
Following the reaction, the fiber is rinsed with ethanol and dried. The detailed steps can be found in the detailed protocol in appendix A.2.
With this procedure, the DoubleD fiber is grafted with a monolayer of fluorescent particles on all surfaces in contact with the activator acid and the fluorescent conjugate.
3.1.3 Characterisation
The fluorescent layer is visualized by epifluorescence microscopy. Using the filterbox adjusted for FITC wavelengths, the fiber can be placed on the microscope stage and the fluorescent region verified throughout its length.
Figure 3.3: Epifluorescence microscopy image of the DoubleD fiber grafted with FITC. A clear transition can be noted between the regions of the fiber that were in contact with the
![Figure 1.1: Total internal reflection and Snell’s law visualized [19]](https://thumb-eu.123doks.com/thumbv2/123doknet/3394288.98327/23.918.263.658.659.929/figure-total-internal-reflection-snell-s-law-visualized.webp)

![Figure 1.8: Poynting vector of an metal nanoparticle irradiated with a plane wave corresponding to the plasmon frequency [51]](https://thumb-eu.123doks.com/thumbv2/123doknet/3394288.98327/31.918.327.588.638.858/figure-poynting-vector-nanoparticle-irradiated-corresponding-plasmon-frequency.webp)