O
pen
A
rchive
T
oulouse
A
rchive
O
uverte (
OATAO
)
OATAO is an open access repository that collects the work of Toulouse researchers and makes it freely available over the web where possible.
This is an author-deposited version published in: http://oatao.univ-toulouse.fr/ Eprints ID:
3850
To link to this article:
DOI: 10.1103/PhysRevB.79.195423
URL:
http://dx.doi.org/10.1103/PhysRevB.79.195423
To cite this version: Cambedouzou, J. and Chorro, M. and Almairac, R. and
Noé, L. and Flahaut, Emmanuel and Rols, S. and Monthioux, Marc and
Launois, P. ( 2009)
X-ray diffraction as a tool for the determination of the
structure of double-walled carbon nanotube batches. Physical Review B
(PRB), vol. 79 (
n° 19). ISSN 1098-0121
Any correspondence concerning this service should be sent to the repository administrator: staff-oatao@inp-toulouse.fr
nanotube batches
J. Cambedouzou,1,
*
M. Chorro,1R. Almairac,2L. Noé,3E. Flahaut,4S. Rols,5M. Monthioux,3and P. Launois11Laboratoire de Physique des Solides, Université Paris Sud XI, UMR CNRS 8502, F-91405 Orsay, France
2Laboratoire des Colloïdes, Verres et Nanomatériaux, Université Montpellier II, UMR CNRS 5587, F-34095 Montpellier, France 3Centre d’Elaboration de Matériaux et d’Etudes Structurales, Université Toulouse III, UPR CNRS 8011, F-31055 Toulouse, France
4CNRS; Institut Carnot Cirimat; F-31062 Toulouse, France 5Institut Laue Langevin, F-38042 Grenoble, France
共Received 16 January 2009; revised manuscript received 27 April 2009; published 20 May 2009兲
The average structure of double-walled carbon nanotube共DWCNT兲 samples can be determined by x-ray diffraction共XRD兲. We present a formalism that allows XRD patterns of DWCNTs to be simulated and we give researchers the tools needed to perform these calculations themselves. Simulations of XRD patterns within this formalism are compared to experimental data obtained on two different DWCNT samples, produced by chemi-cal vapor deposition or by peapod conversion共i.e., high-temperature peapod annealing兲. For each sample, we are able to determine structural aspects such as the number of walls, the diameter distribution of inner and outer tubes, the intertube spacing, and the bundled structure.
DOI:10.1103/PhysRevB.79.195423 PACS number共s兲: 61.46.Np
I. INTRODUCTION
Among the numerous carbon nanotube-based materials synthesized for the last 10 years, double-walled carbon nano-tubes 共DWCNTs兲 are certainly one of the most attractive, particularly due to their potential applications in the field of nanoelectronics. Cylindrical nanocapacitors1,2 and coaxial
nanocables3—possibly electronically tunable4—are two of
the most promoted uses of DWCNTs. In addition to these potential applications, DWCNTs are of high fundamental in-terest as they stand at the frontier between single-walled car-bon nanotubes共SWCNTs兲 and multiwalled carbon nanotubes 共MWCNTs兲 and they therefore can be considered as a model system to study wall to wall interactions5and frustration
ef-fects due to incommensurability between the atomic struc-ture of external and internal walls.6
In order to obtain DWCNTs, two major synthesis routes are known, namely, the “direct synthesis” route, using regu-lar carbon nanotubes synthesis methods such as catalytic chemical vapor deposition共CCVD兲 共Refs.7 and8兲 or elec-tric arc plasmas9and the “peapod conversion” route.3,10The
first route allows the direct catalyst-assisted synthesis of DWCNTs from the decomposition of carbonaceous gas pre-cursors 共CCVD兲 or the sublimation of graphite anodes 共arc discharge兲. Specifically, the CCVD method is suited to large-scale synthesis7 and is therefore very promising for the
de-velopment of applications involving DWCNTs. The second route is less direct since it involves a first stage of fullerene intercalation inside single-walled carbon nanotubes11,12to an
intercalation rate as high as possible and then heating the so-called peapods to a temperature of 1000– 1300 ° C. Given the important difference between the two ways of synthesiz-ing DWCNTs, it would not be surprissynthesiz-ing to observe differ-ences between the structures of DWCNTs coming from dif-ferent direct routes or from the peapod conversion route.
Transmission electron microscopy 共TEM兲 observations have demonstrated that, depending on the synthesis condi-tions, CCVD-produced DWCNTs can remain mainly isolated
or occasionally form small bundles where tubes are heterogeneous.7 In some exceptional cases, DWCNTs
as-sembled in bundles can even have the same helicities, as was shown using electron-diffraction technique.13 In this paper,
we will focus on samples made as described in Ref.7when we refer to CCVD-produced samples. The analysis of about 100 nanotubes observed by TEM shows that tubes are iso-lated, with a diameter distribution, centered around 20 Å for the external tube, which is very large 关full width at half maximum 共FWHM兲=12 Å兴. At the opposite, peapods con-version leads to the formation of DWCNTs with a narrow diameter distribution共FWHM=2 Å兲 centered around 14 Å for the external tube and these DWCNTs are assembled in large bundles.3 Pairs of tubes in DWCNTs can also be
evi-denced through Raman radial breathing mode 共RBM兲 frequencies.1,2,8,14However, this technique is not
straightfor-ward for giving a quantitative characterization of a sample due to resonance effects, which make a large number of nanotubes invisible in the Raman response of a sample. Moreover, the penetration depth of visible lasers into nano-tubes is too low to allow a global characterization of a mac-roscopic sample.
In order to get a statistically relevant image of a DWCNT sample, x-ray diffraction 共XRD兲 appears as an interesting method since it can probe milligram-scale samples, without any specific selection between carbon nanotubes in the sample. This technique has already been used in order to follow the peapods conversion into DWCNTs,15,16 but the
calculations of diffraction patterns were not fully rigorous as ad hoc Gaussian and Lorentzian functions were used to simulate Bragg peaks. Such an approximation, which can only be used when diffraction peaks are rather well defined, that is for large bundles of nanotubes with a narrow diameter distribution does not apply to other physical cases corre-sponding to unbundled DWCNTs 共or bundles of small size兲 and/or to wide diameter distribution within the sample. We intend giving here detailed indications on how diffraction should be treated to obtain an accurate description of
DWCNT samples, from CCVD samples consisting of DWCNT with many different diameters to those resulting from peapods conversion, which have already been studied using x-ray scattering15,16 and correspond to the “simplest”
case with relatively well-defined diffraction peaks. We intend to give experimentalists readily usable tools to perform fast characterizations of their DWCNT samples, whatever their structural characteristics. In the first part, we will describe how simulations of diffraction patterns can be performed in order to fully understand experimental diffraction profiles of DWCNT samples from CCVD and peapods conversion. In the second part, we will illustrate the application of the cal-culations developed in the first part on samples of DWCNTs synthesized by both routes.
II. RESULTS AND DISCUSSION A. Calculations
1. Isolated nanotubes
The formalism we use in our calculations is derived from that initially developed by Thess et al.,17involving
homoge-neous cylinders with a constant surface density of scatterers, and then further improved to better adapt to the case of single-walled carbon nanotubes18and peapods.19,20With the information on the relative position of carbon atoms consti-tutive of nanotubes’ walls being lost, the hypothesis of ho-mogeneous scattering surfaces limits the relevance of our calculations to scattering vectors Q with modulus lower than 2.5 Å−1. The diffraction profile of a powdered sample is given by the square of the Fourier transform of the spatial configuration of scattering surfaces of the nanotubes, for all relative orientations between the nanotubes and the scatter-ing vector. Calculations are performed usscatter-ing a homemade program.
Let us first consider a powder of identical individual DWCNTs, having an inner diameter Diand an outer diameter Do. It can easily be shown, following, e.g., the formalism
developed in Appendix A in Ref.19or in Ref. 21, that the scattering intensity IDWof a single DWCNT may be written
as IDW共Qជ兲 ⬀
再
fc共Q兲冋
DiJ0冉
QDi 2冊
+ DoJ0冉
QDo 2冊
册
冎
2 ␦共Qz兲, 共1兲 where represents the surface density of scatterers on a nanotube wall 共⬃0.38 atom/Å2兲, fc is the carbon form
factor for x rays, J0is the cylindrical Bessel function of order
zero,␦is the Dirac distribution, and Qzis the component of
the wave vector along the tube axis. The intensity of a pow-der of such an object is given by
I共Q兲 ⬀
冕冕
IDW共Qជ兲d2SQ
4Q2 , 共2兲
where the integration is performed over the sphere of radius Q and d2S
Qis a surface element of this sphere. It leads to the
following expression: I共Q兲 ⬀ 2f c 2 2Q
冋
DiJ0冉
QDi 2冊
+ DoJ0冉
QDo 2冊
册
2 . 共3兲The result of this calculation can be seen in Fig. 1 for a DWCNT with Di= 13.2 Å and Do= Di+ 2dR = 13.2+ 2⫻3.4
= 20 Å, with dR being the van der Waals distance between the inner and the outer tubes. The mean diameter of the tube, defined as Dm=共Di+ Do兲/2, is equal to 16.6 Å. The scattered
intensity consists of oscillations within an envelope function 共see below兲, with the latter being minimum around 0.9 and 2.8 Å−1.
The origin of the modulation of the oscillations can be deduced from the observation of the terms Ti= DiJ0共
QDi
2 兲 and
To= DoJ0共QDo
2 兲, respectively, related to the inner and the outer
tube and involved in the calculation of the scattered intensity. One observes in Fig.1that the period of the Bessel function corresponding to the tube of the smallest diameter is larger than that of the largest nanotube. In the area where the os-cillations are out of phase 共e.g., between 0.7 and 1.1 Å−1兲, the intensity resulting from the squared modulus of 共Ti+ To兲 is minimum and it is maximum where the oscillations are in phase 共e.g., between 1.6 and 2.3 Å−1兲.
Figure2illustrates the effects of changing the inner- and outer-tube diameters keeping the intertube distance dR equal to 3.4 Å. When the mean diameter of the DWCNT is in-creased, the oscillation period decreases in good agreement with the behavior of the zero-order Bessel function associ-ated with each wall共see Fig.1兲. However, it is interesting to remark that the shape of the envelope function appears un-changed: the positions of the minima and maxima of the envelope function depend only on the distance dR between the walls. It has indeed been shown in the former paragraph that it was directed by interferences between the Bessel func-tions associated with each nanotube wall.
Figure3shows how the diffracted intensity evolves when dR is varied between 3 and 3.8 Å, keeping the mean diam-eter constant. The positions of the zeros of the oscillations are unchanged: they thus depend on the value of the mean
FIG. 1.共Color online兲 Plain line: calculated intensity of a pow-der of isolated DWCNTs with Di= 13.2 Å and Do= 20 Å 共Dm
= 16.6 Å and dR = 3.4 Å兲. Dotted line: envelope function. Dashed line: calculation of the Titerm involved in the intensity scattered by
the inner tube. Dashed-dotted line: calculation of the Toterm
in-volved in the intensity scattered by the outer tube.
diameter of the tube. At the opposite, the positions of the zeros and of the second maximum of the envelope curve are clearly shifted toward the lower Q values when the interwall distance dR is increased.
The analytical description of this envelope curve can be achieved by considering the asymptotical development of the J0Bessel function,22 J0共x兲 ⬇
冑
2 xcos冉
x − 4冊
. 共4兲This approximation is valid for x⬎0.9, i.e., QR⬎0.9. These conditions are respected while tubes with a radius larger than 3 Å are considered for Q values greater than 0.3 Å−1. Within this approximation, the intensity of a powder of iso-lated DWCNTs may be written from Eq.共3兲 as
I共Q兲 ⬀2 2f c 2 Q2
冋
冑
Dicos冉
QDi 2 − 4冊
+冑
Docos冉
QDo 2 − 4冊
册
2 . 共5兲 One derives from the above expression the following one, using classical trigonometric relations and limiteddevelop-ments to the order 2 of the function
冑
1 −共dDRm兲
2 that appears
in the analytical development,
I共Q兲 ⬀2 2f c 2D m Q2
再
4 cos 2冉
QDm 2 − 4冊
cos 2冉
QdR 2冊
− dR Dm sin冉
QDm− 2冊
sin共QdR兲 − dR 2 2Dm2冋
cos冉
QDm− 2冊
+ cos共QdR兲册
冎
. 共6兲 This expression contains three terms that are separately plot-ted in Fig. 4 in the case of two powders of DWCNTs with Dm= 11.4 and 23.4 Å 共Di= 8 and 20 Å兲, respectively, anddR = 3.4 Å in both cases. It allows explaining analytically all the features of the intensity calculated for a powder of DWCNTs.
In Fig. 4 inset, a comparison between intensities calcu-lated from Eqs. 共3兲 and 共6兲 shows that the limited develop-ment to the order 2 in dR/Dmis a good approximation, even
for relatively small diameters. It is also obvious in Fig.4that the most important term in Eq.共6兲 is the first one; the other terms are negligible above 1 Å−1. This first term contains a
periodic function of period 2/Dm, which is actually the
period of the short oscillations. On one hand, this period is independent on the interwall distance dR but is related to the mean diameter of DWCNTs Dm, which is in good agreement
with our previous results. On the other hand, the first term is modulated by an envelope function defined as Fenv共Q兲
= 82fc2Dm
Q2cos
2共QdR
2兲, which only depends on the intertube
spacing and which reaches zero for Q =/dR then Q = 3/dR. For dR=3.4 Å, these values are 0.92 and 2.78 Å−1, respectively. They were indeed found above to be independent of the DWCNT mean diameter and to depend only on the dR interwall spacing.
FIG. 2. 共Color online兲 Calculated intensity of a powder of iso-lated DWCNTs with an interwall distance dR of 3.4 Å and inner-tube diameters of共from bottom to top兲 8, 12, 16, and 20 Å. Curves are translated vertically for clarity and their envelope functions are drawn. Inset: magnification of the关0.8–2.6 Å−1兴 range.
FIG. 3. 共Color online兲 Calculated intensity of a powder of iso-lated DWCNTs with a mean diameter of 16.6 Å and with interwall distances dR of共from bottom to top兲 3, 3.2, 3.4, 3.6, and 3.8 Å. Curves are translated vertically for clarity and their envelope func-tions are drawn. Dotted lines are guide to the eyes.
FIG. 4. 共Color online兲 Calculated intensity of a powder of iso-lated DWCNTs with an interwall distance dR of 3.4 Å and inner-tube diameters of 8 and 20 Å, for the bottom and upper curves, respectively. Curves are translated vertically for clarity. Crosses: first term of Eq.共6兲, dashed line: second term, and dotted line: third
term. Inset: calculated intensities of the same powders using Eq.共3兲
It must be emphasized that the study of this envelope curve presents a strong interest in the perspective of fitting experimental diffraction patterns from real samples. Indeed, the period of the narrow oscillations from DWCNTs changes depending on the DWCNT diameter. If a sample presents a large diameter distribution, it will not be possible to distin-guish these oscillations anymore since there will be a merg-ing of the signal from each DWCNT. As a result, the only remaining feature in the diffraction pattern will be the enve-lope curve, which is the same for all nanotube diameters. Consequently, the envelope curves can roughly be consid-ered as the diffraction signal of a sample presenting a wide tube diameter distribution.
In the following, we focus on how the diffraction pattern evolves when tubes containing N = 3, 4, or 5 walls are con-sidered. Let us postulate that these MWCNTs are constituted by coaxial nanotubes with a fixed interwall spacing dR. The diameter of the nth tube writes Dn= Di+ 2共n−1兲dR, where n
goes from 1 to N, and the diffracted intensity, in the limits of the asymptotic development of J0 Bessel functions, is
pro-portional to I共Q兲 ⬀ Dm
冋
cos冉
QDi 2 − 4冊
+ ¯ + cos冉
QDN 2 − 4冊
册
2 , 共7兲 where Dm is still the mean diameter关Dm=共D1+ DN兲/2兴. Theabove calculations for DWCNTs allowed us to show that the most important term in Eq.共6兲 corresponds to the develop-ment of order zero in dR/Dm, so we have restricted the
cal-culations to this term. The sum of cosine functions may also be written as cos共QDm 2 − 4兲关sin共 NQdR 2 兲/sin共 QdR 2 兲兴 and therefore
we can write the intensity of a powder of small MWCNTs renormalized to the number N of walls共with N=2, 3, 4, or 5兲 as I共Q兲 ⬀ 2f c 2D m Q2 cos 2
冉
QDm 2 − 4冊
1 N冤
sin冉
NQdR 2冊
sin冉
QdR 2冊
冥
2 . 共8兲We show in Fig.5the envelope curves of MWCNT given by the formula
共fc
2D
m/Q2N兲关sin共NQdR/2兲/sin共QdR/2兲兴2. 共9兲
When the number of walls is increased, two remarkable ef-fects must be pointed out in the calculated diffraction pattern of MWCNTs.共i兲 The position of the maximum of the most intense oscillation between 1 and 2 Å−1 shifts from about
1.56 Å−1for N = 2共DWCNTs兲 to 1.85 Å−1. This latter
posi-tion corresponds to that of the Bragg reflecposi-tion on the兵001其 planes of turbostratic graphite or of classical MWCNTs 共Q =2dR兲. 共ii兲 The width of this maximum sharpens. We plotted the position of the maximum and the FWHM of this feature versus the number of walls in Fig. 6. At first sight, the FWHM of the diffraction feature located around 1.8 Å−1
fol-lows a 1/N dependence, in agreement with what is expected from the Scherrer law.23 This result, observed after having
fitted the curves calculated from Eq.共9兲, can also be derived
analytically since, around Q =2dR, for large N values, one gets
冤
sin冉
NQdR 2冊
sin冉
QdR 2冊
冥
2 ⬇ N2exp冢
− N2冉
QdR 2 −冊
2 冣
,which is a Gaussian function with FWHM=2冑 ln 2N , as plot-ted in Fig.6.
2. Bundled nanotubes
Depending on the synthesis process, DWCNTs may be produced in isolated form or they may be found into bundles of variable size. In this part, we calculate the diffraction pat-tern of bundled DWCNTs as they can be found following the peapod conversion route and we determine the origin of the main features observed in this diffraction profile.
Calculations of the diffraction pattern of bundled DWCNTs powders can be achieved using the formalism shown in the previous paragraph, including a lattice term
FIG. 5. 共Color online兲 Calculated envelope curves 共see text for details兲 of diffraction patterns of powders of isolated MWCNTs with N = 2, 3, 4, and 5 walls; inner diameter is 13.2 Å and intertube spacing is 3.4 Å.
FIG. 6.共Color online兲 Open circles: full width at half maximum of the diffraction feature at Q⬃1.8 Å−1as a function of the number
of walls of MWCNTs. Solid line: calculation of the width using the analytical expression coming from the development of the envelope curve into a Gaussian function 共FWHM=2冑 ln 2N 兲. Full triangles: position of the peak maximum; dashed line corresponds to Q =2dR.
consisting in a sum over all the constitutive tubes of a bundle. The expression of the intensity diffracted by a pow-der of SWCNT bundles may be written as17–19
I共Q兲 ⬀ 2f c 2 Q
兺
i,j Nt J0共QRi,j兲冋
DoJ0冉
QDo 2冊
册
2 , 共10兲 where Ntis the number of tubes forming the bundle and Ri,jis the distance between tube i and tube j in the plane perpen-dicular to the bundle axis. The intensity diffracted by a pow-der of DWCNT bundles becomes
I共Q兲 ⬀ 2f c 2 Q
兺
i,j Nt J0共QRi,j兲冋
DiJ0冉
QDi 2冊
+ DoJ0冉
QDo 2冊
册
2 . 共11兲 The upper part of Fig. 7 depicts the calculated diffraction profile of a powder of bundles made of 19 SWCNTs 共i.e., two shells of nanotubes around a central one, giving an av-erage bundle diameter of 70 Å兲, having a radius of 6.8 Å, and an intertube distance avdWof 3.2 Å, and that of apow-der of bundles made of 19 DWCNTs, having an outer radius Ro of 6.8 Å and an intertube distance of 3.2 Å. Both
DWCNT and SWCNT bundles have the same external di-mensions, as represented on the picture in Fig. 7. Their dif-fraction patterns not only show similarities but also strong differences. The diffraction pattern of SWCNT bundles can be described as the association of the carbon nanotube form factor, mainly given by the oscillations of a J0Bessel
func-tion, and the Bragg reflections from the two-dimensional 共2D兲 hexagonal lattice of the nanotubes in bundles.17,18The
most intense peak in the calculated diffraction pattern is the 10 reflection located at⬃0.4 Å−1and at higher Q values the 11, 20, 21, and 22+ 31 reflection can be observed at 0.75, 0.9, 1.1, and 1.5 Å−1, respectively. In the case of DWCNT
bundles, the 11 and 22+ 31 peaks are still clearly observable, at about the same position than for SWCNTs. This is ex-pected since the crystalline lattice and the lattice parameter of DWCNTs are the same than in the case of SWCNTs. However, some reflections have disappeared, the most spec-tacular extinction being that on the共10兲 planes.
It was demonstrated in previous studies that the filling of bundled nanotubes with diameter around 14 Å by a variety of materials such as gas,24 inorganic compounds,25,26 and
carbonaceous materials such as C60 in peapods19 can
dra-matically affect the intensity and the position of the 10 re-flection. The same phenomenon occurs for DWCNTs. It is due to the difference between the terms TSW2 and TDW2 , re-spectively, associated with single- and double-walled nano-tubes, as shown in Fig. 7. Note that the changes in these terms versus Q also imply, for the considered tubes of exter-nal diameter around 14 Å, a strong diminution of the 21 reflection intensity.
The conversion of peapods into DWCNTs always results in “incomplete” DWCNTs with shorter inner tubes compared to outer ones. As a consequence and similarly to the case of C60peapods, calculations of XRD patterns of DWCNTs with
shorter inner tubes would result in the reappearance of the 10 and 21 peaks. The scattered intensity may be written as
I共Q兲 ⬀ 2f c 2 Q
兺
i,j Nt J0共QRi,j兲冋
␣DiJ0冉
QDi 2冊
+ DoJ0冉
QDo 2冊
册
2 , 共12兲 where␣ is the ratio between the lengths of the internal and external tubes共for conversion from C60peapods, with fillingrate p and interfullerene distance L = 9.8 Å, one finds, as-suming conservation of the number of atoms inside the outer tube, ␣=D60p
iL兲. It is important to take this factor into
ac-count because the conversion of peapods into DWCNTs al-ways results in this kind of incomplete DWCNTs.
Our calculations therefore demonstrate that the XRD pat-tern of bundled DWCNTs show “accidental” extinctions of some Bragg peaks characteristic of the 2D hexagonal lattice of bundles, which must be carefully analyzed by simulating the XRD patterns in order to derive relevant structural char-acterization of bundled DWCNT samples.
FIG. 7. Upper part: calculated diffraction patterns of a bundle of 19 SWCNTs of diameter 13.6 Å, with an intertube spacing avdW = 3.2 Å and of a bundle of 19 DWCNTs, with outer diameter Do = 13.6 Å, an interwall distance dR of 3.4 Å, and an inter-DWCNT spacing avdWof 3.2 Å. Lower part: calculations of the square of the
term TSW= D0J0共QD0
2 兲 共top兲 and of the square of the term TDW
= DiJ0共 QDi
2 兲+D0J0共 QD0
2 兲, respectively, involved in the calculation of
the intensity scattered by a powder of SWCNTs and of DWCNTs. The vertical lines indicate the theoretical position of the Bragg peaks expected for the lattice of nanotubes in a bundle.
B. Experiments
In this part, we use the analytical expressions detailed above to obtain a description of real DWCNT samples, syn-thesized by CCVD or peapod conversion.
1. Sample synthesis
CCVD-produced samples7were synthesized using
MgO-based catalysts prepared by combustion synthesis. The cata-lyst was reduced in a H2-CH4mixture共18 mol % CH4,
heat-ing and coolheat-ing rates of 5 ° C/min, maximum temperature of 1000 ° C, and no dwell兲, resulting in a dense mat of DWCNT composite powder. Catalyst dissolution was achieved by ad-dition of HCl, followed by extensive washing with de-ionized water. TEM observations and infrared-absorption spectroscopy analyses7,27have shown that no amorphous
car-bon could be found in significant quantity in this sample. Checking the absence of amorphous carbon by-products by different methods prior to the XRD analysis of DWCNT samples is of major importance since amorphous carbon gives a large peak around 1.6 Å−1. Such a peak would
seri-ously complicate the determination of the number of walls of the tubes in the sample.
The starting materials for DWCNTs prepared from the peapods conversion route are arc-discharge SWCNT pow-ders from Nanocarblab, Incorporated. The powder was sub-jected to a purification procedure which included an oxidiz-ing thermal treatment, a nitric acid treatment, and a 800 ° C annealing in inert atmosphere. The powder contains⬃30% of nontubular carbon nanophases, which have withstood the purification procedure. The latter has resulted in the opening of the nanotubes. The final annealing temperature共800 °C兲 is high enough to eliminate adsorbed organic impurities and sufficiently low to prevent the closure of the nanotubes. First we prepared C60peapods following the vapor filling method
whose principle was initially proposed in Ref.3. Basically, we sublimed C60powder in excess at 450 ° C in the presence
of the opened SWCNTs in sealed quartz tubes, and main-tained it for 24 h. After the synthesis, peapods were heated up at 1300 ° C during 48 h in dynamic vacuum to transform C60 peapods into DWCNTs. The remaining 共i.e., free兲 C60
molecules which had not entered the SWCNTs during the filling process were removed during the heating ramp up to 1300 ° C.
XRD experiments were performed using the K␣emission of a Cu rotating anode 共=1.5418 Å兲 at room temperature and recorded on an image plate. The signal/background ratio was improved using a sample holder made of a 10-m-thick aluminum foil instead of a glass capillary, whose amorphous signal around 1.5 Å−1would be very disturbing when
study-ing the DWCNT signal. This aluminum sample holder does not give additional signal in the Q range of the study from 0.3 to 2.5 Å−1. Moreover experiments are done under
vacuum to eliminate the diffuse scattering of air.
2. Comparison between experimental and theoretical patterns Figure 8 shows a comparison between an experimental XRD pattern of CCVD-produced DWCNTs and the result of our diffraction pattern calculation. Note that the calculations
were performed in agreement with the formula we presented above and that two experimental factors that should be taken into account for a direct comparison with experimental data have been added to the formula: 共i兲 a geometrical factor G共兲=cos3共2兲 taking into account the detection on the
pla-nar geometry of an imaging plate and 共ii兲 the polarization factor P共兲=1+fm共兲cos2共2兲
2 , where fm共兲⬃1 and depends on
the monochromator.
The comparison between our simulations and the experi-mental diffraction profiles is made on the basis of profile matching, without the use of the reliability factor共R factor兲 commonly used in powder-diffraction pattern fitting. The reason for that is that the diffraction features to be considered are very low in intensity with regard to the background; moreover, they are rather large. The R factor would therefore become overdependent on the background correction, con-siderably limiting its relevance. In fact, Rietveld analysis of a SWCNT sample has only been published by one team,28for
samples formed of large bundles of SWCNT with a narrow diameter distribution, corresponding to an optimal case. Even in this case, it did not give more information than qualitative comparison of profile matching. We have at-tempted to perform reliability factor minimization and we reached the same conclusion.
In order to perform the calculations, we started from the diameter distributions estimated by a semiquantitative study performed by TEM observations on⬃100 tubes.7The mean
diameter of the inner tubes was found to be of⬃13 Å, with a very large diameter distribution showing a FWHM of 12 Å.29 The intertube spacing is estimated to be 3.4 Å. A
tentative composition of the sample was also deduced from
FIG. 8.共Color online兲 Plain circles: XRD pattern of a sample of CCVD-produced DWCNTs. Plain line: calculation involving a mix-ture of SWCNTs, DWCNTs, and MWCNTs with proportions esti-mated from TEM 共see text for details兲. Dashed line: calculation featuring isolated DWCNTs and MWCNTs giving the best agree-ment with the experiagree-mental profile 共see text for detail兲. Dashed-dotted line: calculation featuring bundles of 19 DWCNTs and iso-lated MWCNTs giving the best agreement with the experimental profile共see text for details兲. Inset: calculation of the XRD pattern of pure DWCNT with a mean radius of 7 Å, a radii distribution of FWHM= 6 Å, and dR = 3.4 Å with isolated DWCNTs共plain line兲, bundles of 7 DWCNTs共dashed line兲, and bundles of 19 DWCNTs 共dotted line兲.
TEM experiments, featuring 18% of SWCNTs, 77% of DWCNTs, and 5% of triple-walled carbon nanotubes 共3WCNTs兲. Figure8shows the calculated diffraction pattern of a sample featuring such a composition共bottom plain line兲. A comparison with the experimental pattern shows that the calculated profile presents a large feature around 1.6 Å−1, in
poor agreement with the experimental data. The excessive width of this first attempt seems due to an overestimation of the proportion of DWCNTs in the sample since the shape of DWCNTs is similar to that of the fitting curve. A more sat-isfying profile for the fitting curve would imply a stronger proportion of tubes with a larger number of walls, 3WCNTs, tetrawalled carbon nanotubes 共4WCNTs兲, and pentawalled carbon nanotubes 共5WCNTs兲, in order to sharpen the peak and to shift it to its experimental value around 1.8 Å−1. It
has to be noted that the proportion of SWCNTs is very hard to determine from experimental data. The diffraction signal from SWCNTs is indeed mostly concentrated below Q = 1 Å−1, where signals mainly coming from sample porosity superimpose with that of SWCNTs, rendering the estimation of SWCNT amount very imprecise. In consequence, we fo-cused on the fit of the large feature around 1.8 Å−1to
esti-mate the proportion of MWCNT populations. The dashed curve in Fig.8 shows a fit which gives a better agreement with the experimental profile. It involves DWCNTs of same dimension than that considered in previous calculations, but the proportions of MWCNT populations are modified as fol-lows: 70% DWCNTs, 20% 3WCNTs, 5% 4WCNTs, and 5% 5WCNTs. The dashed-dotted line in Fig.8displays the result of another calculation featuring bundled DWCNTs. The rea-son for this hypothesis is that bundled DWCNTs were some-times observed using TEM.7The inset in Fig.8shows that as
soon as bundled DWCNTs are considered, and that the DWCNT diameter distribution remains large, the width of the feature at 1.8 Å−1is slightly decreased and its position is
shifted to higher Q values.30 In consequence, the amount of
DWCNTs could be maximized when fitting the feature at 1.8 Å−1with bundled DWCNTs. In our calculations, a good agreement was found at the cost of a slight modification of MWCNT proportions: 80% DWCNTs, 10% 3WCNTs, 5% 4WCNTs, and 5% 5WCNTs. Taking into account this small variation depending of the aggregation state of the nano-tubes, and the changes observed in our different attempts to fit the data, we estimate the error in our determination of the MWCNT proportions to be of about 10%. The simulation of XRD profiles therefore allowed a valuable description of the sample at the macroscopic scale to be given and appears fully complementary to local-scale investigations such as those using TEM or other local probes.
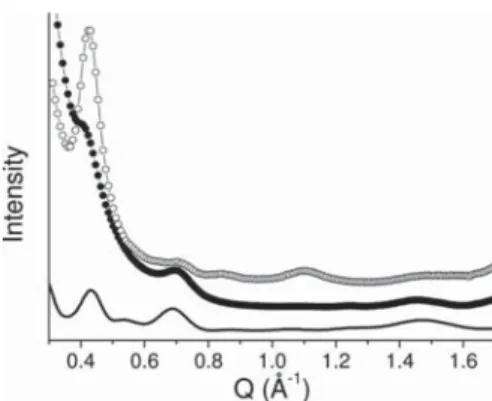
Figure9shows the experimental diffraction diagram of a DWCNT sample from the peapods conversion route. This diffraction pattern is dramatically different from that of samples synthesized by CCVD methods. The observation of peaks located at 0.4, 0.75, and 1.45 Å−1 strongly suggests that the DWCNTs are stacked into bundles 共see Fig.7兲 and present a quite narrow diameter distribution. We present in Fig.9the result of a calculation in good agreement with the experimental diffraction profile, involving outer tubes of mean radius 7.1 Å, with a distribution of 1 Å FWHM. All
tubes are packed into 19-tube bundles, which correspond to an average bundle diameter of 70 Å, and they are separated by a distance of 3.2 Å. These parameters are derived from the diffraction pattern of nanotubes precursors. As in Ref.15, the inner-tube radius in the peapod-derived DWCNTs is cho-sen equal to that of the external tube minus 3.6 Å, which is the van der Waals distance at the high temperature corre-sponding to the inner-tube formation. The calculation is made on the basis of an initial peapod sample filled at 80% with C60 molecules. According to the diameter of the inner
tube and to the filling rate at the sample scale, the average ratio ␣ of inner-tube length over outer-tube length in final DWCNTs is⬃0.6. The good agreement between the experi-mental data and the calculations illustrates the validity of the model presented here to describe also DWCNT samples formed of large bundles of nanotubes with well-defined di-ameters. It is in agreement with the results of the authors of Refs. 15 and 16 who used an approximation of the model valid in this case.
The XRD investigation of these two DWCNT samples originating from different synthesis routes points out large differences in their structures. CCVD-produced DWCNTs that grow directly on catalytic substrates present a rather dis-ordered structure and contain other types of tubes than DWCNTs. They contain tubes presenting a large diameter distribution. On the contrary, DWCNTs from peapod conver-sion are well ordered in large bundles, with a narrow diam-eter distribution, but the incomplete filling of nanotubes by C60 leads to internal tubes shorter than the external ones.
III. CONCLUSION
In the first part of this study, we detailed the formalism allowing the calculation of the powder-diffraction pattern of DWCNTs. We gave an analytical description of the main features appearing in the diffraction pattern of isolated DWCNTs and we further studied the way these features evolve with the main structural parameters of DWCNTs 共tubes radii and intertube spacing兲. We then considered the
FIG. 9. Open circles: experimental diffraction pattern of the reference SWCNT sample for peapod synthesis. Filled circles: ex-perimental diffraction pattern of the DWCNT sample from peapod conversion. Plain line: calculation of the diffraction pattern of DWCNTs giving a good fit with the experimental data共see text for details兲.
diffraction pattern of bundles of DWCNTs and we gave an explanation for the accidental extinction of some of the Bragg peaks relative to the structure of the tubes forming bundles.
In the second part of this study, we compared experimen-tal diffraction patterns of DWCNT samples originating from two different routes: CCVD and peapod conversion. We managed to fit the experimental profile in both cases,
exem-plifying the general use that can be made of the structural model.
Through these detailed calculations and these examples, we gave to experimentalists concerned with the characteriza-tion of macroscopic amounts of DWCNT samples all the tools necessary to take advantage of XRD for a global deter-mination of the composition and structure of their nanotube samples.
*Corresponding author. FAX:⫹331 69 15 60 86; cambedouzou@lps.u-psud.fr
1G. Chen, S. Bandow, E. R. Margine, C. Nisoli, A. N.
Kolmog-orov, V. H. Crespi, R. Gupta, G. U. Sumanasekera, S. Iijima, and P. C. Eklund, Phys. Rev. Lett. 90, 257403共2003兲.
2J. Cambedouzou, J.-L. Sauvajol, A. Rahmani, E. Flahaut, A.
Peigney, and C. Laurent, Phys. Rev. B 69, 235422共2004兲.
3B. W. Smith and D. E. Luzzi, Chem. Phys. Lett. 321, 169
共2000兲.
4A. G. Souza Filho, V. Meunier, M. Terrones, B. G. Sumpter, E.
B. Barros, F. Villalpando-Páez, J. Mendes Filho, Y. A. Kim, H. Muramatsu, T. Hayashi, M. Endo, and M. S. Dresselhaus, Nano Lett. 7, 2383共2007兲.
5R. Saito, R. Matsuo, T. Kimura, G. Dresselhaus, and M. S.
Dresselhaus, Chem. Phys. Lett. 348, 187共2001兲.
6A. Hashimoto, K. Suenaga, K. Urita, T. Shimada, T. Sugai, S.
Bandow, H. Shinohara, and S. Iijima, Phys. Rev. Lett. 94, 045504共2005兲.
7E. Flahaut, R. Bacsa, A. Peigney, and C. Laurent, Chem.
Com-mun.共Cambridge兲 2003, 1442.
8M. Endo, H. Muramatsu, T. Hayashi, Y. A. Kim, M. Terrones,
and M. S. Dresselhaus, Nature共London兲 433, 476 共2005兲.
9J. L. Hutchison, N. A. Kiselev, E. P. Krinichnaya, A. V.
Kresti-nin, R. O. Loutfy, A. P. Morawsky, V. E. Muradyan, E. D. Obraztsova, J. Sloan, S. V. Terekhov, and D. N. Zakharov, Car-bon 39, 761共2001兲.
10S. Bandow, M. Takizawa, K. Hirahara, M. Yudasaka, and S.
Iijima, Chem. Phys. Lett. 337, 48共2001兲.
11B. W. Smith, M. Monthioux, and D. E. Luzzi, Nature共London兲
396, 323共1998兲.
12M. Monthioux, E. Flahaut, and J.-P. Cleuziou, J. Mater. Res. 21,
2774共2006兲.
13J.-F. Colomer, L. Henrard, P. Launois, G. Van Tendeloo, A. A.
Lucas, and Ph. Lambin, Phys. Rev. B 70, 075408共2004兲.
14R. Pfeiffer, F. Simon, H. Kuzmany, and V. N. Popov, Phys. Rev.
B 72, 161404共R兲 共2005兲.
15M. Abe, H. Kataura, H. Kira, T. Kodama, S. Suzuki, Y. Achiba,
K. I. Kato, M. Takata, A. Fujiwara, K. Matsuda, and Y. Maniwa, Phys. Rev. B 68, 041405共R兲 共2003兲.
16R. Pfeiffer, M. Holzweber, H. Peterlik, H. Kuzmany, Z. Liu, K.
Suenaga, and H. Kataura, Nano Lett. 7, 2428共2007兲.
17A. Thess, R. Lee, P. Nikolaev, H. Dai, P. Petit, J. Robert, C. Xu,
Y. H. Lee, S. G. Kim, A. G. Rinzler, D. T. Colbert, G. E. Scu-seria, D. Tománek, J. E. Fischer, and R. E. Smalley, Science
273, 483共1996兲.
18S. Rols, R. Almairac, L. Henrard, E. Anglaret, and J.-L.
Sauva-jol, Eur. Phys. J. B 10, 263共1999兲.
19J. Cambedouzou, V. Pichot, S. Rols, P. Launois, P. Petit, R.
Kle-ment, H. Kataura, and R. Almairac, Eur. Phys. J. B 42, 31 共2004兲.
20M. Chorro, A. Delhey, L. Noé, M. Monthioux, and P. Launois,
Phys. Rev. B 75, 035416共2007兲.
21J.-F. Colomer, L. Henrard, E. Flahaut, G. Van Tendeloo, A. A.
Lucas, and Ph. Lambin, Nano Lett. 3, 685共2003兲.
22M. Kociak, K. Hirahara, K. Suenaga, and S. Iijima, Eur. Phys. J.
B 32, 457共2003兲.
23B. E. Warren, X-Ray Diffraction共Dover Publications, New York,
1990兲.
24S. Rols, M. R. Johnson, P. Zeppenfeld, M. Bienfait, O. E.
Vilches, and J. Schneble, Phys. Rev. B 71, 155411共2005兲.
25N. Bendiab, R. Almairac, S. Rols, R. Aznar, J.-L. Sauvajol, and
I. Mirebeau, Phys. Rev. B 69, 195415共2004兲.
26J. Cambedouzou, S. Rols, N. Bendiab, R. Almairac, J.-L.
Sauva-jol, P. Petit, C. Mathis, I. Mirebeau, and M. Johnson, Phys. Rev. B 72, 041404共R兲 共2005兲.
27J.-L. Bantignies, J.-L. Sauvajol, A. Rahmani, and E. Flahaut,
Phys. Rev. B 74, 195425共2006兲.
28H. Kadowaki, A. Nishiyama, K. Matsuda, Y. Maniwa, S. Suzuki,
Y. Achiba, and H. Kataura, J. Phys. Soc. Jpn. 74, 2990共2005兲.
29In order not to consider inner tubes with a too small diameter, we
did not take into account tubes of diameter smaller than 3 Å.
30Calculated diffraction patterns of bundled MWCNTs with more
than two walls did not show any significant differences from that of isolated MWCNTs.