Université de Montréal
Les valeurs anthropométriques ; mesures prédictives du
risque cardio-métabolique et du syndrome métabolique au
Kenya
par Fannie Lajeunesse-Trempe
Département des sciences biomédicales Faculté de médecine
Mémoire présenté
en vue de l’obtention du grade de Md-Msc en sciences biomédicales
option médecine expérimentale
Résumé
Introduction : La prévalence mondiale des maladies cardiovasculaires et métaboliques (MCM)
ainsi que du Syndrome métabolique (SM) est en constante augmentation, et ce plus drastiquement dans les pays en voie de développement. L’accumulation de gras corporel, communément estimé par des mesures anthropométriques, a été associé au SM et à un risque accru de développer des MCM. Cette relation demeure toutefois très peu étudiée parmi les populations de pays d’Afrique sub-Saharienne.
Objectif : L’objectif de cette étude était d’évaluer l’association entre les mesures
anthropométriques et les facteurs de risque de MCM, en plus du SM, parmi des populations adultes rurales et urbaines du Kenya.
Méthodologie : Cette étude transversale comprenait 1401 participants de milieux ruraux et
urbains. Les valeurs anthropométriques ont été mesurées, incluant le poids corporel, l’indice de masse corporelle (IMC), la circonférence abdominale (CA), le gras abdominal viscéral (VAT), le gras abdominal sous cutané (SAT) et le ratio de ces deux valeurs (VAT/SAT). Des valeurs de glycémies (à jeun, 2 heures post glucose), d’insuline et de lipides plasmatiques (Triglycérides, LDL-C, HDL-C, cholestérol total) ont été analysées. La résistance à l’insuline a été estimée par l’Homeostatic model assessment of insulin resistance (HOMA-IR). Des valeurs de tension artérielle systolique (TAS) et diastolique (TAD) ont été mesurées. Des analyses de régressions linéaires et logistiques multivariées ont été utilisées afin d’évaluer les forces d’association.
Résultats : Les participants de milieux urbains avaient des valeurs anthropométriques et des
facteurs de risques de MCM plus élevés comparativement aux participants de milieux ruraux (P<0.05 pour le poids corporel, IMC, CA, SAT et VAT/SAT) (P<0.05 pour les triglycérides, LDL-C, cholesterol total, glycémie à jeun, insuline, HOMA-IR, TAS et TAD). L’ensemble des facteurs de risques de MCM et le SM étaient positivement et significativement associés aux valeurs anthropométriques, excepté pour les valeurs de HDL-C. VAT et SAT présentaient les associations les plus fortes.
Conclusion : Les valeurs anthropométriques d’accumulation du gras et particulièrement celles
qui reflètent de l’obésité abdominale sont des indicateurs pertinents de la santé cardio-métaboliques des populations rurales et urbaines du Kenya.
Mots clés : Syndrome métabolique, anthropométrie, obésité, lipides, résistance à l’insuline,
Abstract
Background: The prevalence of cardio-metabolic diseases (CMD) and metabolic syndrome
(MS) is drastically increasing in low and middle income countries. CMD and MS risk factors has been correlated with anthropometric measures of fat accumulation. However, very few studies have addressed by this association in rural and urban Sub-Saharan African (SSA) populations. It remains unclear which anthropometric features of fat accumulation are best associated with CMD risk factors and MS. This study aimed to investigate the association between anthropometric features, metabolic syndrome (MS) and other cardio-metabolic risk factors in a population from Kenya.
Methods: In this cross-sectional study, 1,401 rural and urban Kenyan men and women were
examined. Anthropometric measurements were carried out, including body weight, body mass index (BMI), waist circumference(WC), visceral and subcutaneous abdominal adipose tissue (VAT and SAT). Measures of blood glucose (FBG, 2-h OGTT), fasting plasma insulin and plasma lipids were analyzed. Homeostatic model assessment of insulin resistance (HOMA-IR) was calculated. Systolic and diastolic blood pressure (SBP and DBP) were measured. Adjusted multivariate linear regression analyses and adjusted multivariate logistic regression analysis were performed.
Results: Urban Kenyans had significantly higher anthropometric features (p <0.05 for Weight,
BMI, WC, SAT and VAT/SAT) and CMD risk factors (p <0.05 for triglycerides, LDL-C, total cholesterol, FPG, FPI, HOMA-IR, OGTT, SBP and DBP) compared to rural. CMD risk factors and MS were associated with all anthropometric features of fat accumulation, except for HDL-C levels (P<0.05) and the strongest associations were seen with VAT and SAT.
Conclusions: Anthropometric measures of fat accumulation, especially features of central
obesity, are relevant indicators of cardio-metabolic health in Kenyan rural and urban populations.
Key words : Metabolic syndrome, anthropometric measures, obesity, Kenya, lipids, insuline
Table des matières
Résumé………..IV Abstract………...VI Table des matières………....VII Liste des tableaux………X Liste des figures……….XI Liste des sigles………..XII Liste des abréviations………..XIII Remerciements……….XV Introduction
Chapter 1 : The cardio-metabolic risk worldwide and in sub-Saharan Africa
1.1 The Metabolic Syndrome………...1
1.2 Obesity………5
1.3 Hypertension………..8
1.4 Insulin resistance and type 2 diabetes………13
1.5 Dyslipidemia………23
Chapter 2 : Anthropometric measures of body fat distribution 2.1 Body mass index………...31
2.2 Waist circumference……….32
2.3 Adipose tissue compartments………...34
Chapter 3 : Urban migration………..40
Chapter 4 : Research project : The Kenya Diabetes Study 4.1 Population of Kenya………...43
4.2 The Kenya Diabetes Study………44
Objectives………..46
Methodology………..47
Statistical Analysis……….55
Conclusion……….87
Annexe 1 : Calculations for log-transformed variables………..88
Annexe 2 : Social economic questionnaire……….93
Liste des tableaux
Table 1. Criteria for clinical diagnosis of MS 2
Table 2. IDF criteria for ethnic or country specific values of WC 3 Table 3. ATPIII classification for total cholesterol, LDL-C, and serum TG 23
Table 4. ATPIII classification for HDL-C 23
Table 5. Nutritional status by BMI 31
Table 6. WHO WC cut-offs for men and women 33
Table 7. IDF criteria for ethnic or country-specific values of WC for men and women 33 Table 8. Morphologic characteristics and functional features by adipose tissue 37 compartment
From the manuscript
Table 1. Clinical and biological characteristics of 1,401 adult Kenyans, by place 75 of residence and sex
Table 2. Cardio-metabolic profile of 1389 adult Kenyans, by place of residence 76 and sex
Table 3. Cardio-metabolic parameters prediction by anthropometric features in 77 rural and urban Kenyan men
Table 4. Cardio-metabolic parameters prediction by anthropometric features in 78 rural and urban Kenyan women
Table 5. Association between MS diagnosis and anthropometric features in Kenyan 79 men
Liste des figures
Figure 1. Mean systolic blood pressure of adulte female 9 Figure 2. Mean systolic blood pressure of adulte male 9 Figure 3. Effect of weight gain on the shift of the frequency distribution of blood
pressure toward higher levels 11
Figure 4. Global and regional IDF projection of the number of people with diabetes
(20-74 years old), 2013 and 2035 15
Figure 5. Major type 2 diabetes complications 18
Figure 6. Prevalence of type 2 diabetes according to level of physical activity
exprssed as quartiles 21
Figure 7. Prevalence of raised cholesterol, age 25+, age standardized for male 24 and female
Figure 8. Interactions between lipoproteins in dyslipidemia induced by obesity 26 Figure 9. CT references for abdominal adipose tissue compartment’s thickness 35 Figure 10. US references for abdominal adipose tissue compartment’s thickness 35
Figure 11. Ethnic groups distribution in Kenya 43
Liste des sigles
AHI/NHLB : American Heart Institute / National Heart Lung and Blood Institute ATPIII : Adult Treatment Panel III
BMR : Basal metabolic rate CMB : Cardio-metabolic diseases CT : Computed Tomodensitometry DBP : Diastolic blood pressure
DXA : Dual-energy X-ray absorptiometry DSAT : Deep subcutaneous adipose tissue EI : Energy intake
FA : fatty acids FFA : free fatty acids
FPG : Fasting plasma glucose GHO : Global Health Observatory GIES : General intake estimation system GWAS : Genome wide association studies HbA1c : Glycated hemoglobin
HDL-C : High density lipoprotein cholesterol HIV : Human immunodeficiency virus
HOMA-IR : Homeostasis model assessment of insulin resistance HR : Heart rate
IDF : International Diabetes Federation IFG : Impaired fasting glucose
IGT : Impaired glucose tolerance
LDL-C : Low density lipoprotein cholesterol LPL : Lipoprotein lipase
MHO : Metabolically healthy obese MS : Metabolic syndrome
MRI : Magnetic resonnance imaging NAFL : Non alcoholic fatty liver
NCEP : National cholesterol education program NCD : Non communicable diseases
OGTT : Oral Glucose Tolerance Test
RAAS : renin-angiotensin aldosterone system SAT : Subcutaneous adipose tissue
SBP : Systolic blood pressure SNS : Sympathetic nervous system SSA : Sub-saharan Africa
SSAT : Superficial subcutaneous adipose tissue TG : Triglycerides
UNICEF : United Nation International Children’s emergency found UK : United Kingdom
US : Ultrasonography
USA : United States of America VAT : Visceral adipose tissue
Liste des abréviations
L'humanité est constamment aux prises avec deux processus contradictoires dont l'un tend à instaurer l'unification, tandis que l'autre vise à maintenir ou à rétablir la diversification.
Remerciements
This master thesis is a part of the Kenyan Diabetes Study, directed by Dr Dirk Lund Christensen and supported by DANIDA, University of Copenhaguen, Steno Diabetes Center, Beckett Fundation, Brdr Hartmann Fundation, Dagmar Marshall Fundation, Dr Thorvald Madsen’s Grant and Kong Christien den Tiende’s Fundation. The statistical analysis were carried out at Institut de Recherche Clinique de Montréal (IRCM) as well as at the MRC Epidemiology Unit of University of Cambridge. It is my great pleasure to thank all members of IRCM and particularly the clinic of nutrition, metabolisme et athérosclérose, as well as all members of MRC Epidemiology Unit who have provided me an inspiring and welcoming environment. This master thesis was supported by Leducq Fundation.
First of all, I want to express my sincere gratitude to my co-supervisor, Dr Dirk Lund Christensen for giving me the opportunity to be part of his research project. From my very first experience as a research assistant in 2014 at University of Copenhaguen, he has always been very supportive and generous of his time and involvement. Dr Christensen has acted for me as a true mentor and has transmitted me his passion for medical and epidemiological research as well as his interest chronic diseases in low and middle income countries.
J’aimerais exprimer également ma gratitude envers le Dr Robert Dufour, mon co-superviseur, pour son appui inconditionnel, son intérêt intarissable pour la santé cardio-métabolique en Afrique, sa grande compréhension et sa patience. Son support m’a permis d’entreprendre ce projet de maîtrise en parallèle à mon externat ainsi que ma résidence en médecine et son accueil chaleureux au sein de la clinique de nutrition, métabolisme et athérosclérose m’a permis d’y travailler dans un environnement des plus stimulants.
Un merci très particulier à Patrick Du Souich, mon parrain de mémoire, pour sa disponibilité, son approche pédagogique et ses précieux conseils. J’aimerais également
biostatistiques ainsi qu’en rédaction.
Je tiens à souligner la disponibilité de mes amis Eva Racine, Patrick Côté et Emmanuel Fortier, dont l'expérience me fut utile plus d'une fois. Un énorme merci à Ariane Bellemare et Mariane Paquette pour leur support essentiel tout au long de l’externat en médecine, ainsi qu’à Simone Poirier pour son optimisme et ses encouragements. J’aimerais également souligner le soutien d’Isabelle Croteau, qui fut une source de motivation et d’inspiration tout au long de cette étape importante de ma carrière.
Ce projet de maîtrise n'a pu se réaliser que par le support de mes proches, mes parents, ma sœur Florence et mon frère Émile, que je tiens à remercier du fond du coeur. Enfin, j’aimerais exprimer toute mon affection et ma gratitude à Frédéric Aubé, dont l’appui et la compréhension m’ont aidé à concrétiser ce grand projet, sans toutefois perdre de vue l’essentiel.
Introduction
Chapter 1
The cardio-metabolic risk worldwide and in sub-Saharan Africa
1.1 The Metabolic Syndrome
1.1.1 DefinitionThe metabolic syndrome (MS) is generally defined as a cluster of four traditional cardiovascular risk factors: abdominal obesity, dyslipidemia, hypertension and hyperglycemia. The ultimate objective of this association is to better identify individuals at risk of developing both cardiovascular diseases and type II diabetes (1). As cardiovascular and metabolic diseases are increasing worldwide, there has been a recent growing interest in this constellation of risk factors to better define and understand their mutual interactions.
Since 1988, when Gerald Reaven first described this clustering and named it the “Syndrome X” (2), a number of expert groups have suggested different definitions. In 1999, a World Health Organization’s (WHO) diabetes working group established new criteria defined by impaired glucose tolerance or type II diabetes with at least two of the following diagnoses: hypertension, hypertriglyceridemia, obesity (defined by body mass index (BMI) or waist circumference(WC)), low levels of high-density lipoprotein cholesterol (HDL-C), and microalbuminuria (3). Two years later, the Third Report of the U.S. National Cholesterol Education Program (NCEP) on Detection, Evaluation, and Treatment of High Blood Cholesterol in Adults (Adult Treatment Panel III) (ATPIII) suggested a new approach, more focused on an individual’s cardiovascular risk than on insulin resistance (4). To be diagnosed with MS, one had to present three of the following five criteria: central obesity, raised blood pressure, raised triglycerides, low levels of HDL-C, and fasting hyperglycemia. In 2004, a consensus group from
central obesity become an obligatory component for MS diagnosis (1). So far, there is no clear consensus on whether MS is representing a unique cluster of cardiovascular risks, a syndrome caused by obesity or the ultimate cardiometabolic consequence of insulin resistance.
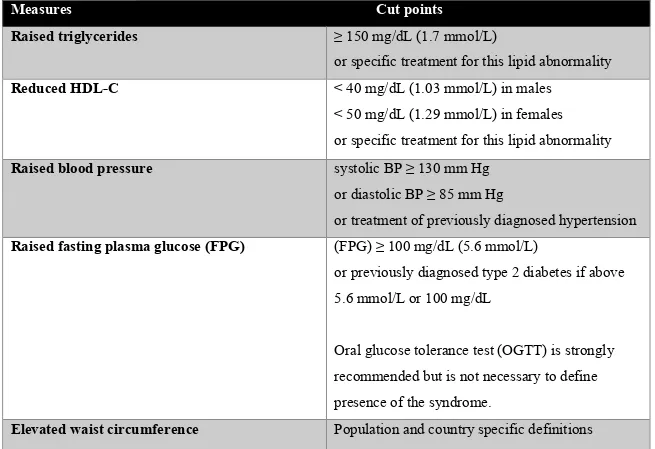
One of the main criticisms of the international community was that the MS cut-offs, which were originally set for Caucasian populations, appeared to be less applicable to other ethnic groups. Indeed, several studies have shown that ethnicity influences cardiometabolic disorders associated with obesity (5, 6). Moreover, differences between the various definitions of MS were leading to some confusion among clinicians regarding the identification of their patients (7). In response, a consensus group from the IDF and the American Heart Association /National Heart, Lung, and Blood Institute (AHA/NHLBI) met in 2009 (7). Its objectives were to harmonize the various definitions and establish new recommendations, which are shown in Table 1.
Table 1. Criteria for clinical diagnosis of MS
Measures Cut points
Raised triglycerides ≥ 150 mg/dL (1.7 mmol/L)
or specific treatment for this lipid abnormality
Reduced HDL-C < 40 mg/dL (1.03 mmol/L) in males
< 50 mg/dL (1.29 mmol/L) in females or specific treatment for this lipid abnormality
Raised blood pressure systolic BP ≥ 130 mm Hg
or diastolic BP ≥ 85 mm Hg
or treatment of previously diagnosed hypertension
Raised fasting plasma glucose (FPG) (FPG) ≥ 100 mg/dL (5.6 mmol/L)
or previously diagnosed type 2 diabetes if above 5.6 mmol/L or 100 mg/dL
Oral glucose tolerance test (OGTT) is strongly recommended but is not necessary to define
According to this consensus, the presence of any 3 of these 5 risk factors constitutes a diagnosis of MS. Also, a single set of cut points should be used worldwide for all components, except for WC. Ethnic-specific cut-offs for WC were included in the definition (Table 2), however due to paucity of data, European cut-offs are still recommended for sub-Saharan African populations (7).
Table 2. IDF criteria for ethnic or country specific values of WC
Country or ethnic group Sex WC (cm)
Europid Men Women
>94 cm >80 cm South Asian Men
Women >90 cm >80 cm Chinese Men Women >90 cm >80 cm Japanese Men Women >90 cm >80 cm Ethnic groups from South
and Central America
Use South Asian data until more specific data are available
Sub-Saharan African Use European data until more specific data are available Eastern Mediterranean and
Middle East population
Use European data until more specific data are available
1.1.2 Epidemiology
IDF’s most recent report characterized MS as the main driving force of the current cardiovascular diseases epidemic. The authors estimate that 20% to 25% of the current worldwide adult population suffers from MS (8). In sub-Saharan Africa, the increasing burden of cardiovascular diseases linked to urbanization and lifestyle modifications has led to a growing interest for MS prevalence in these countries. Effectively, the data suggest that by 2030, more than 27% of SSA adults would have a BMI ≥25 kg/m2 (9). In 2012, Kaduka et al. published a
(10). A total of 34.6% (40.2% of women and 29.0% of men) of Kenyan adults presented 3 of the 5 risk factors identified in IDF’s most recent definition (7). Another study made in rural and urban communities of Benin found a respective MS prevalence of 5.0% and 17.0% in men and women living in urban areas, and of 4.7% and 8.2% in men and women living in semi-rural areas (11). However, the authors used the 2004 IDF definition, which included WC as an obligatory parameter for MS diagnosis. Jennings et al., who studied the presentation of MS in black South African women, found a prevalence of 13% using WHO’s definition compared to 10% when using the ATPIII criteria (12). Differences between the prevalence of MS in sub-Saharan Africa might partly be explained by the variety of definitions used in the last decade by the international scientific community.
1.1.3 Pathophysiology
As it is highlighted in the IDF consensus on the worldwide definition of MS, its main causes are complex and remain to be elucidated (13). According to Reaven and the 1999 WHO definition, insulin resistance plays a central role in MS (2, 3). On the other hand, obesity and hypertriglyceridemia have both been independently associated with increased cardiovascular and metabolic risks (3, 14, 15). Indeed, obesity contributes to hypertension, dyslipidemia, high-serum cholesterol, hyperglycemia, and insulin resistance itself.
Although MS pathophysiology remains controversial, it is now commonly accepted that both insulin resistance and abdominal obesity increase cardiovascular risk (7) . However, several other predisposing factors should be considered. Genetic and environmental factors, aging, hormonal changes, and pro-inflammatory state all seem to have a causal effect on MS. The following sections will try to present the main components of MS, their characteristics, their interactions, and the diverse factors that might regulate them.
1.2 Obesity
1.2.1 Definition and Diagnosis
Obesity is defined as a state of excessive adipose tissue mass resulting from a chronic positive energy balance. Excessive body fat is usually classified into overweight or obesity, according to BMI and perhaps WC. As it is highlighted in WHO’s Global status report on non-communicable diseases (NCDs), overweight and obesity in adult populations are defined by a BMI superior to 25 km/m2 and 30 km/m2, respectively (9).
1.2.2 Epidemiology
WHO refers to obesity as one of the most neglected public health problems that threatens to deeply affect both developed and developing countries. According to WHO’s Global Health Observatory (GHO) report published in 2014, data show that at least 2.8 million people die each year from being overweight or obese (16).
As it is highlighted in the GHO report, the prevalence of obesity and overweight is highest in the Americas (27% obese and 61% overweight in both sexes) and seems to increase along with the countries’ income level (16). Indeed, low-income countries such as sub-Saharan African countries (excluding South Africa) still present the lowest prevalence of obesity. However, these countries currently have the fastest rise in prevalence of obesity and overweight, as it is estimated that by 2025 three-quarter of the obese population worldwide will live in developing countries (16). A study by Zibara et al. showed that the prevalence of obesity and overweight in women from sub-Saharan countries had increased by one-third between 1992 and 2005 (17).
1.2.3 Pathophysiology
Obesity seems to be the result of a heterogeneous group of disorders, and it has been difficult to identify and quantify all the causes and parameters involved. The neuroendocrine
and metabolic systems that regulate energy intake and storage, which are mediated by environmental conditions and genetic predisposition are complex systems.
Genetic Predisposition
Different methods have been used in obesity research to detect the effects of the gene-environment interaction in humans. In 1990, Bouchard and Pérusse proposed an innovative method to detect the effects of the gene-environment interaction by submitting both members of a pair of monozygotic twins to a standardized hypercaloric regime in a controlled environment. Significant within-pair similarities were observed, suggesting that the genotype plays an important role in the physiological responsiveness to an excess in calorie (18). In 1995, Heitmann et al. have investigated dietary fat intake and weight gain in 361 women during a 6-year follow-up period. Taking into account their family history, they showed that a high dietary fat intake (defined as more than 40% of energy intake coming from fat) was significantly associated with an increased BMI, but only among participants with a familial predisposition (19). Genetic predispositions to develop obesity are now studied at a molecular level, and the most recent genetic mapping of obesity has shown that more than 100 genes or loci are associated with a potential effect on weight gain (20, 21).
Environmental Factors
The association between physical inactivity and weight gain is well known and has been extensively studied. More than 50 years ago, Morris and al. published a study which suggested the benefits of vigorous physical activity on cardiovascular health (22). Since then, many epidemiological studies have examined the association between physical activity and obesity in different ethnic groups.
In 2010, Mbalilaki et al. studied obesity and predisposing factors in a population of 985 Tanzanian men and women (rural Maasai and urban Bantu). The authors found that Tanzanian Maasai presented an extremely high self reported level of energy expenditure, corresponding to 2,556 kcal a day over the basal rate. Despite its high in fat atherogenic diet, the Maasai
daily physical energy expenditure. According to the authors, these findings provided some support for the hypothesis that time spent doing light to moderate physical activity such as walking might be beneficial to reduce cardiovascular risk factors in sub-Saharan populations (23). On the other hand, other studies suggested that a decrease in body fat and visceral adipose tissue might only be obtained with a certain level of intensity in physical activity (24, 25). In a systematic review, Vissiere et al. investigated the independent effect of exercise without diet in an overweight and obese population of men and women. They found that a moderate to high intensity aerobic training had more effect on body fat and visceral abdominal tissue (VAT) than a low intensity aerobic exercise (24). Because it has been largely associated with cardiometabolic disorders, VAT has been the subject of a growing interest in obesity research. In a review on the effect of exercise on fat distribution, Goedecke et al. suggested that a higher proportion of visceral fat was lost in response to moderate to high intensity exercise compared to overall body fat (26).
Over the past 30 years, BMI has been increasing dramatically in sub-Saharan African populations, as in a majority of low and middle-income countries (27). Some authors suggest that the dominant factor precipitating the obesity pandemic is diet rather than a sedentary lifestyle (27, 28). A study by Delisle et al. examining diets of 200 Beninese adults has concluded that two major types of diet exist in Benin. One, more traditional, was found to be healthier and more varied than the other diet, which was characterized as “transitional” and had a higher percentage of energy coming from fat, saturated fat and sugar (29). Rashcke et al. proposed that a nutrition transition had been taking place in Africa since the time of colonial occupation, with the progressive extinction of traditional food habits and the indigenous lifestyle (30). According to Steyn et al., who published a review on the interactions between obesity and nutrition transition in sub-Saharan Africa, the process rather started to take place in 1975 mainly because of the massive growth of the manufactured food industry and the subsequent popularization of soft drinks, fast food and other westernized products on the continent (31). Still, a majority of studies admits a general tendency in the nutrition transition affecting sub-Saharan African countries, characterized by an increased intake in saturated fat, high index sugar, and animal
1.3 Hypertension
1.3.1 Definition and Diagnosis
In 2013, WHO published a global brief on hypertension in order to implement global policies to reduce death and disability caused by cardiovascular diseases. In this brief, hypertension was defined as a chronic disease in which blood vessels had a persistently raised pressure (33). Normal adult blood pressure is defined as a systolic blood pressure of 120 mmHg and a diastolic blood pressure of 80 mmHg. Hypertension is diagnosed when systolic blood pressure is equal to or above 140 mmHg and diastolic blood pressure is equal to or above 90 mmHg (33).
1.3.2 Epidemiology
In 2008, it was estimated that more than 40% of adults older than 25 years old had been diagnosed with hypertension worldwide (the highest rate being in Africa, with 46%, and the lowest in the Americas, with 35%) (33). Figure 1 and Figure 2 illustrate the mean systolic blood pressure of adult men and women worldwide (33).
Figure 1. Mean systolic blood pressure of adult females
Statistics on prevalence of hypertension in sub-Saharan Africa differs across literature, in particular for Kenya. In a population-based study directed in Nairobi conduced in 2014, Joshi et al. established the prevalence of hypertension (systolic blood pressure (SBP) >140 mmHg and/or diastolic blood pressure (DBP) >90 mmHg and/or use of anti-hypertensive medication) at 22.8% among their 2,031 participants (34). On the same year, Bloomfield et al. who studied cardiovascular risk factors among 4,092 rural participants living in Bugoma district, a western province of Kenya, reported hypertension (self reported diagnosis of hypertension) in 3% of men and 6% of women (35). Beyond differences in both methodologies, level of urbanization might partly explain these differences in the prevalence within the country. According to the last WHO report on hypertension, the increasing prevalence of hypertension in sub-Saharan Africa is mainly attributed to aging, but also to unhealthy diet, lack of physical activity, use of alcohol, and chronic exposure to stress, all of which are more prevalent in urban areas (33).
1.3.3 Pathophysiology
Hypertension is a complex and multifactorial condition affected by both genetic and environmental factors. It is now commonly accepted that it is strongly correlated to weight gain and obesity, and a number of studies have shown that the relationship between BMI and blood pressure is nearly linear. Fat mass accumulation, especially in the visceral and retroperitoneal spaces, seems to have a direct effect on the vascular system and on the kidneys’ constitution and function (36). Adipocyte dysfunction seen in excessive fat accumulation contributes to hypertension via different mechanisms such as insulin resistance, dysfunction of the sympathetic nervous system (SNS), inflammatory mechanisms, and alteration and stimulation of the renin-angiotensin-aldosterone system (RAAS) (37). In a recent review on hypertension induced by obesity, Hall et al. proposed that overweight and obese individuals who weren’t hypertensive by definition tended to have a higher blood pressure than the one they would have at their normal weight (Figure 3) (36)
Figure 3. Effect of weight gain on the shift of the frequency distribution of blood pressure
toward higher levels
In 2003, a large meta-analysis examined the interaction between weight change and blood pressure. Authors concluded that, for the most part, a weight reduction of 10% was enough to achieve a clinically significant reduction in blood pressure and cardiovascular mortality (-1.05 mmHg of systolic and -0.92 mmHg of diastolic blood pressure per kilogram of weight loss) (37).
Genetic Predisposition
Recent genome wide association studies (GWAS), mostly conducted in European and Asian populations, have linked more than 30 loci to blood pressure (38). In sub-Saharan Africa, one of the first Demographic and Health surveys “Determinants and treatment of hypertension in South Africans: the first Demographic and Health Survey” published by Steyn et al. in 2008 showed a significant association between hypertension and a positive family history of hypertension or stroke (39). As highlighted in a review by B. Rayner on hypertension in South Africa, the heritability of hypertension ranges from 30% to 60%, with various clinical presentations. According to Rayner, black Africans are generally at greater risk of developing salt-sensitive hypertension (40). In 2001, the same authors studied the levels of aldosterone and renin in South African black and white populations. They found that a large fraction of black
participants, suggesting a salt-retaining tendency in black subjects despite comparable sodium intake (41). Similar results were found by Bochud et al. who studied hypertension in black and white South Africans living in Belgium (42).
Environmental Factors
Above genetics, the interplay between genetics and environmental factors such as physical activity and diet seems to contribute to hypertension’s pathophysiology.
In 2015, Olack et al. published a cross-sectional study looking at the interactions between lifestyle and hypertension in a large cohort of sub-Saharan African participants living in Nairobi’s slums in Kenya. Their results showed that moderately active participants were one and half time more at risk of developing hypertension than participants engaging in high levels of physical activity (43).
Consistent evidences have shown an association between salt intake and blood pressure. In 1990, Poulter et al. published a longitudinal observational study of migrants in Kenya examining the possible causes of change in blood pressure associated with the rural-urban migration process. The authors evaluated and followed 325 new adult migrants in Nairobi and compared them to 267 controls living in rural Kenya. They found that the ratio of dietary sodium to potassium (as assessed by urinary measurements) were significantly higher in the urban group compared to the control. They suggested that high dietary sodium and low dietary potassium intakes were possible determinants of blood pressure in urban Kenyan populations (44).These results are consistent with a study made in Papua New Guinea which showed an increased blood pressure level in participants exposed to a high sodium intake for no more than 10 days (45). Fat intake has also extensively been associated with high blood pressure. Recently, a study made in a large cohort of rural sub-Saharan adults from Malawi, Rwanda and Tanzania has shown that fat intake and meat consumption were associated with hypertension (participants at the highest quartile of frequency of eating high-fat food had a twofold higher odds of developing hypertension compared to the lowest quartile). Frequent consumption of fruits and vegetables
consumption having an odd ratio of 0.75 (0.57 – 1.00) and the highest quartile having and OR of 0.64 (0.38-1.1)) (46).
As it is suggested in WHO’s global brief on hypertension, social determinants of health might also influence the development and control of high blood pressure (33). Rapid urbanization found in most sub-Saharan African countries might lead to an environment which encourages fast food consumption, salty diet, sedentary behaviour, tobacco (47) and alcohol consumption (48), all of which are related to an increased risk of hypertension (33).
1.4 Insulin resistance and type II diabetes
Diabetes is a chronic disease in which the body can’t produce or use properly an essential hormone produced by the pancreas: insulin. This dysfunction leads to the inability of muscle and tissue cells to absorb blood glucose, which causes a constant elevated level of blood glucose and, consequently, microvascular, cardiometabolic, and neurologic dysfunctions (8). Type 2 diabetes is the most prevalent form of diabetes worldwide and it is now commonly accepted as a comorbidity strongly associated with obesity and MS (8). Insulin resistance, which is a state were muscle cells, fat cells and hepatocytes do not respond adequately to insulin, might precipitate the development of type II diabetes and has also been associated with endocrine, metabolic, and cardiovascular complications (49).
1.4.1 Definition and Diagnosis
According to WHO and IDF’s Technical Advisory Group’s last recommendations, type 2 diabetes should be diagnosed using the OGTT or FPG. One who presents a venous FPG higher than 7.0 mmol/L (126 mg/dL) or a 2–h plasma glucose higher than 11.1 mmol/L (200 mg/dL) should be considered a type 2 diabetic (50). According to the Canadian Diabetes Association, type II diabetes can also be diagnosed with a random plasma glucose higher than 11.1 mmol/L, or a glycated hemoglobin (HbA1c) superior to 6.5%. HbA1c avoids day-to-day variability of blood glucose as it reflects an average blood glucose of the last 2 or 3 months (51). Impaired glucose tolerance (IGT), which is a pre-diabetic state of hyperglycemia, is as a FPG lower than 7.0 mmol/L and a 2-h plasma glucose higher than 7.8 mmol/L, but inferior to 11.1mmol/l.
than normal, is defined as a FPG between 6.1 mmol/L and 6.9 mmol/L and a 2-h plasma glucose lower than 7.8 mmol/L (50).
1.4.2 Epidemiology
According to the 6th Edition of IDF’s Diabetes Atlas, in 2014, 8.3% of adults worldwide were suffering from diabetes, and almost half of them were not aware of it (8). The majority (80%) of adults affected by the disease and aged between 39 and 59 years old were living in low or middle-income countries. In 2013, more than 5.1 million deaths were directly caused by diabetes, meaning that one person was dying from diabetes (either type 1 or 2) every six seconds.
Both type 1 and type 2 diabetes are increasing globally. Following the urban migration and a dramatic rise in predisposing factors including obesity, type 2 diabetes is expected to rise by 55% by 2035 (8). Figure 4 shows the global actual prevalence and the projections of type 2 diabetes across different regions of the world (8).
Figure 4. Global and regional IDF projections of the number of people with diabetes
(20-79 years old), 2013 and 2035
In sub-Saharan Africa, type 2 diabetes varies widely among regions, with prevalence ranging from 0.3% (rural Gambia) (52) to 8.27% (South Africa) (8) depending on ethnic groups, level of urbanization, difference in diet, lifestyle and studies’ methodologies. One of the first studies to estimate the prevalence of type 2 diabetes in African populations was carried out in 1958. The authors found a prevalence of 0.4% studying rural Ghana’s populations (53). However, as it is explained by Christensen et al. in an article studying the prevalence of glucose intolerance in Kenya, glycosuria has been largely used as a diagnostic tool in the past decades in sub-Saharan African studies (54). This technique might have led to underestimated prevalence rates in the past considering the poor sensitivity of this test. In 2005, the INTERHEART study showed that the global prevalence of diabetes in Africa was 7.6% (55). In 2009, Christensen et al. found a relatively low age-standardised prevalence of diabetes in Kenya (4.2%), with a concurrent prevalence of IGT (12.0%), based on OGTT results (54).
1.4.3 Pathophysiology
In type 2 diabetes, the pancreas is at first able to produce extra insulin, but it is either not sufficient or the peripheral tissues are unable to respond adequately to its effect (insulin resistance). Insulin resistance is indeed defined as a loss of response to insulin (impaired glucose uptake) by sensitive peripheral tissues and by an impaired ability to decrease hepatic glucose output (49). This phenomenon can later lead to pancreatic beta-cells exhaustion and their dysfunction (8). Insulin resistance is the primary cause of type 2 diabetes and usually occurs years before its onset.
It is now commonly accepted that obesity lead to metabolic dysfunction and to an increased risk of type 2 diabetes through insulin resistance. Interactions are complex and the cascade of events occurring during the development of insulin resistance induced by obesity still needs to be elucidated. In 2013, Jianping Ye published a manuscript describing the different mechanisms of insulin resistance in obesity. It is suggested that obesity could lead to insulin resistance through different phenomena such as adipose tissue dysfunction, hyperinsulinemia, and chronic inflammation (56). For example, the chronic low-grade state of systemic inflammation found in obese individuals would be associated with adipose tissue dysfunction. Through several mechanisms, inflammation would inhibit the insulin signaling activity of hepatocyte and adipocytes (56). Also, the number and function of b cells in pancreatic islets would enhance with weight gain (57). b cells are the only source of insulin. Obesity would thus be associated to a state of hyperinsulinemia. According to Ye, hyperinsulinemia could lead to insulin resistance. This hypothesis was supported Shanik et al., whom published in 2008 a review presenting 5 different studies from human and animal models where insulin level was considered as a quantitative contributor to insulin resistance (58). In another review published in 2007 by Jianping Ye, it is suggested that insulin resistance would result from a negative feed-back loop in the insulin signaling pathway, activated in state of hyperinsulinemia (57). Other factors such as sleep apnea, pregnancy, stress or genetic factors have also been outlined as involved phenomena (56).
Once type 2 diabetes has been diagnosed, a strict control is necessary in order to avoid a number of life-threatening conditions. As illustrated in Figure 5, a chronic elevated blood glucose level is known to damage blood vessels, nerves (diabetic neuropathy), kidneys and eyes (diabetic retinopathy), and is linked to serious cardiovascular complications (angina, stroke, myocardial infarction, cardiomyopathy, congestive heart failure, and peripheral artery diseases). It also increases the risk of infections, which can be a real challenge for low and middle-income countries given the importance of communicable diseases such as tuberculosis and human immunodeficiency virus (HIV) in these regions (8).
Figure 5. Major type 2 diabetes complications (8)
Genetic Predisposition
It is now commonly accepted that type 2 diabetes has a strong genetic component. In 1992, Kaprio et al. studied the concordance of type 2 diabetes in a population-based cohort of monozygotic and dizygotic twins in Finland (59). Results showed a concordance rate of 34% among monozygotic twins, and of 16% among dizygotic twins, highlighting the major role of genes in the pathophysiology of type 2 diabetes. Recent technological development in biomolecular medicine has permitted to identify more than 50 genes associated with the disease, but they would account for only 10% of the primary constitutional origin of type 2 diabetes (60).
However, as it was outlined by Yako et al. in a meta-analysis on the genetic risk of type 2 diabetes in the African continent, most of genome-wide association studies were conducted in European and Asian populations. Results can hardly be transposed to other ethnic groups, especially African populations which are known to harbour more inter-individual genetic variations (61). Further research is needed in order to better understand the specific genetic predisposition of sub-Saharan African populations to develop type 2 diabetes.
The Effect of Body Fat Distribution: An Ethnic Predisposition
In 2003, Nakagami et al. published a review looking at the effects of ethnicity on the association between age, BMI, and the prevalence of type 2 diabetes. They examined population-based studies carried out in different ethnic groups (Europeans, Maltese, Japanese, Indian, and Chinese) and concluded that the effects of weight gain on age-adjusted prevalence of type 2 diabetes are affected by ethnicity (62). Comparatively, Christensen et al. published a study looking at insulin resistance and beta-cell functions in different ethnic groups of Kenya (63). They demonstrated that Maasai participants, compared to Luo and Kamba, had a higher rate of insulin resistance and hyperinsulinemia. According to the authors, this ethnic difference can be partly caused by fat distribution, as Maasai have a higher VAT accumulation compared to the two other groups. Their results showed a significant interaction between ethnicity and VAT accumulation, suggesting an ethnic predisposition to stock fat viscerally, and thus to be at higher risk of insulin resistance and type 2 diabetes.
In 2014, Goedecke and Micklesfield published a review looking at the effects of exercise on body fat distribution and on the risk of developing type 2 diabetes (26). According to their review, body fat distribution, or the predisposition to stock fat viscerally instead of subcutaneously, can be associated with insulin resistance and type 2 diabetes. They suggested that VAT was more lipolytic and had a higher inflammatory profile compared to subcutaneous adipose tissue (SAT). Since free fatty acids (FFA) and adipokines from VAT are being released directly into the portal circulation, they have a greater effect on hepatic glucose homeostasis and can lead to insulin resistance (26). In a prospective study, Neelan et al. studied 732 obese adults
The role of VAT is also clearly demonstrated by the metabolically healthy obese phenotype (MHO) characterized by a diagnosis of obesity with the presence of only two or less components of MS. MHOs tend to be insulin sensitive, and studies have shown that they usually present a lower amount of VAT, liver, and intramuscular fat compared to obese subjects with associated cardiometabolic disorders (65). On the other hand, as it is highlighted in Goedecke’s review, SAT accounts for more than 80% of FFA and adipokines released into the total bloodstream. Both abdominal tissue layers seem to have detrimental cardiometabolic effects and should be considered as risk factors for insulin resistance and type 2 diabetes (26).
Environmental Factors
Many studies have shown interest for the association between physical activity and type 2 diabetes and insulin resistance in low and middle-income countries. In 1999, Levitt et al. investigated the prevalence of type 2 diabetes and its predisposing risk factors in South Africa. In this cross-sectional study, the authors showed a negative association between both occupational and leisure physical activity and type 2 diabetes. They also demonstrated a dose-response effect between the intensity of physical activity (levels of energy expenditure) and the prevalence of insulin resistance and type 2 diabetes, as illustrated in Figure 6 (66).
Figure 6. Prevalence of type 2 diabetes according to level of physical activity expressed as
quartile
In 2016, Gatimu et al. studied the prevalence and the determinants of diabetes among 5,565 Ghanaian adults (67). They found that respondents aged 50 to 59 years and those aged 60 to 69 years participating in low to moderate physical activity were respectively 67% and 117% more likely to be diabetic than their counterparts engaging in a high intensity level of physical activity. These results provide evidence on the association between the intensity of physical activity and the prevalence of type 2 diabetes, particularly among aging populations. Similar correlations were found in urban slums of Kenya (68).
There are epidemiological evidences for the association between dietary patterns and insulin resistance or type 2 diabetes. Indeed, nutrition has been identified as one of the major modifiable risk factor for type 2 diabetes. Nevertheless, food intake in low and middle-income countries, and particularly in sub-Saharan Africa, differs largely from dietary patterns in European, Asian or American populations. In 2016, Schulze et al. have studied the food habits of a large Ghanaian urban population (69). As expected, a low fat diet rich in fruits and vegetables was associated with a lower risk of developing type 2 diabetes. However, authors also found a negative association between red meat and type 2 diabetes, which was surprising but might be explained by the leaner types of meat found in sub-Saharan Africa compared to westernized countries. Cheng et al. recently studied the effects of food insecurity on type 2
presenting type 2 diabetes about their diet. The authors found a particularly high prevalence of food insecurity status (32%) in patients affected by type 2 diabetes (70). These results highlight the essential need for further research on the relation between nutrition and type 2 diabetes and insulin resistance in sub-Saharan Africa, which should include the entire spectrum of food intake.
1.5 Dyslipidemia
1.5.1 Definition
Dyslipidemia associated with obesity is characterized by increased triglycerides (TG), low HDL-C and/or elevated small-dense LDL particles (71). Such a profile usually predisposes to cardiovascular diseases. Table 3 shows a general classification of total cholesterol, LDL-C and TG levels, as suggested by the NCEP-ATPIII (72). Table 4 shows a similar classification for HDL-C levels (72).
Table 3. ATPIII classification for total cholesterol, LDL-C, and serum TG
Levels Total Cholesterol (mg/dL: mmol/l) LDL-C (mg/dL: mmol/l) TG (mg/dL: mmol/l) Desirable <200: 5.18 <100: 2.59 <150:1.69 Borderline High 200-239: 5.18-6.19 100-159: 2.59-4.12 150-199: 1.69-2.25 High >239: 6.19 159-189: 4.12-4.89 199-499: 2.25–5.64 Very High >189: 4.89 >500: 5.64
Table 4. ATPIII classification for HDL-C
Levels HDL-C
(mg/dL: mmol/l)
Low <40: 1.04
High >59: 1.53
1.5.1 Epidemiology
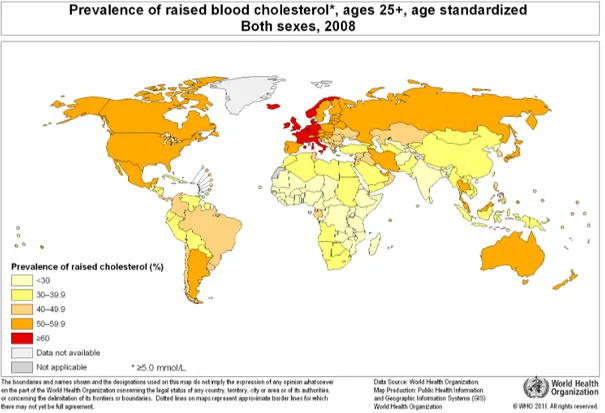
According to WHO, in 2008, the global prevalence of dyslipidemia was 37.0% in men and 40% in women (9). They estimated that cholesterol levels had barely changed in the past 20 years, declining by less than 0.1 mmol/L per decade despite global health interventions. According to WHO’s statistics, the African region had a dyslipidemia prevalence of 22.6%, while European and American regions presented a respective prevalence of 54.0% and 48.0% (9). The INTERHEART Africa study evaluating risk factors for myocardial infarction across
diseases (55). Figure 7 illustrates the worldwide prevalence of raised cholesterol in men and women.
Figure 7. Prevalence of raised cholesterol, age 25+, age standardized for male and female
In Kenya, very few studies have reported dyslipidemia prevalence in rural or urban populations. In a cross-sectional study published in 2015, Christensen et al. found a dyslipidemia prevalence of 37.3% in a rural Kenyan population of 1,139 men and women, of which only 6.1% had isolated high TG levels, 86.7% had isolated low HDL-C levels, and 7.3% had both (73). In 2016, Harengu et al. found a hypercholesterolemia prevalence of 10.3% and a hypertriglyceridemia prevalence of 17.3% in a cohort of 5,190 Kenyans living in the urban slums of Nairobi (74).
1.5.2 Pathophysiology
Obesity increases the risk of developing a variety of pathological conditions such as non-alcoholic fatty liver disease (NAFL) or dyslipidemia. Adipose tissue plays a major role in the pathogenesis of metabolic dysfunction as it is the major repository of FFA. In the bloodstream, fatty acids (FA) are either linked to albumin (FFA) or transported via chylomicrons and very low-density lipoproteins (VLDL). They are delivered to specific tissues for energy fuel or storage (75). Chylomicrons are large transport lipoproteins assembled in the intestinal mucosa which carry exogenous fat and cholesterol, whereas VLDL, synthetized by the liver, are another type of lipoproteins which transport endogenous TG, phospholipids, cholesterol, and cholesteryl esters (76). The amount of FA released from VLDL and chylomicrons depends on the activity of several lipases and apoproteins acting as co-factors. Lipoprotein lipase (LPL) is one of the main enzymes responsible for TG lipolysis. It is strongly expressed in skeletal muscles, the heart, and adipose tissues, which are all commonly known to require large quantities of FFA for energy expenditure or storage. LPL hydrolyzes TG from VLDL and chylomicrons and releases TG into specific tissue cells so these molecules can be used (76).
Insulin is a major regulator of FFA storage and mobilization (77). In a post-prandial state, the rapid rise in insulin allows FFA uptake by cardiomyocytes, adipose tissue cells, and myocytes. On the contrary, in a fasting state, FFA can be mobilized from the adipose tissue and redistributed in the most demanding tissues, such as cardiomyocytes (77). Following lipolysis by LPL, chylomicrons and VLDL are transformed into denser lipoproteins called chylomicrons remnants, VLDL remnants and low-density lipoproteins (LDL-C) (71). Both are then catabolized by hepatocytes through a receptor mediated pathway (78, 79). The liver also synthetizes beneficial transport proteins named high-density lipoproteins (HDL-C). HDL-C particles collect cholesterol from the peripheral tissues and the arterial walls and return it to the liver where it will be catabolized (71). Mature HDL-C particles, rich in cholesterol, can either be taken up by the liver or transfer their cholesterol content to other lipoproteins (80).
cause of other lipid abnormalities induced by obesity. Studies have shown that obese individuals present a reduction in LPL activity in skeletal muscles, which impairs the lipolysis of TG-rich lipoproteins and induces hypertriglyceridemia (71). Hypertriglyceridemia delays clearance of TG-rich lipoproteins such as VLDL and leads to an increased synthesis of small dense LDL-C, which are metabolised slowly and can cause atherosclerosis (82). Figure 8 illustrates the pathophysiological interactions between lipoproteins in dyslipidemia induced by obesity.
Figure 8. Interactions between lipoproteins in dyslipidemia induced by obesity
Genetic Predisposition
Ethnic differences in lipid profiles have been documented and attributed, in part, to genetic polymorphisms. However, most genetic studies are based entirely on European descents, and it remains unclear if the markers found in recent studies have a prognostic utility in other populations such as Africans or Hispanics (83). In 2009, Deo et al. published an interesting study whose objective was to genotype a panel of 12 new genetic variants known to predict lipid profiles in Europeans in a cohort of 4,464 African Americans (83). The authors did not found any significant association between these variants and LDL-C, HDL-C, and TG levels of African Americans. They concluded to a lower effect sizes for the 12 risk variants in African descent populations and highlighted the need for caution in the use of genetic variants for risk
In 2008, Sumner et al. published an interesting cross-sectional study where they used a cohort of 2804 participants from the American National Health and Nutrition Examination Survey (NHNES) to determine the prevalence of dyslipidaemia, obesity, hypertension and type 2 diabetes by ethnicity. Despite a higher level of obesity, hypertension, and type 2 diabetes, African Americans presented lower TG levels compared to their white and Hispanic counterparts. The authors’ hypothesis was that an ethnic difference may exist in the production and clearance of TG rich lipoproteins, possibly linked to LPL activity (84). In 2000, Deprés et al. have compared body fatness, BMI, VAT, plasma lipids and LPL activity between a cohort of black and white men and women (85). They found that, for a greater body fat content compared to their white counterparts, black women had a significantly lower levels of VAT, reduced apolipoprotein B and higher HDL-C levels. A higher LPL activity level was found in black participants from both sexes. Nevertheless, the authors admitted that despite a significant difference in LPL activity between the two ethnic groups, results from their multiple regression analysis showed that ethnicity had only a modest effect on the variance of plasma lipoproteins levels. To a certain extent, variability in lipid levels across ethnicities might rather be explained by a propensity to stock fat viscerally or subcutaneously (85).
It is more and more accepted as a fact that black Africans and African Americans tend to present a better profile in plasma lipids (lower LDL-C and TG levels) compared to Caucasians and Asians (12, 29, 85). However, some studies have also found that black African descents and African populations present lower levels of HDL-C (12, 29, 86). In 2015, Asiki et al. studied dyslipidemia in a population of rural southwestern Uganda. They found that almost three quarter of the the population having dyslipidemia had isolated low HDL-C levels (71.3%), while only 6.0% of them presented isolated high TG levels (87).Similar results were found by Christensen et al., who studied the differences in blood pressure and lipid status according to age, ethnicity, and sex in a Kenyan population. They found that 86.7% of their participants affected by dyslipidemia had isolated low HDL-C, regardless of their insulin resistance or obesity status. As it is suggested by the authors, HDL-C levels might be a major and an independent cardiometabolic risk factor in black African populations (73). Another hypothesis is that
HDL-Environmental Factors
According to Delisle et al., whereas genetic factors must contribute highly to dyslipidemia, environmental factors such as diet are also at play. The authors’ hypothesis states that HDL-C levels found in African populations are significantly associated with nutrition, particularly with poor micronutrients intake and vitamin deficiency. From their cohort of 541 healthy adults from Benin, Delisle et al. found that HDL-C was significantly associated with either undernutrition or overnutrition and poor micronutrients intake (29). Asiki et al. who studied dyslipidemia in a rural Ugandan population have also associated low HDL-C levels to an insufficient consumption of fruits and vegetables (87). Populations from countries affected by nutrition transition such as most African countries are thus at risk of cardiometabolic diseases through low HDL-C levels.
Diet composition is undoubtedly associated with cardiovascular risk factors. High intakes of saturated FA, trans-unsaturated FA, and cholesterol have been shown to increase LDL-C levels, whereas high carbohydrates diets have been associated to lower HDL-C levels (88, 89). According to the most recent guidelines from the American Heart Association, increased intake of sugar, refined carbohydrates, and alcohol are also increasing TG and VLDL levels (89). Moreover, as it is suggested in the NCEP-ADPIII, antioxidant nutrients, folic acids, B-vitamins, and other micronutrients can also affect lipid profiles (72). Food quality might be an independent risk factor for cardiometabolic health.
According to the NCEP-ADPIII expert panel, physical activity has also been associated with an improvement of lipid profile (72). As it is explained in the NCEP-ADPIII, the mechanisms are not fully understood. However physical activity seems to play a beneficial role regarding fat accumulation. It reduces atherogenic lipids (small dense LDL-C particles and TG) by increasing daily energy expenditure and decreasing body fat mass (72). In 2007, Mbalilaki et al. published a study made on 985 rural and urban Tanzanian participants from various ethnic origins. They showed that rural populations presenting a higher physical activity level compared
2010, similar associations were found in another Masaai population from Tanzania. Mbalilaki et al investigated the association between dietary pattern, physical activity level and serum lipids in a population of 985 men and women from two different ethnic origins (Masaai and Bantu). Masaai presented an extremely high level of physical activity (2,565 kcal/day compared to 891 kcal/day for urban Bantu) and favourable lipid levels despite a diet rich in fat and carbohydrates (23).
Chapter 2
Anthropometric measures of body fat distribution
Advanced researches and technologies have led to an incremental knowledge on cardiovascular and metabolic diseases and their association with body composition and fat distribution. Technologies such as magnetic resonance imaging (MRI), computer tomography (CT) or dual-energy X-ray absorptiometry (DXA) have helped to understand the complex interactions between each individual body composition, adipose tissue compartment and health risks.
Since the late 40’s, it is recognized that alterations in body mass composition are involved in the pathogenesis of many chronic and acute illnesses. One of the first reports on the association between obesity, fat distribution and health risks was published by French physician Jean Vague in 1947 (90). Since the 80’s, it is commonly accepted that body mass and fat distribution have a significant influence on an individual’s health, and the main consequences tend to affect the cardiovascular and the metabolic systems (91).
MRI and CT, the accepted gold standards to assess regional body composition, require important financial and technological resources and are difficult to include in routine health care situations. Moreover, such technologies remain rare in low and middle income countries, and almost inexistent in the majority of rural areas. Despite a crucial progress in biomedical technologies over the last decade, nutritional health is still based on anthropometry, the science that defines physical measures of a person’s size, form and functional capacity (92). Although new medical imaging systems offer impressive possibilities, a number of studies have shown the reliability of anthropometric measurements (91). As a simple, inexpensive and safe process, anthropometry remains the most widely used method for quantifying body mass composition, and new potential applications are still being explored (91).
adipose tissue can be strongly associated with cardiometabolic risk. Abdominal obesity, measured by WC, is known to be a strong predictor of mortality and morbidity (93). Adipose tissue compartments have also aroused considerable research interest. Compartments of abdominal fat, commonly referred as visceral and subcutaneous adipose tissues (VAT and SAT), have been largely studied for their possible relationship with metabolic and cardiovascular abnormalities (94). The propensity to stock fat viscerally or subcutaneously, measured by the visceral-to-subcutaneous adipose tissue ratio (VAT/SAT), has also been suggested as a potential correlate of cardiometabolic risk (94).
2.1 Body mass index
WHO promotes BMI as a measure to classify underweight, overweight and obesity in adult populations. It is defined as a person’s weight (kg) divided by the square of its height (m2). The following ranges, showed in Table 5, have been established according to the effect of excessive fat on comorbidities and mortality (95).
Table 5. Nutritional status by BMI (92)
BMI Nutritional status
Below 18.5 Underweight
18.5–24.9 Normal weight
25.0–29.9 Pre-obesity
30.0–34.9 Obesity class I
35.0–39.9 Obesity class II
Above 40 Obesity class III
systematic review on the pathogenesis of obesity and MS, metabolic and cardiovascular consequences of fat accumulation vary among individuals (96). For example, in their review, Müller et al. reported that 50% of overweight (or pre-obese) and 30% of obese subjects present a favorable metabolic profile, i.e. the absence of inflammation, dyslipidemia, hypertension or cardiovascular and metabolic complications. These subjects, considered as “metabolically healthy obese” (MHO), differ from the “metabolically abnormal obese” by their fat distribution. As explained by Müller et al., for a comparable BMI, MHO tend to present lower VAT and fat infiltration in the liver and the skeletal muscles. At the opposite, other studies have reported the existence of a subgroup of normal-weight subjects with low SAT and increased VAT. Characterized as “thin-fat”, these individuals are exposed to a greater risk of insulin resistance and cardiometabolic complications because of their adverse adipose tissue distribution (97).
As WHO already pointed out in its last report on obesity (95), BMI is a limited measure. It does not take into account differences in adipose tissue distribution based on age, gender, ethnicity or physical activity level. It may over or underestimate adiposity and its cardiometabolic consequences. As an example, in 2002, a WHO expert consultation panel proposed to lower BMI ranges for South Asian populations, known to present a relatively high prevalence of the “thin-fat” phenotype (95). They concluded that South Asians had different associations between BMI and health risks and recommended to use a BMI of 23 kg/m2 as a trigger point for public health actions (98). Further researches are needed to evaluate the limitation of BMI in different ethnic groups.
2.2 Waist circumference
Increasing evidence suggests that abdominal fat is an important cardiometabolic risk factor. WHO now recommends WC as the official anthropometric measure to assess central obesity. Sex-specific cut-offs are promoted to identify the increased relative risk of Cardio-Metabolic Diseases (CMD). Based on a random sample of 2,183 men and 2,698 women, WHO has recently established a sex-specific table of recommended cut-off points (Table 6) (99). The IDF has also provided recommendations stratified by sex, population and geographic areas
definition of abdominal obesity. While WHO and IDF recommend that the WC threshold for abdominal obesity in European populations should be ³94 cm for men and ³80 cm for women, the AHA/NHLBI rather recommends cut-off points superior to 102 cm for men and to 88 cm for women (7).
Table 6. WHO WC cut-offs for men and women
Sex WC (cm)
Men >94
Women >80
Table 7. IDF criteria for ethnic or country-specific values of WC for men and women
Country or ethnic group Sex WC (cm)
Europid Men Women ³94 ³80 Asian Men Women ³90 ³80 Middle East and
Mediterranean
Men Women
³90 ³80 Sub-Saharan African Men
Women ³94 ³80 Central and South America Men Women ³90 ³80
One of the main critics concerning WC cut-offs (as established by WHO) is that they are based on limited data from Caucasian subjects, mainly from European countries. Recent studies have shown that these cut-offs cannot be universally used across ethnic groups, particularly for individuals from Asian origin, known to be at a higher risk of CMD for lower WC values (7). On the other hand, according to WHO, limitation of data makes it difficult to specify cut-off points. Although WHO accepts the hypothesis that cardiometabolic risk may vary between ethnicity for a similar WC, there isn't sufficient evidence to recommend ethnic specific cut-offs
2.3 Adipose tissue Compartments
The role of adipose tissue has to be considered within the context of its physiological benefits versus its pathogenic consequences. Indeed, being overweight is not necessarily detrimental, and adipose tissue has diverse roles, pathogenic or not, depending on its location and function.
Adipose tissue compartments can be stratified in different levels based on their distribution within the body. Different classifications have been proposed, however it is commonly accepted that body fat is divided in three major zones: superficial subcutaneous adipose tissue (SSAT), deep subcutaneous adipose tissue (DSAT) and VAT (100-102). In the abdomen, abdominal muscle (the anterior line of the rectus abdominis muscle) constitute the anatomical separation of two distinct compartments: the primary compartment (SSAT and DSAT) and the secondary compartment (which only includes VAT). A fascial plane (fascia superficialis) divides SSAT and DSAT (101). All structures are easily recognized on CT and MRI, and even with ultrasonography (Figure 9, Figure 10).
Figure 9. CT references for abdominal adipose tissue compartment’s thickness (100)
A.1 shows total subcutaneous fat thickness; A.2 shows superficial subcutaneous fat thickness; A.3 shows deep subcutaneous fat thickness; A.4 shows total visceral fat thickness. From (103)
Figure 10. US references for abdominal adipose tissue compartment’s thickness
(a) (a) shows abdominal adipose tissue and anatomical landmark used in US measurements (104) ; (b) shows total visceral fat thickness; (c) shows subcutaneous fat thickness: C.1 shows total subcutaneous
fat thickness, C.2 shows superficial subcutaneous fat thickness, and C.3 shows deep subcutaneous fat thickness (103).