Validation of musculoskeletal models: the importance of trend validations
Mark de Zee
1, Morten E. Lund
2, Cédric Schwartz
1, Christian G. Olesen
2and John Rasmussen
21
Aalborg University, Department of Health Science and Technology, Fredrik Bajers Vej 7-D3, 9220 Aalborg, Denmark.
2
Aalborg University, Department of Mechanical and Manufacturing Engineering, Pontoppidanstraede 101, 9220 Aalborg, Denmark
Introduction
Validation of musculoskeletal models is an important issue and is getting more and more attention, which is also apparent in this symposium. Most probably the reasons for this huge attention for validation are advancements in scientific research, but also by the appearance of more general commercial and open source musculoskeletal modeling systems like Lifemodeler ("LifeModeler, 2010), OpenSIM (Delp et al., 2007), and AnyBody (Damsgaard, Rasmussen, Christensen, Surma, & de Zee, 2006), which makes musculoskeletal modeling available to science and industry. We are at a transition from science to clinical applications where erroneous predictions by the models could have serious consequences. However, compared to some other areas in engineering there are no formalized processes of Verification & Validation (V&V) in musculoskeletal modeling. Only recently a review article has attempted to describe V&V and sensitivity studies in relation to computational biomechanics (Anderson, Ellis, & Weiss, 2007), though the focus was solely on finite element modelling and tissue engineering.
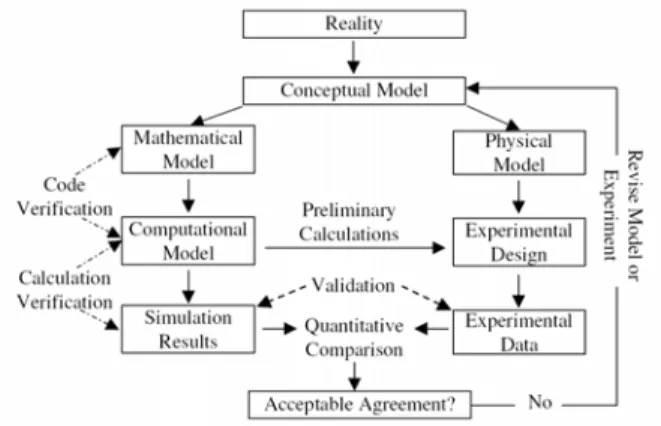
Figure 1: Overview of the V&V process (From Anderson et al., 2007)
Anderson et al. (2007) presented an overview of the V&V process as indicated in Figure 1. There are many elements in the V&V process and all elements are important. In this paper we focus on the experimental design of the validation experiments. This is an important process, because the validation experiments generate the data for assessing accuracy of the computational model.
Many musculoskeletal models are built for investigation of the so-called if-then scenarios. If you change a certain parameter what will happen to the output of interest? For answering these kinds of questions one needs a model where the parameters interact with each other in the correct way. One of the possible experimental designs to validate these models is to change one or more parameters systematically and monitor an output measure as a function of those parameters. In the simulation the same parameters are changed and the same output measure is monitored. This will make it possible to compare both the trends and the absolute values as well.
The aim of this paper is to propose that trend validations should be made more important for validating musculoskeletal models. This will be illustrated with two examples.
Example 1: Validation of a computational seated human musculoskeletal model
Introduction
Pressure ulcers are a frequent complication to spinal cord injury (SCI) patients, however the ethiololgy is in general poorly understood. It is well acknowledged that pressure ulcers are primarily caused by sustained mechanical loading of the soft tissues. An analytical approach could contribute to understanding of how the seating posture affects the mechanical loading of the soft tissue in the buttock region. A validated analytical model could be used to predict load values from different seating postures without the need for costly experiments. The objectives was to validate a musculo-skeletal model with respect to its ability to predict reaction forces and how these change with a change in the seated posture.
Methods
The experiment was conducted for three healthy male subjects (27±2 years; 76±3 kg; 177±3 cm). The experimental setup included measurements of reaction forces on a custom-built wheelchair that was mounted with force-measuring equipment. The reaction forces were measured in various seated postures. The postures were adjusted by changing seat and backrest inclination angle, and height and depth of the seat and backrest. The postures were measured using a motion capture system.
The model used was built in the AnyBody Modeling System (Damsgaard et al., 2006) and is available in the public domain repository (www.anyscript.org). The model is described in detail by Rasmussen et al (Rasmussen, Tørholm, & de Zee, 2009). The connection between the chair and the human musculoskeletal model was modeled as contact elements perpendicular to the contact surfaces and capable of taking Coulomb friction into account.
Results
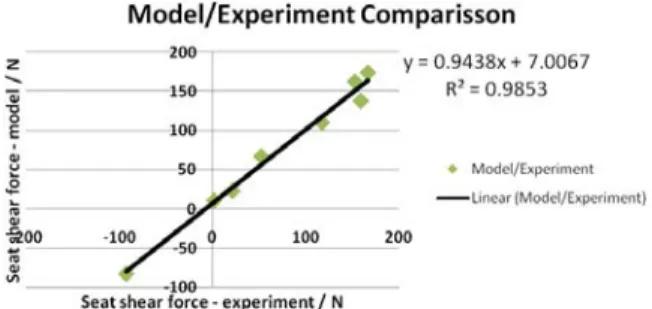
One of the most discussed parameters in seating biomechanics related to pressure ulcers is the shear force between the buttocks and the seat, and is therefore an important parameter to validate. Figure 2 shows the shear force from the experiment as a function of the shear force calculated by the model for different seat angles.
Discussion
One of the most discussed parameters in seating biomechanics related to pressure ulcers is the shear force between the buttocks and the seat, and is therefore an important parameter to validate the relation of the shear force as a function of seat position. The correlation between the experiment and the model is good. Ideally the graph would show a linear relationship with a slope of 1 and intersection through 0 N.
Figure 2: Seat shear force comparison between the experiment and the model result
Example 2: Prediction of knee load for different walking styles
Introduction
This example was part of the “Grand Challenge Competition to Predict In-Vivo Knee Loads” during the 2010 Summer Bioengineering Conference. It is based on a nice synchronized data set provided for the competition including in-vivo loads of the knee joint provided by an instrumented prosthesis (Kim et al., 2009). The organizers of the grand challenge focused a lot on comparing the predictions with the absolute values of the instrumented prosthesis. In this example the focus will be on the change of knee load as a function of the way of walking. At the moment of writing of this abstract the true knee load values are not available yet.
Methods
Two types of gait data was collected from one patient (age: 83, height: 1.66 m, mass: 64.6 kg) implanted with an instrumented knee replacement in the right knee: normal gait and trunk sway gait.
A musculoskeletal model of the lower extremities based on the Klein Horsman data set (Klein Horsman, Koopman, van der Helm, Prosé, & Veeger, 2007) was built using the AnyBody Modeling System. This leg model is a 6 degree-of-freedom (DOF) model actuated by 55 muscles divided into 159 fascicles per leg.
Results
Figure 3 presents the loads estimated by AnyBody modeling system on five normal gait trials and five trunk sway trials. The trunk sway gait presented the same pattern as the normal gait but with higher loads in both compartments in the beginning of the stance phase compared to normal gait.
Figure 3: Mean (blue) and range (grey area) knee loads predicted for five normal and five trunk sway gait trials. Discussion
For gait, the simulations led to total knee load during normal gait up to 4*BW (Figure 3), while literature reports maximal
loads between 2 and 3*BW (Mundermann, Dyrby, D'Lima, Colwell, & Andriacchi, 2008). The simulation also suggests that the trunk sway gait actually leads to higher loads in the knee in the beginning of the stance phase while the loads in the second peak of the stance phase remains the same. Whether this is correct, has to be checked when the true load data will be made available by the competition organizers. The point is that a trend to a higher load for a trunk sway gait might be more interesting than the absolute values. This would be relevant if medio-lateral trunk sway would be suggested as a treatment for patients with degenerative joint disease such as medial compartment knee osteoarthritis.
General discussion
Nigg and Herzog (Nigg & Herzog, 1999) already mentioned the importance of trend validations, though not many systematic trend validations have been done with regards to musculoskeletal models. Especially if one is interested in investigation of if-then scenarios with a model, a systematic trend validation experiment would be necessary like in example 1.
In the hierarchy of validation results trend results should be weighted much more than is the case now. And consequently more focus should be given in carefully designing validation experiments.
References
"LifeModeler". (2010). Lifemodeler software. Retrieved April 22nd, 2010, from http://www.lifemodeler.com/
Anderson, A. E., Ellis, B. J., & Weiss, J. A. (2007). Verification, validation and sensitivity studies in computational biomechanics. Computer Methods in Biomechanics and Biomedical Engineering, 10(3), 171-184.
Damsgaard, M., Rasmussen, J., Christensen, S. T., Surma, E., & de Zee, M. (2006). Analysis of musculoskeletal systems in the AnyBody modeling system. Simulation Modelling Practice and Theory, 14(8), 1100-1111. Delp, S. L., Anderson, F. C., Arnold, A. S., Loan, P., Habib,
A., John, C. T., et al. (2007). OpenSim: Open-source software to create and analyze dynamic simulations of movement. IEEE Transactions on Biomedical Engineering, 54(11), 1940-1950.
Kim, H. J., Fernandez, J. W., Akbarshahi, M., Walter, J. P., Fregly, B. J., & Pandy, M. G. (2009). Evaluation of predicted knee-joint muscle forces during gait using an instrumented knee implant. Journal of Orthopaedic Research, 27(10), 1326-1331.
Klein Horsman, M. D., Koopman, H. F. J. M., van der Helm, F. C. T., Prosé, L. P., & Veeger, H. E. J. (2007). Morphological muscle and joint parameters for musculoskeletal modelling of the lower extremity. Clinical Biomechanics, 22(2), 239-247.
Mundermann, A., Dyrby, C. O., D'Lima, D. D., Colwell, C. W.,Jr, & Andriacchi, T. P. (2008). In vivo knee loading characteristics during activities of daily living as measured by an instrumented total knee replacement. Journal of Orthopaedic Research, 26(9), 1167-1172. Nigg, B. M., & Herzog, W. (1999). Biomechanics of the
musculo-skeletal system (2nd ed.). Chichester: Wiley. Rasmussen, J., Tørholm, S., & de Zee, M. (2009).
Computational analysis of the influence of seat pan inclination and friction on muscle activity and spinal joint forces. International Journal of Industrial Ergonomics, 39(1), 52-57. 20 40 60 80 100 0 500 1000 1500 2000 M e di a l F o rc e (N )
Normal gait (n=5) Trunk sway gait (n=5)
20 40 60 80 100 0 500 1000 1500 2000 La te ra l F o rc e (N ) Gait cycle (%) 20 40 60 80 100 Gait cycle (%)