II
Université de Montréal
Title: Aiming to identify protein co-factors contributing to eIF4E’s oncogenic potential.
par Elma Ndreu
Program of Molecular Biology, Faculty of Medicine
Mémoire présenté en vue de l’obtention du grade de Maitrise en Biologie Moléculaire option générale
August 2017
III
Résumé en Français.
Le facteur eucaryotique d’initiation de la traduction 4E (eIF4E), impliqué dans ~30% des cancers, régule la croissance et la prolifération cellulaire, dans le cytoplasme : eIF4E promeut la traduction d’ARNm ayant des régions 5’UTR structurées ; dans le noyau : eIF4E promeut spécifiquement l’export d’ARNm via une voie d’export médiée par CRM-1, dépendante d’eIF4E, distincte de la voie d’export utilisée par la majorité des ARNm. Dans cette voie, eIF4E interagit avec la coiffe et une région structurellement conservée en 3’UTR, l’élément sensible à 4E (4ESE). De manière intéressante, le mutant d’eIF4E S53A, qui n’agit pas sur la traduction dépendante d’eIF4E mais inhibe l’export dépendant de celui-ci, empêche la transformation oncogénique des cellules, suggérant que le rôle d’eIF4E dans l’export d’ARNm est important pour sa capacité de transformation cellulaire.
Hypothèse : Les protéines cofacteurs se liant au site Ser-53 seraient cruciales pour le rôle d’eIF4E dans l’export, lui conférant son potentiel de transformation oncogénique.
L’objectif du projet était de mieux comprendre l’assemblage et l’export des eIF4E-mRNPs, en étudiant leur composition, et en utilisant le mutant S53A d’eIF4E afin d’identifier de potentiels candidats nécessitant cette sérine pour l’établissement du potentiel oncogénique d’eIF4E. Pour cette étude, des lignées stables de cellules U2OS exprimant soit 2FLAG-eIF4E, 2FLAG-S53A ou le vecteur contrôle ont été générées. Des immunoprécipitations avec des anticorps anti-FLAG sur les lysats cellulaires totaux ou nucléaires ont été menées. Ce projet a permis d’établir une première voie de compréhension quant à la nature de l’implication des motifs 4ESE sur l’export des ARNm qui les contiennent.
IV
Summary in English
The eukaryotic Initiation Factor 4E (eIF4E) regulates cell growth and proliferation via two independent functions. In the cytoplasm, eIF4E promotes translation of mRNAs with complex 5’UTRs. In the nucleus, eIF4E specifically promotes the export of mRNAs of oncogenes such as c-myc, via an eIF4E-dependent, CRM-1 mediated export pathway, distinct from the bulk mRNA export pathway. In this pathway, eIF4E interacts with both the m7G-cap and with a structurally conserved, 50 nucleotides long, 3’UTR 4E-Sensitive Element (4E-SE). Elevated eIF4E levels are found in ~ 30% of cancers, including Acute Myeloid Leukemia (AML). Interestingly, the eIF4E-S53A mutant, active in translation, does not function in export and is unable to transform cells, suggesting that eIF4E’s role in mRNA export is necessary to transform cells. These findings led us to the following
Hypothesis: Protein co-factors binding at the Ser-53 site are crucial for eIF4E’s role in export and for the oncogenic transformation potential of eIF4E.
The objectives were to achieve a better understanding of how eIF4E-mRNPs assembly and export works, examining the protein composition of nuclear mRNPs, and using eIF4E-S53A mutant to retain protein factors that require Ser53 as candidates for being strong drivers of eIF4E oncogenic potential. Studies into eIF4E and S53A eIF4E cell lines were undertaken. U2OS cell lines expressing wild type eIF4E and the S53A mutant were generated. IP studies with FLAG antibodies on the whole-cell and nuclear lysates of U2OS cell lines were carried. This project laid the groundwork for future insights into how biochemical activities of 4ESE-bearing mRNAs influence their export
V
Table of Contents and Figures
Résumé en Français. ... III Mots-clés: ... III Summary in English ... IV Keywords: ... IV List of Figures : ... VIII Figure 1: U2OS cells express 2FLAG-eIF4E at 72 hours post-transfection. ... VIII Figure 2: Expression levels of eIF4E export targets are similar between cell lines. ... VIII Figure 3: Protein levels of eIF4E export targets are slightly elevated in 4E cell lines. ... VIII Figure 4: Ample 2FLAG-eIF4E is in the nuclear fraction. ... VIII Figure 5: 2FLAG-eIF4E immunoprecipitated with high selectivity. ... VIII Figure 6: 2FLAG-eIF4E is selectively immunoprecipitated in the nuclear (and cytoplasmic) VIII fractions. The nuclear fractions expressed a good amount of transfected 4E. ... VIII La liste des sigles, la liste des abréviations : ... IX Dedication: For Eleonora, Elida and Heloise ... X Acknowledgements: ... XI
Introduction: ... 1
Short Background on eIF4E: Role(s) of eIF4E: ... 1
eIF4E’s role in translation has limited influence on oncogenic transformation: ... 1
Principles of mRNA export: ... 2
Co-ordination of export of target mRNAs: The regulon model: ... 2
eIF4E- dependent export follows a distinct export pathway: ... 3
eIF4E and cancer: Importance of targeting the eIF4EmRNP in future possible treatments of acute myeloid leukemia: ... 5
The S53A mutant of eIF4E does not promote mRNA export: ... 6
Aims of the project: ... 7
Methodology: ... 7
Plasmid constructs: ... 7
Assessing the quality of the isolated and purified DNA: ... 8
Cell culturing and cell maintenance of U2OS cell lines ... 9
Cell Transfections: ... 11
VI
Cell Collection and lysis ... 13
Cell collection by scraping: ... 13
Cell collection by trypsinization: ... 14
Number of cells collected for each experiment: ... 15
Cell lysis: ... 15
Assessing the protein concentration in the whole cell/cytoplasmic/nuclear extracts: ... 16
SDS-PAGE and Western Blot Analysis: ... 16
Antibodies used: ... 17
Western blot analysis for expression levels of eIF4E and eIF4E export targets: ... 18
Cell Fractionation: ... 19
Immunoprecipitation Analyses: ... 19
Results: ... 21
The isolated and purified DNA was free of contamination and free of undesired mutations that cause a change in the protein sequence. ... 21
Transfected U2OS cells express high levels of 2FLAG-4E or 2FLAG-S53A at 72 hours’ post-transfection. ... 22
Figure 1: U2OS cells express 2FLAG-eIF4E at 72 hours’ post-transfection. ... 24
Protein levels of eIF4E export targets are similar between cell lines at 3 days and 6 days’ post transfection: ... 24
The clones obtained do not all express the same levels of transfected eIF4E. ... 25
The Vector, 4E and S53A cell lines of the selected clones and pools expressed similar protein levels of eIF4E export targets. ... 27
Figure 2: Expression levels of eIF4E export targets are similar between cell lines. ... 29
Protein levels of eIF4E export targets are slightly elevated in 4E cell lines. ... 30
Figure 3: Protein levels of eIF4E export targets are slightly elevated in 4E cell lines. ... 31
The selected sets of clones and pools express ample transfected and endogenous eIF4E in their cytoplasm-free nuclear lysates. ... 32
Figure 4: Ample 2FLAG-eIF4E is in the nuclear fraction. ... 33
The FLAG-eIF4E mRNP was successfully immunoprecipitated in whole-cell lysates: ... 33
Figure 5: 2FLAG-eIF4E immunoprecipitated with high selectivity. ... 35
The FLAG-eIF4E mRNP was successfully immunoprecipitated in nuclear lysates. ... 35
... 37
Figure 6: 2FLAG-eIF4E is selectively immunoprecipitated in the nuclear (and cytoplasmic) fractions. ... 37
VII
Discussion: ... 38
Why study (eIF4E dependent) mRNA export? - Dysregulation of specific branches of mRNA export leads to specific changes in cell fate: ... 38
Impact of eIF4E’s role in export upon oncogenic transformation: ... 38
The S53A mutant is the key into the understanding of how the composition of the nuclear eIF4E mRNP leads to oncogenic transformation. ... 39
This project laid the groundwork for insight into the eIF4EmRNP: ... 39
Where do we presently stand? Importance of the project’s findings: ... 41
Why not use previously generated stable cell lines? – The importance of validations ... 41
Concluding remarks: ... 42
If everything had gone smoothly: expected results from a perfect world. ... 42
1. Expected Results from Validations: ... 42
2. Expected Results for the Affinity Purification - Mass Spectrometry studies: ... 43
Future directions: ... 45
Gaining the much-anticipated insight into the eIF4E-mRNP. ... 45
VIII
List of Figures :
Figure 1: U2OS cells express 2FLAG-eIF4E at 72 hours post-transfection. Figure 2: Expression levels of eIF4E export targets are similar between cell lines. Figure 3: Protein levels of eIF4E export targets are slightly elevated in 4E cell lines. Figure 4
:
Ample 2FLAG-eIF4E is in the nuclear fraction.Figure 5: 2FLAG-eIF4E immunoprecipitated with high selectivity.
Figure 6: 2FLAG-eIF4E is selectively immunoprecipitated in the nuclear (and cytoplasmic) fractions. The nuclear fractions expressed a good amount of transfected 4E.
IX
La liste des sigles, la liste des abréviations :
4E - Sensitivity Element - 4ESE. Acute Myeloid Leukemia – AML. Affinity Purification – AP.
Binding protein - BP.
Chromosome Region Protein 1 - CRM1. Endoplasmic reticulum – ER.
eukaryotic translation Initiation Factor 4E - eIF4E. Guanosine Triphosphate – GTP.
GTP-Associated Protein - GAP. Immunoprecipitation – IP.
Leucine rich pentatricopeptide repeat containing - LRPPRC Lysis Buffer B – LBB.
Mass Spectrometry – Mass Spec. messenger Ribonucleic Acid - mRNA.
messenger RNA ribonucleoproteins – mRNPs. methyl 7 guanosine - (m7G).
Non-denaturing Buffer 2- NT2 (buffer) Nuclear Pore Complex – NPC.
Nuclear Protein – Nup.
Radioimmunoprecipitation assay buffer – RIPA Buffer. Room Temperature- RT
Serine to Alanine mutation at position 53 - S53A.
UDP glucuronosyltransferase family 1 member A complex locus - UGT1A. Untranslated Sequence Elements for Regulation - USER (codes).
X
XI
Acknowledgements:
I would like to thank my Supervisor, Dr. Katherine Borden for this
opportunity and Drs. Trang Hoang, Pierre Thibault, Julie Mantovani, Pascale Le Therizien and Martine Raymond for their guidance and feedback.
I would like to thank my all my past and present Lab colleagues.
I would like to thank B. Culjkovic and H. Zahreddine for the gifts of plasmids and the set of transfected pools, as well as for their firm advice on the protocols.
I would like to thank Laurent Volpon for his help with the DNA amplification and sequencing and for providing the protein sequence of 2FLAG-eIF4E.
I would like to thank Heloise Chasse for her help with formatting and layout of figures and for her advice.
I would like to thank Jadwiga Gasiorek for her amazing work on mycoplasma detection. I would like to thank the IRIC genomic platform for their work on sequencing the plasmid.
Introduction:
Short Background on eIF4E: Role(s) of eIF4E:
The eukaryotic translation initiation factor 4E (eIF4E) regulates cell growth and proliferation via its roles in mRNA translation and mRNA export1–4. The role of eIF4E in export is
independent of its role in translation3–6. In the cytoplasm, eIF4E promotes translation of mRNAs
with complex 5’UTRs1,7. In the nucleus, eIF4E promotes the mRNA export3,4,7 of transcripts
encoding oncoproteins involved in cell growth and proliferation that contain a structurally conserved eIF4E sensitivity element 3,4. mRNA export is crucial for gene expression, as it brings
capped, spliced and polyadenylated mRNAs to the cytoplasm, so they may be translated by the ribosomes1,5,8,9.
eIF4E’s roles in translation and export are independent of each other3. Although certain
oncogenes, such as c-myc, are both a translation and export target of eIF4E10, other oncogenes
can be either an eIF4E translation target or an eIF4E export target. So far it has been tested that VEGF is an eIF4E translation target (as tested in) 10, while Cyclin D1 is an eIF4E export target3.
eIF4E’s role in translation has limited influence on oncogenic transformation:
The methyl guanosine cap at the 5’ end of mature, translatable mRNAs facilitates the interaction between the mRNA and the ribosome, which is the initial and rate limiting step in translation. eIF4E binds the methyl guanosine (m7G) cap and helps in associating the mRNA with the ribosome7,11.
It was thought that eIF4E’s role in translation affected its oncogenic transformation potential1,11.
2
levels of ODC upon eIF4E overexpression are due to eIF4E-mediated increased export of ODC mRNA3,10. Since c-myc is both an export and a translation target of eIF4E, increased levels of
c-myc upon eIF4E overexpression are due to both eIF4E-mediated increased export and translation of c-myc mRNA10.
Although eIF4E’s role in translation might have some impact in oncogenic transformation of cells1,11 this memoire focuses on the effect that eIF4E’s role in export on oncogenesis.
Principles of mRNA export:
Messenger RNA ribonucleoproteins, (mRNPs) are exported into the cytoplasm via the nuclear pore complex or the NPC12,reviewed in 8,9. The NPC is composed of the nuclear basket, the central
membrane traversing channel and the fibrils extending into the cytoplasm12, (reviewed in) 8,9.
Once the mRNP is ready for export, it associates with the nuclear basket, transits through the central membrane traversing channel and is released into the cytoplasm after interacting with the cytoplasmic fibrils12, (reviewed in) 8,9. At the cytoplasmic fibrils, mRNA export is modulated
by proteins associated with the NPC called nucleoporins, or Nups13,14. For example,
RanBP2/Nup358, the major component of the cytoplasmic fibrils, prevents the release of eIF4E- dependent export target mRNAs into the cytoplasm due to steric hindrance; while soluble RanBP1 promotes their release10,13,14.
Co-ordination of export of target mRNAs: The regulon model:
mRNA export can be explained by the RNA regulon model10,15–17. According to this model, the
post-transcriptional ribonucleoparticles (RNPs) involved in regulating similar cellular processes, such as cell growth and proliferation are concurrently exported15,17, (reviewed in) 3,8.
3
Export factors bind to cis-acting elements, often referred to as untranslated sequence elements for regulation, or USER codes, in the target mRNA sequence15,17, (reviewed in) 3,8. mRNAs
involved in similar cellular processes contain conserved USER codes15,17, (reviewed in) 3,8. An
mRNA sequence can contain more than one USER code, which can have complementary or competitive effects on the posttranscriptional regulation of the mRNA8.
eIF4E- dependent export follows a distinct export pathway:
Bulk mRNA export, including export of housekeeping transcripts such as β-actin 8,9,18 occurs
through the NXF1 export pathway. Although NXF1 directly binds its target mRNA, the TREX complex, UAP56, and Aly/Ref increase the affinity of NXF1 for the target mRNA8,9,18.
In contrast, the export of a subset of approximately 3500 mRNAs19, including mRNAs encoding
oncoproteins involved in cell proliferation and cell cycle progression3,10,19 occurs via the eIF4E
dependent export pathway; a branch of the Chromosome region 1, CRM1 mediated export pathway20. The association of mRNAs encoding oncoproteins, such as Cyclin D1, Pim-1,
c-myc, and ODC with eIF4E is directly related to increased export of these target mRNAs3,10.As
well eIF4E overexpression leads to increased protein levels of Cyclin D1, Pim-1, c-myc, and ODC10,21,22. The nuclear receptor CRM1 interacts with its target mRNPs via leucine rich nuclear
export signals (NES) found in the shuttling proteins of the mRNP20. CRM1 is a karyopherin
associated with RanGTP in the active state20. The target mRNP is released when RanGAP, aided
by RanBP1 or RanBP2, hydrolyzes the GTP, releasing the cargo from CRM18,10,20. CRM1 is
then recycled back into the nucleus to act in future round of export10,20. The eIF4E dependent
export pathway requires the association of eIF4E with both the methyl 7 guanosine m7G mRNA
4
The 4E Sensitivity element is the USER code in the eIF4E export target mRNAs:
Our lab identified a ~50 nucleotide-long, structurally conserved paired stem loop pattern in the 3’UTR of Cyclin D1, Pim-1 and other eIF4E targets, which we refer to as the 4E sensitive element, or 4ESE4. 4ESE renders Cyclin D1 mRNA and LacZ-4ESE (but not LacZ) constructs
sensitive to eIF4E dependent export3,4. Thus, eIF4E promotes the specific export of oncogenic
mRNAs which contain 4E-SE3. The eIF4E dependent export pathway requires the association
of eIF4E with both the methyl 7 guanosine (m7G) mRNA cap and with a specific USER code
sensitive to eIF4E1,3,4.
Our studies have shown that increased eIF4E levels oncogenically transform cells through the increased export of 4E-SE containing mRNAs3,10,21. Interaction between LRPPRC and the
4E-SE element present eIF4E export target mRNAs contributes to eIF4Es transforming abilities23.
Both the export of 4ESE containing mRNAs, such as CyclinD1, c-myc and NBS1, and their protein levels increased more than two-fold, upon overexpression of eIF4E and decreased upon eIF4E knockdown or inhibition10.
Furthermore, our group showed that eIF4E increases the export of its target mRNAs and thus promotes oncogenic transformation via the alteration of the cytoplasmic face of the NPC10.
eIF4E overexpression significantly alters the cytoplasmic face of the NPC10. Specifically,
RanBP2 levels are decreased and the remaining RanBP2 is delocalized from the nuclear rim to the nucleoplasm10. RanBP1 levels are increased without affecting its localization and Nup214
is delocalised from the nuclear rim to the cytoplasm, with no changes in expression levels10.
Expectedly, an inhibition of eIF4E leads to RanBP2 elevation, RanBP1 depletion and re-localization of RanBP2 and Nup214 at the nuclear rim10.
5
eIF4E and cancer: Importance of targeting the eIF4EmRNP in future possible
treatments of acute myeloid leukemia:
Up to 70% of eIF4E is located in the nucleus7, (reviewed in) 5. Overexpression of eIF4E is
sufficient to induce tumor formation in mice24 and leads to the acquirement of invasive
character, loss of contact inhibition and apoptotic rescue in cell culture3 (reviewed in) 5,8.
Elevated eIF4E levels are found in around 30% of cancers, including breast, prostate and acute myeloid leukemia (AML) reviewed in 5,8. eIF4E is overexpressed 3-8-fold and localised almost
entirely in the nucleus in M4 and M5 subtypes of AML compared to healthy myeloid cells and leukocytes25.
The French-American-British classification system classifies AML as 9 to 11 different subtypes of blood and bone marrow cancers characterised by the development of abnormal myeloblasts. The World Health Organization classifies AML subtypes according to cell profile at the time of diagnosis, also according to driving/recurrent genetic mutations -such as mutations in FLT3-ITD, NPM1 and cEBPa (reviewed in) 26 .
Despite such detailed classification and despite advances in research, subtypes of AML remain one of the most difficult to treat and are associated with poor prognosis16,21,25,26. Standard
Induction Chemotherapy, comprised of a combination of cytarabine and anthracycline remains the main treatment for Acute Myeloid Leukemia, despite the high toxicity associated with this treatment and the heterogeneity of the different subtypes of AML (reviewed in) 27. In the past,
few years, clinical trials have sought to establish new ways to treat patients with AML25,28.
Clinical trials aiming to establish whether ribavirin, an eIF4E inhibitor could be used to treat patients with AML, initially achieved successful clinical responses in some patients25,28.
6
of eIF4E25,28. Once ribavirin associates with the cap binding site of eIF4E, eIF4E cannot bind
the methyl guanosine cap of its target mRNA and thus cannot act in export or translation (reviewed in) 27. Unfortunately, there was eventual relapse in patients in the aforementioned
clinical trials, due to what was later determined as drug resistance via inducible drug glucuronidation28. In inducible drug glucuronidation, overexpression of Gli1, a sonic Hedgehog
transcription factor elevates the levels of UGT1A enzymes, which add glucuronic acid to ribavirin, as well as other drugs such as Ara-C28.
Discovering the mechanism by which drug resistance occurs is the first step in developing ways to overcome it. However, analysing other aspects of eIF4E and other ways by which eIF4E promotes oncogenic transformation is also a solid step in understanding the impact of eIF4E in cell growth and proliferation, as well as cancer development and in laying the foundation on developing future effective treatments that target eIF4E.
The S53A mutant of eIF4E does not promote mRNA export:
Interestingly, the S53A mutant of eIF4E is unable to promote mRNA export or to oncogenically transform cells, even though it acts in translation10,11,29. Our lab showed that overexpression of
this mutant did not affect the export of any of the previously mentioned eIF4E export targets10.
The S53A mutant cannot bind mRNAs in the nucleus and has no effect on the NPC10,11,29, even
though it does bind eIF4E target mRNAs in the cytoplasm and promotes their translation10,11,29.
This suggests that the Serine in position 53 plays an important part in the eIF4E’s role in mRNA export and oncogenic transformation. Since this mutant does not change the conformation of eIF4E and causes only minimal chemical perturbations near the neighboring amino acids10, it
7
can be thought that the serine 53 residue is important for the interaction of other co-factors, an interaction that would be important to eIF4E’s role in export and oncogenic transformation. Therefore, it was hypothesised that:
Protein co-factors binding at the Ser-53 site are crucial for eIF4E’s role in export and for the oncogenic transformation potential of eIF4E.
Aims of the project:
This project aimed to achieve a better understanding of how eIF4E mRNP assembly and export works, via examination of the protein composition of nuclear eIF4E mRNPs - and to use the S53A mutant of eIF4E to identify novel protein factors that require Serine in position 53 as candidates for being strong drivers of the oncogenic potential of eIF4E.
Affinity purification coupled to Mass Spectrometry would be used to test the hypothesis and to identify the potential eIF4E co-factors that contributed to eIF4E’s oncogenic potential. For this purpose, stable cell lines expressing a 2-FLAG-tagged wild-type eIF4E, a 2-FLAG-tagged S53A mutant of eIF4E, or a Vector containing the 2-FLAG sequence. The results are described below in the Results Section.
Methodology:
Plasmid constructs:
U2OS cells were transfected using pcDNA3.1 plasmid constructs, containing either a 2FLAG30
(DYKDDDDKDYKDDDDK) -tagged full length sequence for wild type eIF4E,connected with polylinker (GHPGSTSNGRQCAGIPRSDRSK) sequence, a 2FLAG30-tagged full length
8
sequence for the S53A mutant of eIF4E connected to the same polylinker, or a Vector control containing the 2FLAG30 tag and the polylinker sequence. Each plasmid construct contained an
ampicillin and a neomycin (G418) resistance antibiotic selection factors. The first one served to select the successfully transformed DH5A- E. coli cells for DNA amplification, isolation and purification; the second one served to select the U2Os cells which had successfully incorporated the plasmid.
DH5a E. coli cells were transformed with one of the above-mentioned plasmid constructs and grown overnight at 37°C on LB Agar plates, supplemented with 100μg/mL ampicillin.
One colony from each plate was then transferred to 5 mL of warmed LB media supplemented freshly with 100μg/mL for each sample and incubated in an automated shaker at 37°C for 5 hours. Each sample was then transferred either to 10 mL of LB media warmed to 37oC and
supplemented freshly with 100μg/mL ampicillin for the miniprep protocol, or to 300 mL of LB media warmed to 37oC supplemented freshly with 100μg/mL, where they were incubated
overnight (around 16 hours) in an automated shaker at 37°C.
The plasmid DNA was then isolated, purified, cleaned and sequenced by the IRIC Genomic Platform (https://genomique.iric.ca/) before U2OS cell transfection. (change
made: unnecessary details removed.)
Assessing the quality of the isolated and purified DNA:
DNA concentration was quantified by UV-spectrometry (ensuring the A260/A280 ratios were between the required ranges - an indication of pure DNA (A260/A280 ratios between 1.8 and 1.9 correspond to a DNA sample free of DNAse and other protein contaminants). The plasmids
9
obtained were cut with the EcoRI restriction enzyme, which linearized the plasmids. The linearized DNA was run on 1% Agarose gel.
The DNA obtained was sequenced by the IRIC Genomic Platform (https://genomique.iric.ca/) using the T7 primer as well as the following primers: 4E forward primer 1: 5’CCA TGG ACT ACA AAG 3’, Reference Number: KBorden 194548405, and 4E Reverse primer 1: 5’ CTC AGA AGG TGT CTT 3’ Reference Number: KBorden 19454840; both from IDT. These primers were designed to be complementary to the internal DNA sequence of 2FLAG-eIF4E. The DNA sequences were then translated virtually using the Translate Tool from Expasy Bioinformatics Resource Portal (http://web.expasy.org/translate/) and the results were virtually aligned to the protein sequence of human 2FLAG-eIF4E available in the lab using LALIGN sequence alignment tool from Expasy Bioinformatics Resource Portal (http://www.ch.embnet.org/software/LALIGN_form.html accessed regularly from September 2015 to September 2016).
Cell culturing and cell maintenance of U2OS cell lines
:All work regarding cell manipulation and maintenance was performed aseptically, as described in previous published work from our group3,4,10,21,31. Cell shape, confluency and
absence/presence of contamination were assessed on a regular basis by checking the samples under a microscope. Concerning cell shape, we looked for cells that were attached to the plate, slightly but not overly elongated, and not crowded or on top of each other. In terms of the medium, we looked for a clear, non-opaque medium and the absence of halo-like circular rings around clusters of cells. Cells were routinely tested for mycoplasma by PCR and agarose gel electrophoresis, with the appropriate positive and negative controls, as this method is one of the few ways to assess whether the cells are infected with mycoplasma with certainty.
10
Cell culturing and maintenance was carried according to Culjkovic et al., 2005, 2006 and 2012(3,4,10).
Cells were maintained in Dulbecco’s Modified Eagle Medium (DMEM) (Gibco BRL, Life Technologies, Grand Island, N.Y.) supplemented with 10% Fetal Bovine Serum (FBS) (Gibco BRL, Life Technologies) and 1% Penicillin/Streptomycin (P/S). Freshly prepared G418 solution in sterile magnesium and calcium-free PBS, was used as a selection marker for transfected cells at pre-optimized quantities of 10 mg G418 powder in PBS as described above, per 10 cm plate or 25 mg per 15 cm plate in PBS. Cells were maintained in an incubator at 37°C at 5% CO2.
Cells were passaged for maintenance by trypsinization upon reaching a confluency level of 70% to 80%, in order to avoid crowding of the cells in culture. When cells crowd in culture, expression of pro-apoptotic factors, such as Bcl6 - an eIF4E export target- is up-regulated regardless of eIF4E expression levels32. As well, cells living in a crowded environment
overexpress NF-κB, a stress marker, which can ultimately affect oncoprotein levels (reviewed in) 33. These are just a few examples of the problems with over confluent cells32,33.
Cells were seeded at 500 000 cells per 10 cm cell culture plate for each new passage. The number of cells was determined using a hemocytometer. Cells were collected by trypsinization as described above, and the contents were transferred to a clean, capped falcon tube. The contents were vortexed well. Immediately after vortexing, 50μL of cells suspended in media from each tube was transferred to a new Eppendorf tube and diluted by a factor a two using 40 μL of DMEM and 10 uL of Trypan Blue solution. This new mixture was vortexed well and 10 μL was immediately and evenly transferred to one of the two wells/sides of the clean glass hemocytometer with coverslip. The hemocytometer was then placed under a light microscope,
11
focusing the grid lines under a 10X objective. The unstained (live) cells in all four of the sets of 16 squares were counted carefully using a manual cell counter.
To find out the number of cells per mL of medium, the number of cells counted on all the four sets of 16 squares was added up and divided by four, in order to find the average number of cells in each slide. This average was then multiplied by two, to adjust for the dilution of the sample in DMEM + Trypan blue, then by a factor of 10 000 as recommended in the protocol, in order to determine the number of cells per 1 mL of each sample. (adapted from:
http://www.abcam.com/protocols/counting-cells-using-a-haemocytometer, Accessed regularly between July 2016-July 2017).
Cell Transfections:
The cell transfection protocol for this project was adapted from previously described protocols3,4,10,21,23.
U2OS cells were seeded at 250,000 cells, as determined by hemocytometer, per well of a six-well cell culture plate. Cells were seeded in DMEM with 10% FBS but without any Penicillin/Streptomycin, since Penicillin and Streptomycin hinder the formation of the transfection reagent and plasmid complex. Cells were maintained at an appropriate incubator at 37°C at 5% CO2 for 24 hours before transfection.
At the time of transfection, the cells in each well were transfected with 2.5μg of one of the respective 2FLAG-Vector, 2FLAG-4E or 2FLAG-S53A plasmid lines in 7.5μg of the broad-spectrum TransIT-LT1 Transfection Reagent Catalogue Number: MIR 2300 from Mirus. This transfection reagent was preferred over Lipofectamine 2000, because Lipofectamine is more toxic to cells and which results in high cell death.
12
The transfection reagent and plasmid DNA combo was prepared in Opti-MEM I Reduced-Serum Medium, Invitrogen, Thermo Fisher Scientific, Catalogue number 31985070.
A pre-optimized amount of 2 mg of G418 in PBS was added to each well 30 min after the transfection.
Two wells were transfected with one of the following plasmids: 2FLAG-Vector, 2FLAG-4E or 2FLAG-S53A in each 6- well plate. One 6-well plate was used for each of the first, second and third transfections, while three 6-well plates were used for the fourth transfection.
The quality of the transfection and the presence/amount of endogenous and transfected eIF4E in each transfected cell line was validated by Western Blot 72 hours’ post-transfection, prior to selecting cell lines for further experiments.
Cells were collected by trypsinization at 72 hours; 9/10th of the sample was collected and tested for eIF4E, NBS1 and c-myc expression by Western Blot (WB), using actin as loading control. 1/10th was plated at a 10 cm plate in 10 mL of complete DMEM supplemented with 10mg of G418, for the purpose of generating and selecting clones.
After each transfection, cells were maintained as described in Culjkovic et al. 2012(10), using
complete DMEM - that is DMEM supplemented with 1% Pen/Strep and 10% Fetal Bovine serum, as described above. G418 was added to cells at every passage, at a pre-optimized amount of 10 mg per 10 cm plate, or 25 mg per 15 cm plate.
Selection of transfected clones and pools:
Clones were selected using complete DMEM. G418 (neomycin) was added freshly to cells at every passage, at a pre-optimized amount of 5 mg of powder G418 in PBS, as described above, per 10 cm plate. The selection process started at around two weeks’ post-transfection. For each
13
line, the remaining cells after selecting clones were pooled and transferred to a new 10 cm cell culture plate (these were the pools), where they were maintained as described above.
Cell Collection and lysis
:In the beginning of the project, the cells were collected by mechanical scraping, unless part of the cells used were sub cultured for cell maintenance. Cell collection by trypsinisation was a better method for cell collection for this project, and therefore it was the preferred method for cell collection.
Cell collection by scraping:
Cells were washed twice in cold, sterile and Mg2+ and Ca2+ free PBS. PBS without calcium and
magnesium ions is used to prevent cells from adhering to the plate when cells are being collected or passaged. Residual Mg2+ and Ca2+ also interfere with Radioimmunoprecipitation assay
(RIPA) buffer activity (Lab colleagues, personal communication).
The RIPA buffer (50 mM Tris pH7.4, 150 mM NaCl, 2 mM EDTA, 0.5% Na deoxycholate, 0.1% SDS, 50 mM Sodium fluoride, 1% NP-40) was handmade and freshly supplemented with KKM, a mixture of various protease inhibitors including at 1μL KKM per 1mL of RIPA. For cells in a 6 - well plate, a pre-optimized volume of 200μL RIPA buffer for 2 wells transfected with the same cell line was used. The buffer was first deposited in one well, cells in that well were scraped mechanically, and then the contents of the first well were transferred to the second well and the mechanical scraping process was repeated, 400-600μL RIPA buffer were used per 10 cm plate. This method combines cell collection and cell lysis.
14
Cell collection by trypsinization:
The medium was aspirated and the plates were washed twice with cold, sterile, Ca2+ and Mg2+
free PBS, in order to remove any residual media. Residual media and calcium and magnesium ions interfere with trypsin activity and will cause the cells to re-attach onto the plate (lab colleagues, personal communication), when the purpose is to lift the cells from the plate. The cells were collected using pre-determined amounts of 250μL of trypsin solution per well for a 6 - well plate, 1mL trypsin per 10 cm plate, or 2.5 mL trypsin per 15 cm plate. The trypsin solution was made at a concentration of 0.05% (wt/vol) of in 1X calcium and magnesium free PBS
Cells were incubated in trypsin at 37°C and 5% CO2 for 90 seconds if on a 6-well plate, 3
minutes if on a 10-cm plate, or for 3-5 minutes if on a 15-cm plate, just until cells come off the plate in a single layer, taking care to not over-trypsinize. Over-trypsinized cells have lysed membranes, release DNA and clump. A white clump at the bottom of an otherwise clear trypsin solution is a clear indication of over-trypsinized cell(lab colleagues, personal communication). Cells should be incubated in trypsin for only a few minutes, just until they start to detach from the plate in a monolayer.
Over-trypsinization damages and/or kills cells. It is important to not stress, nor damage cells during collection, as it would negatively affect the Immunoprecipitation and Western Blot experiments. Over-trypsinization can break down proteins, as trypsin is a protease and can correlate to up-regulation of stress markers, as protein breakdown is a sign of cell stress (lab colleagues, personal communication).
Cells were re-suspended in fresh medium in order to inactivate the trypsin and to collect the cells. After uniformly suspending the cells in fresh medium, each cell line/clone/pool was
15
transferred to a falcon tube and centrifuged at 256 x g for 5 minutes at 4°C. After centrifuging, the media was removed and the pellet was washed twice in sterile Ca2+ and Mg2+-free PBS,
centrifuging at 256 x g for 5 minutes at 4°C.
Number of cells collected for each experiment:
Cells from one 10 cm cell culture plate were collected per cell line, first at 80% confluency, then at 50% confluency, so that I could collect while cells were still on the growing part of the growth curve, that is cell growth had not plateaued, when testing for protein levels of eIF4E and eIF4E export targets by Western Blot.
For stand-alone Cellular Fractionation experiments (such as shown on Figure 4), cells from five 10 cm cell culture plates per cell line per experiment were collected at 50-60% confluency. Cells from three 15 cm cell culture plates per cell line per experiment at 80% confluency per cell line were collected for the Immunoprecipitation experiment on whole cell lysates, while cells from five or six 15 cm cell culture plates per cell line per experiment at 70% confluency per cell line were collected for the Immunoprecipitation experiments on cytoplasmic/ nuclear lysates (Fractionation IP).
Cell lysis:
As mentioned, the cells collected by trypsinization were lysed in RIPA buffer freshly supplemented with 1μL KKM per 1 mL RIPA, at a quantity of 2X the volume of the pellet. Whether collected by mechanical scraping or trypsinization, cells in RIPA were subjected to two 5-second long rounds of sonication at amplitude of 17%, which lyses the nuclei (lab colleagues, personal communication). Samples were incubated on ice for 30s between rounds.
16
The lysate was then incubated on rotation at 4°C for 30 minutes to complete the lysis process. The lysate was then centrifuged at 10,000 x g for 10 minutes at 4°C. The supernatant, which is the whole cell protein extract, was transferred to a new, clean tube.
Assessing the protein concentration in the whole cell/cytoplasmic/nuclear extracts:
The protein concentration of the lysates would be measured by Bradford Assay, using freshly made A (protein concentration of 300μg/mL) to I (pure water) standards using Serum Albumin Standard (Thermo Fisher Scientific, Product #23210) at a stock concentration of 2mg/mL. For troubleshooting purposes, three different dilutions of Standard D were made and their concentration was measured.
As well, the protein concentration of aliquots of the RIPA buffer and PBS used for cell lysis and collection, each containing different amounts of KKM was assessed. This was done for the purpose of discovering whether there were any protein contaminants in RIPA, or whether the amount of KKM affected the reading of the protein concentration.
SDS-PAGE and Western Blot Analysis:
15 of 20μg of whole cell (testing for protein levels of eIF4E and eIF4E export targets), or cytoplasmic/nuclear (to validate the Cell fractionation/IP) protein extracts were run on 10% or 12% polyacrylamide, to test whether a slight difference in the quantity of polyacrylamide made a difference in the results obtained. A slightly higher percentage of acrylamide results in a greater physical separation between the protein bands of different molecular weights, resulting in easier separation of different sections of the PVDF membrane before probing with different
17
sections of the membrane with different antibodies. The gels were run at 97V for 17 minutes and at 150V for 40-45 minutes.
Proteins were transferred on PVDF membrane via wet transfer electro blotting at 100V for 90 minutes or semi-dry transfer (Bio-Rad kit and machinery) electro blotting at 25V for 16 minutes.
Antibodies used:
The following antibodies were used in this project.
Monoclonal anti-eIF4E raised in mouse, BD Transduction Laboratories, Catalogue number 610270, at 1:2000; monoclonal anti-FLAG M2 raised in mouse, Sigma Aldrich, Catalogue number F3165 at 1:3000, then 1:5000.(data not shown);monoclonal anti-cmyc raised in rabbit, Abcam, Catalogue number ab 32072 at 1:5000; monoclonal anti-cmyc raised in mouse, Santa Cruz, Catalogue Number sc40, at 1:250- poor quality, switched to the anti-cmyc antibody from Abcam; monoclonal anti-cyclin D1 raised in rabbit, Abcam, Catalogue number ab 134175 at 1:2000; polyclonal anti-NBS1 raised in goat, Santa Cruz, Catalogue Number sc8580, at 1:1000; polyclonal Mcl1, raised in rabbit, Santa Cruz, Catalogue Number sc819 ;polyclonal anti-Bcl6, raised in rabbit, Santa Cruz, Catalogue Number sc858. Monoclonal anti-beta Actin, raised in mouse, Catalogue number A5441-.2ML first at 1:5000, then at 1:10 000 and monoclonal anti-Alpha Tubulin raised in mouse, Catalogue number T5166-.2ML, first at 1:5000, then at 1:10 000 both from Sigma Life Sciences were used to probe for Actin or Tubulin respectively, which were used as loading controls. Monoclonal anti-Hsp 90 α/β, raised in mouse, Santa Cruz, Catalogue Number sc13119 and Polyclonal anti-Lamin A, raised in rabbit, Sigma Life Sciences, Catalogue number: L1293.
18
Monoclonal anti-cytochrome C, raised in mouse, BD Pharm, Catalogue Number 556433 at 1:1000.
Polyclonal anti-RNAPII, raised in rabbit, Santa Cruz, Catalogue Number sc899 at 1:2000. Polyclonal anti-Sc 35, raised in rabbit, Santa Cruz, Catalogue Number sc28720 at 1:2000. Monoclonal anti-HIS 2B raised in mouse, Abcam, Catalogue Number ab52484 at 1:5000. All antibodies solutions were stored at 4°C and when used, diluted in 1X freshly made TBS-T (0.1% Tween-20) with 5%(wt/vol) fat-free dry milk powder.
Western blot analysis for expression levels of eIF4E and eIF4E export targets:
The transfected cells, clones and pools were tested by Western Blot for expression of endogenous and transfected eIF4E. The pre-selected sets of pools and the pre-selected set of clones were probed for protein expression levels of eIF4E and the for the following eIF4E export targets: NBS1, c-myc, Cyclin D1, Bcl6 and Mcl1.
In all the Western Blot analyses, the samples were incubated for 12-24 hours in an automated shaker at 4°C in primary antibodies and for about 90 minutes in an automated shaker at room temperature (RT) in the appropriate secondary antibodies at 1: 20 000. The Super Signal West Pico chemiluminescence kit from Pierce was used for signal detection.
The Immunoprecipitation products were probed with lamin, and/or tubulin (as described above). They were used as loading controls, as these are housekeeping proteins that are not affected by expression levels of eIF4E. Lamin and tubulin were also used as negative controls for the Immunoprecipitation analyses.
19
Cell Fractionation:
Cell Fractionation was carried out as described previously21,22,34. After being collected by
trypsinization, as described above, each sample was suspended in Lysis Buffer B (LBB), (140 mM NaCl, 10 mM Tris [pH 8.4], 1.5 mM MgCl2, 0.5 % NP-40, and supplemented freshly with
1μg/mL KKM). The samples were centrifuged at 4°C at 1000 x g for 3 minutes the supernatant (cytoplasmic fraction) was transferred to a clean tube. Afterwards, 1-2 mL of LBB, as well as one tenth the volume of the sample of detergent (3.3% sodium deoxycholate, 6.6% Tween 40) was added to each sample. The samples were incubated on ice for five minutes in order to complete the lysis process and a centrifuged for 3 minutes at 1000 x g at 4°C. This was to separate the nuclear fraction from the post nuclear fraction (made up of ER and Golgi). The post nuclear fraction was added to and analysed together with the cytoplasmic fraction. The nuclear fraction was washed twice in LBB and two rounds of centrifugation as described above. The nuclear and cytoplasmic fractions were kept on ice during the fractionation procedure and immediately used in Immunoprecipitation and/or Western Blot experiments.
The quality of the fractionation was validated by Western Blot, by probing both the nuclear and the cytoplasmic fractions for the following selection of nuclear and cytoplasmic proteins: Lamin, Tubulin, cytochrome c and GAPDH (data shown), as well as RNAPII, Histone 2B and Sc-35 (data not shown).
Immunoprecipitation Analyses:
The immunoprecipitation analyses were adapted from the protocols in previously published papers10,23.
20
NT2 non-denaturing buffer (0.3 M NaCl, 50 mM Tris-HCl (pH 7.4), 1.5mM MgCl2, 0.05% (v/v)
NP-40, 1x protease inhibitors (KKM, added freshly at 1μg/mL)
Whole cell or cytoplasmic/nuclear lysates (right after obtaining cytoplasm-free nuclei through Cell Fractionation) were precleared on rotation at 4°C for 30 minutes in 50μL of Protein A/G plus Agarose bead slurry (Santa Cruz Biotechnology, 2067S, Ref. 12/2016) per 1mL of sample and incubated on rotation at 4°C for 14-16 hours in 50μL of Anti-FLAG M2 Affinity Gel agarose bead slurry (Sigma Life Sciences, A2220-5 ML). The beads were blocked in 0.5% Bovine Serum Albumin (BSA) in NT2 buffer at room temperature for 10 minutes and washed in NT2 buffer, just prior of pre-clearing and incubating the samples.
After overnight incubation, the samples were centrifuged at room temperature at 500 x g for 3 minutes. The supernatant was saved and its concentration was adjusted to 1mg/mL. The IP (bead slurry after overnight incubation) of every sample was incubated with 1mL of NT2 buffer supplemented freshly with KKM (at 1μg/mL) and Heparin (at a concentration of 1mg/mL) and incubated on rotation at room temperature for 10 minutes.
Heparin is used for the immunoprecipitation of positively charged proteins because it is a polyanion35. Heparin also interacts with polysaccharides, such as the agarose beads used in the
immunoprecipitation experiment(s)35. After incubation with Heparin, all the samples were
washed five times in NT2 buffer supplemented with Heparin, centrifuging as described above in each wash, then eluted in 2X SDS Laemmli buffer, made from 6X SDS Laemmli buffer and NT2 Buffer,at 90°C for 5 minutes, then centrifuged as described above. The Input, Supernatant, and IP were run on SDS-PAGE, the samples were electro blotted on PVDF membranes by semi-dry transfer and probed with: anti-lamin and anti-tubulin as described above, as well as: Monoclonal anti-eIF4E raised in rabbit, Cell Signalling Technologies, 2067S, Ref 12/2016, Lot
21
6 at 1:1000 and monoclonal anti- eIF4E-Binding Protein 1 (4E-BP1), raised in rabbit, Cell Signalling Technologies, 96445, Ref 01/2017, Lot 10 at 1:1000.
Results:
The isolated and purified DNA was free of contamination and free of undesired
mutations that cause a change in the protein sequence.
The concentration of the obtained DNA was measured by UV Spectrometry. The resulting UV spectra and their A260/A280 ratios were obtained. Their A260/A280 ratios were between the required 1.8 and 1.9 - indications of no protein contaminants. The spectra of each DNA sample also indicated the DNA was protein-free.
Cutting the plasmid with the EcoRI restriction enzyme linearized the plasmid, as the plasmid contains only one EcoRI site. The insert was cut out to make sure the size was okay. Running the linearized plasmid in 1% Agarose gel shows a band at 3.2kB, which is the size of the plasmid. The DNA of each plasmid was successfully sequenced using the T7 forward primer the 4E Forward 1 primer and the 4E Reverse 1 primer. The T7 primer is a standard forward primer and the primers mentioned above were designed complementary to the internal sequence of eIF4E. I was able to deduce the entire sequence of eIF4E (whether wild type or mutant) by combining the results obtained using each primer. Though the entire sequence of eIF4E was deduced using the T7 primer alone, the self-designed primers helped to clearly deduce the complete sequence of 2FLAG-eIF4E. Translating these obtained sequences virtually using the Translate Tool from Expasy Bioinformatics Resource Portal (http://web.expasy.org/translate/ accessed September 2015-February 2016) yielded three virtual potential protein sequences (reading frames), one of which was the correct reading frame showing the protein sequence of 2FLAG+ linker sequence
22
(for the 2FLAG-Vector plasmid), or of 2FLAG+linker sequence + wildtype or S53A mutant of eIF4E (for the 2FLAG-4E, or 2FLAG-S53A plasmids).
Aligning these obtained protein sequences for the given 2FLAG-4E sequence confirmed that the 2FLAG and linker sequence were present and free of mutations in all plasmid lines, that the eIF4E was the same as the given sequence for the 2FLAG-4E plasmid and that the Serine to Alanine mutation at position 53 (of eIF4E, that is position 91 of the 2FLAG+linker+4E sequence) was the only mutation in the 2FLAG-S53A plasmid.
Transfected U2OS cells express high levels of 2FLAG-4E or 2FLAG-S53A at 72
hours’ post-transfection.
To test the transfection, 9/10th of the sample of each of the transfected cells was collected at 72 hours’ post-transfection, mixing the samples of the two wells transfected with the same type and stock of plasmids. The whole-cell protein lysates from these cells were tested for expression of transfected eIF4E by Western Blot.
For the fourth transfection, the cell lines transfected with the 2FLAG-4E and 2FLAG-S53A plasmids clearly expressed the transfected eIF4E. The expression levels of the transfected eIF4E were 2X to 3X of the endogenous expression levels of endogenous eIF4E at 72 hours’ post transfection, mimicking eIF4E levels in oncogenically transformed cells (Figure 1A).
At this point in the stable cell line generation, within each set, the expression levels of endogenous eIF4E were similar between the Vector, 4E and S53A cell lines and the expression levels of the transfected eIF4E were similar between the 4E and S53A cell lines (Figure 1A).
23
The protein levels of actin, a housekeeping protein used as a loading control, were similar between all the cell lines within each set. This confirms that the same amount of protein lysate was loaded onto each sample (Figure 1A).
This experiment was repeated after another 72 hours, that is 6 days’ post-transfection, and the results obtained were the same as the results described above (data not shown, however results were the same as Figure 1A). These transfected cells were successfully expressing the transfected, 2FLAG tagged eIF4E at both 3 days and 6 days’ post-transfection, and since they were growing in culture without any difficulties and without any detectable contamination, as confirmed by Mycoplasma testing and absence of halo like structures on groups of cells which is an indication of bacterial contamination. Therefore, it was determined that these newly transfected cells were an appropriate starting point for generating stable cell lines.
24
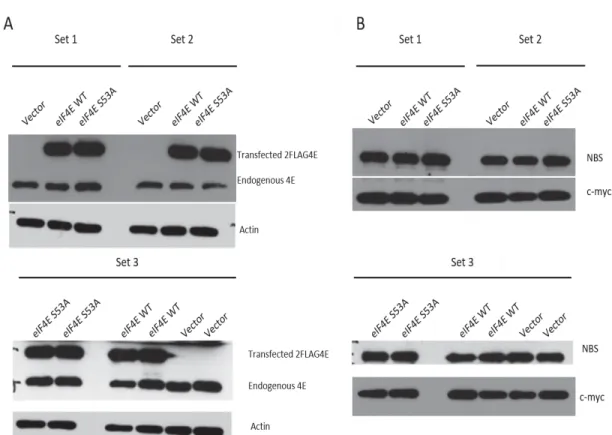
Figure 1: U2OS cells express 2FLAG-eIF4E at 72 hours’ post-transfection.
Western Blot of U2OS cells transfected with a plasmid containing a 2FLAG-Vector, 2FLAG-eIF4E (wt) or 2FLAG-S53A (mutant). Actin is used as a loading control. A: Cells express 2X to 3X the protein levels of transfected eIF4E versus endogenous eIF4E at 72 hours’ post-transfection. B: The PVDF membranes were stripped and re-probed for NBS and c-myc. The cell lines express similar levels of NBS1 and c-myc within each set at 72 hours’ post-transfection. Two lanes of the same sample were loaded for each cell line in Set3.
Protein levels of eIF4E export targets are similar between cell lines at 3 days and 6
days’ post transfection:
Previous findings, for example 10,21,22 show that protein levels of eIF4E export target mRNAs
increased when wild type eIF4E, but not the S53A mutant were continuously overexpressed in generated stable cell lines for 3T3 or U2OS cells10,21,22.
To see if overexpression of wild type eIF4E, but not of the S53A mutant, resulted in increased protein levels of eIF4E export targets at 3 days or 6 days after the transfection, cells from the
25
fourth transfection were tested for protein expression levels of NBS1 and c-myc, by stripping and re-probing the membranes that were probed for eIF4E and Actin (Figure 1B).
Though the c-myc levels were slightly elevated for the 4E cell lines for set 1 and set 3, when compared to the Vector and the S53A cell lines, this difference was very small. The levels of NBS1 were similar between Vector, 4E and S53A cell lines (Figure 1B). This is likely due to the overexposure of the blots, so that differences can no longer are detectable due to film saturation.
These results were not similar to the results described in Rousseau et al. (1996)22 and
Culjkovic-Kraljacic et al. (2012)10. Nevertheless, these results were not discouraging, since the transfected
eIF4E had been expressed for only a short time. Therefore, it was decided to generate clones and pools from these transfected cells and subsequently test these pools for expression levels of eIF4E export targets.
The clones obtained do not all express the same levels of transfected eIF4E.
Clone selection and testing for eIF4E expression levels by Western Blot started at around two weeks’ post transfection. The selected clones were tested multiple times soon after these clones reached an 80% confluency level in one well of a 6-well plate or in a 10-cm plate. eIF4E levels, both endogenous and transfected, were different and uneven between the different clones within a set. Clones were tested anywhere between 2 to 4 times each, depending on how soon the clone was available for picking and testing. Certain clones were losing expression of transfected eIF4E, while in other clones the transfected eIF4E took over and caused loss of expression of endogenous eIF4E. The following clones: V2, V8, 4E3, 4E6, 4E7, 4E9 and S53A5 expressed
26
the most similar levels of endogenous and transfected eIF4E between them, and were thus pre-selected and re-tested for expression of eIF4E by Western Blot.
After retesting these pre-selected clones a few times, it was observed that the following set: V2, V8, 4E7 and S53A5 were stably expressing similar levels of endogenous and transfected eIF4E (for 4E7 and S53A5), the best result for eIF4E expression for clones. As well, the expression levels of transfected eIF4E were stably at least equal to the expression of endogenous eIF4E for 4E7 and S53A5. Therefore, this set of clones was stably expressing transfected eIF4E at a satisfactory level and was thus chosen for Cell Fractionation and Immunoprecipitation experiments.
Initially, three sets of pools were generated from this fourth transfection, which were named respectively pools 1, pools 2 and pools 3.
The pools 1 set was contaminated by Mycoplasma early on. This set was discarded, as many cell lines were available for selection for further experimentation at the time. These other cell lines risked contamination whiles the pools 1 set were treated with plasmocin.
The pools 2 and pools 3 sets were tested for the expression of endogenous and transfected eIF4E by Western Blot a few times. When tested for expression of eIF4E, these pools stably expressed endogenous and transfected eIF4E, where the expression levels of transfected eIF4E were at least equal to the expression of endogenous eIF4E suggesting that there was no overexpression. This was the best eIF4E expression levels I could get on the long term. As at 72 hours’ post transfection, eIF4E expression levels were similar between the cell lines within the set. These two sets of pools were also selected for Cell Fractionation and Immunoprecipitation experiments.
27
In order to compare my pools with established pools in the lab, the two sets of pools were compared to one set of pools, consisting of one Vector, one 4E and one S53A cell line stably generated by my lab colleagues, named Pools 2016. This set of pools stably expressed endogenous and transfected eIF4E. The protein levels of endogenous and transfected eIF4E were similar between the Vector (endogenous eIF4E only), 4E and S53A cell lines in this set of pools. The protein levels of transfected 4E were at least equal to the expression of endogenous eIF4E in this set as well. Although the expression was not good, this was the best set I could get. Therefore, this set of pools stably expressing transfected eIF4E was selected for Cell Fractionation and Immunoprecipitation experiments.
The Vector, 4E and S53A cell lines of the selected clones and pools expressed similar
protein levels of eIF4E export targets.
To test whether overexpression of wildtype eIF4E, but not of the S53A mutant, results in overexpression of eIF4E export targets, the selected sets of pools and clones described above were tested for the protein expression levels of a selection of eIF4E export targets by Western Blot (Representative results on Figure 2). This is an important validation step before proceeding with the Immunoprecipitation studies, as it is a way to confirm that the S53A mutant of eIF4E is unable to function in export and that there are no problems with the wildtype or vector clones. The assumption in this validation is that increased levels of wildtype eIF4E (but not of the S53A mutant) results in increased export of eIF4E target mRNAs, resulting in higher levels of these transcripts in the cytoplasm and thus more protein produced.
The selected set of clones and pools were tested for various eIF4E export targets, namely: NBS1, Bcl6, Mcl1, c-myc and Cyclin D 1(Representative results on Figure 2). The confluency and
28
passage numbers were p10 to about p40 after transfection. As the set of clones (V2, 4E7 and S53A5) was getting old, new vials of frozen samples of the same lines were defrosted. The cells in frosted vials for the set of clones did not survive in culture after defrosting, despite taking good care of the cells and following the advice from lab colleagues. Frozen vials of cell samples for the set of pools survived the defrosting process and were retested for protein levels of the eIF4E export targets for passage numbers p7 till about p26 post transfection.
This validation was conducted by previous studies10,21,22. In these papers, protein levels of eIF4E
export targets were elevated in the cell lines transfected with wild type eIF4E, when compared to the cells transfected with vector or the S53A mutant cells10,21,22.
For this project, the Vector, 4E and S53A cell lines of the selected clones and pools expressed similar protein levels of eIF4E export targets (Figure 2). This was the result obtained when conducting this experiment on Pools 2, Pools 3 (data not shown), Pools 2016 and the selected set of clones (Representative results on Figure 2) after repeating the experiment multiple times. This is probably because my eIF4E overexpression was less than two-fold for both S53A and wildtype eIF4E. Technical problems with the SDS-PAGE and Western Blot experiments were an occurrence early in the project. These technical problems were relatively easy to detect and correct, and are not counted in the validation of the protein levels of eIF4E mRNA export targets in the transfected cells. It should be noted that attention was always paid to confluency, passage number, trypsin levels and additional experimental handling issues. The experimental technique was improved with practice. A 2% change in the polyacrylamide content of the gels resulted in better separation of the proteins of different molecular weights. However, the % of cell confluency at collection (whether 50-60% or 70-80%), or loading 15 or 20 μg of protein lysate
29
per sample did not ultimately result in obtaining the required validations. This highlighted some issues that we did not discover, despite taking many troubleshooting steps.
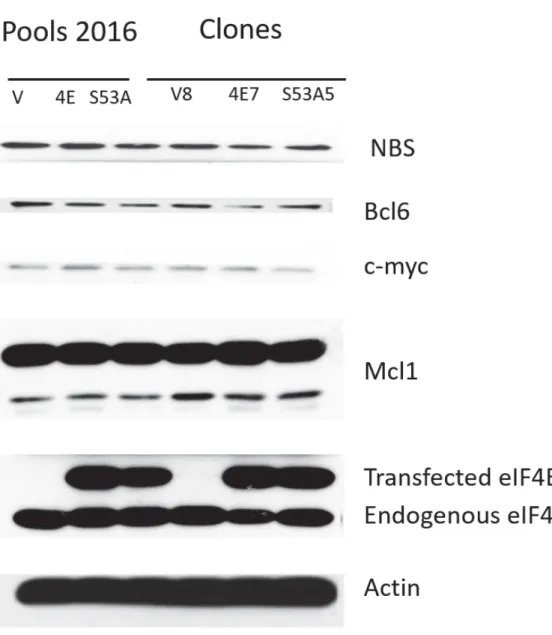
Figure 2: Expression levels of eIF4E export targets are similar between cell lines.
Western blots of protein levels of eIF4E and eIF4E export targets in the pre-selected sets. Expression levels of eIF4E export targets were similar between Vector, 4E and S53A cell lines within each set for all sets.Because of the 2FLAG and linker sequences, transfected eIF4E is at a higher molecular weight than endogenous eIF4E. The experiment was repeated multiple times on the selected cells of clones and pools. Typical representative results are shown. Results are due to lack of overexpression of eIF4E.
30
Protein levels of eIF4E export targets are slightly elevated in 4E cell lines.
Technical problems aside, after repeatedly testing the selected sets of clones and pools for protein levels of eIF4E export target mRNAs I was not able to fully validate the work from previous studies10,21,22. Most of the time, the protein levels of the eIF4E export targets (mostly
NBS, c-myc, Bcl6, Mcl1) were similar between the Vector, 4E and S53A cell lines probably because my eIF4E overexpression was not more than endogenous levels (Figure 2). After some time, an increase in the protein levels for c-myc, Cyclin D1, Mcl 1 and NBS 1 in the 4E cell line was observed, especially when compared to the Vector cell line (Figure 3). The difference in the protein levels of the targets between the 4E and S53A cell lines was more obvious in some cases. After some time, an increase in the protein levels for c-myc, Cyclin D1, Mcl 1 and NBS 1 in the 4E cell line was observed, especially when compared to the Vector cell line (Figure 3). The difference in the protein levels of the targets between the 4E and S53A cell lines was slight, and could be interpreted as insignificant (Figure 3). However, some of the experiments were still difficult to interpret because of degradation in the overexpressed eIF4E in the previously generated Pools 2016 set (Figure 3A). Note that the levels of the loading control, respectively tubulin or Hsp90 were similar between the Vector, 4E, and S53A cell lines within each set (Figure 3). The Pools 2 set was excluded from further analysis (Figure 3B), since the expression levels of the eIF4E export targets were not like previously described results10,22,23. Thus, it was
decided to focus on the first aim and analyse the transfected eIF4E-mRNP, by focusing on 4E cell lines and Vector controls.
31
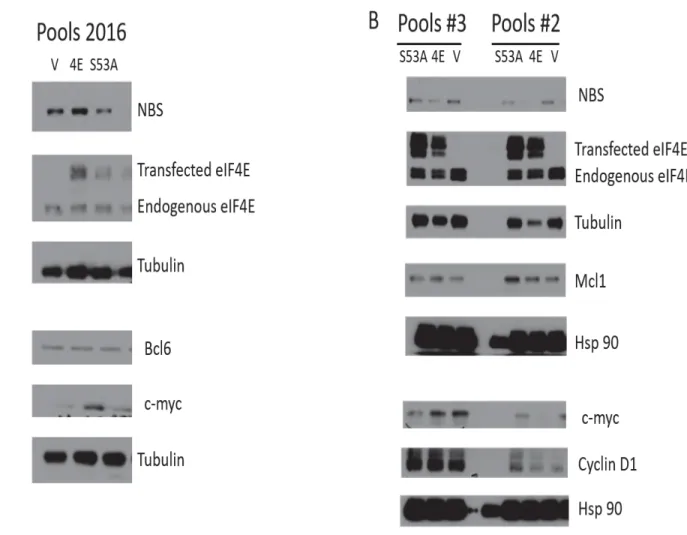
Figure 3: Protein levels of eIF4E export targets are slightly elevated in 4E cell lines.
Western Blot of U2OS cells transfected with a 2FLAG-Vector, 2FLAG-eIF4E or 2FLAG-S53A. Tubulin
and Hsp90 are used as a loading control. A: For the Pools 2016, the protein levels of NBS, Bcl6 and c-myc are (slightly) elevated in the 4E cell line, when compared to the Vector cell line. B: For Set3, the protein levels of Cyclin D1, Mcl1, and c-myc are (slightly) elevated in the 4E cell line, when compared to the Vector cell line. Random expression levels of the targets, and uneven tubulin levels for Set 2.
32
The selected sets of clones and pools express ample transfected and endogenous
eIF4E in their cytoplasm-free nuclear lysates.
Since the central aim of the project was to analyse the nuclear eIF4EmRNP, it was necessary to first obtain cytoplasm-free nuclear lysates from the selected cell lines and to validate whether the nuclear fraction contained sufficient eIF4E.
To carry out these studies, cytoplasmic and nuclear fractions of the pre-selected sets of clones and pools described above were generated. The protein levels of endogenous and transfected eIF4E in the cytoplasmic and nuclear fractions of the cell lines by Western Blot (Figure 4). Because transfected eIF4E contains the 2FLAG sequence and the linker sequence, transfected eIF4E is at a higher molecular weight than endogenous 4E, which is essential in distinguishing between the transfected and endogenous eIF4E. The nuclear fractions contained ample transfected and endogenous eIF4E, compared to the cytoplasmic fractions for all sets (Figure 4), in keeping with previous finding that up to 70% of eIF4E is located in the nucleus5–7. Though
it does not seem that Pools 2016 express more cytoplasmic than nuclear eIF4E, probing the nuclear fraction input while validating the nuclear IP (Figure 6) showed that eIF4E levels are similar between the nuclear and cytoplasmic fractions.
Probing both cytoplasmic and nuclear fractions for cytoplasmic and nuclear proteins validates the quality of the fractionation and confirms that the Cell Fractionation protocol used yielded cytoplasm-free nuclei (Figure 4).
33
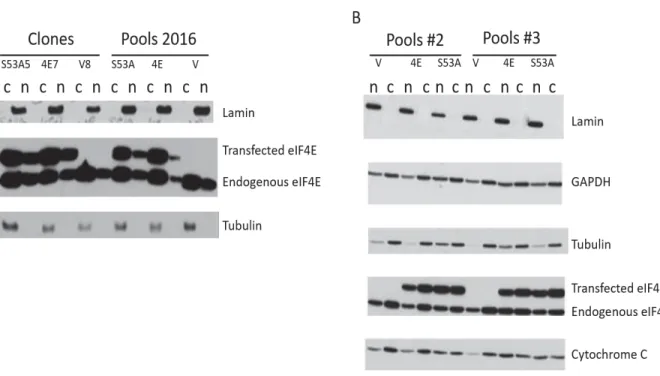
Figure 4: Ample 2FLAG-eIF4E is in the nuclear fraction.
Validation of Cell Fractionation experiments of the selected sets. The nuclear fraction expresses higher levels of transfected eIF4E than the cytoplasmic fraction. Because of the 2FLAG and linker sequence,
transfected eIF4E is at a higher molecular weight (35kDA) than endogenous eIF4E (25kDa), which is why transfected eIF4E is just above endogenous eIF4E for cell lines in both panel A and panel B.
Western Blot of the selected set(s) of clones and pools. A: The quality of the fractionation for the set of clones and set of Pools 2016 is validated by testing for lamin and tubulin. B: the quality of the fractionation for the Pools#2 and Pools#3 sets. is validated by testing for Lamin, Tubulin, GAPDH and Cytochrome c. The samples were not probed for 4EBP1 in this instance.
The FLAG-eIF4E mRNP was successfully immunoprecipitated in whole-cell
lysates:
Before moving on to the Cell-Fractionation followed by immunoprecipitation in the nuclear fraction I needed to confirm that the protocol for the immunoprecipitation, along with the FLAG-Ab tagged beads used, would successfully immunoprecipitate the FLAG-4EmRNP with high selectivity. The quality of the IP was validated by Western Blot (Figure 5).
34
It was confirmed that the Flag Antibody-taggekDAd beads bound the transfected flag-tagged eIF4E (whether wild type or mutant) with high selectivity. The beads did not bind endogenous eIF4E, as shown by the absence of the band in the IP lane for the vector lane in the Western Blot. The Vector, 4E and S53A cell lines expressed similar levels of Lamin and tubulin, which were used as both loading and negative controls for the IP (Figure 5). The cell lines also expressed similar levels of 4E Binding Protein 1, 4EBP1, used as a positive control. The 4EBP1 was present at a lower molecular weight in the gel in the IP lanes of the 4E and S53A cell lines.
It is thought that this due to a change in the interaction dynamics between transfected eIF4E and 4EBP1 when the FLAG-Ab tagged beads immunoprecipitate the transfected eIF4E. Mass spectrometry studies, which we did not have time to conduct, would confirm whether 4EBP1 is part of the (nuclear) FLAG-eIF4E-mRNP.
As far as the experiments shown in Figure 5 and Figure 6 are concerned, probing for 4EBP1 serves to confirm that the FlagAntibody-tagged beads immunoprecipitated the eIF4E mRNP with high selectivity.
35
Figure 5: 2FLAG-eIF4E immunoprecipitated with high selectivity.
The Whole Cell Immunoprecipitation was successful, as validated by Western Blot. The Flag Antibody bound the transfected flag-tagged eIF4E (whether wild type or mutant) with high selectivity. This antibody did not bind endogenous eIF4E, as shown by the absence of the band in the IP lane for the vector line in the Western Blot Film. The Vector, 4E and S53A cell lines expressed similar levels of Tubulin, which was used as both loading and negative control. The cell lines also expressed similar levels of 4E Binding Protein 1, 4EBP1, used as a positive control. 4EBP1 in the IP lanes for the 4E cell
lines in each set of pools is at a slightly lower molecular weight.It is thought that this due to a change in the interaction dynamics between transfected eIF4E and 4EBP1 when the FLAG-Ab tagged beads immunoprecipitate the transfected eIF4E.
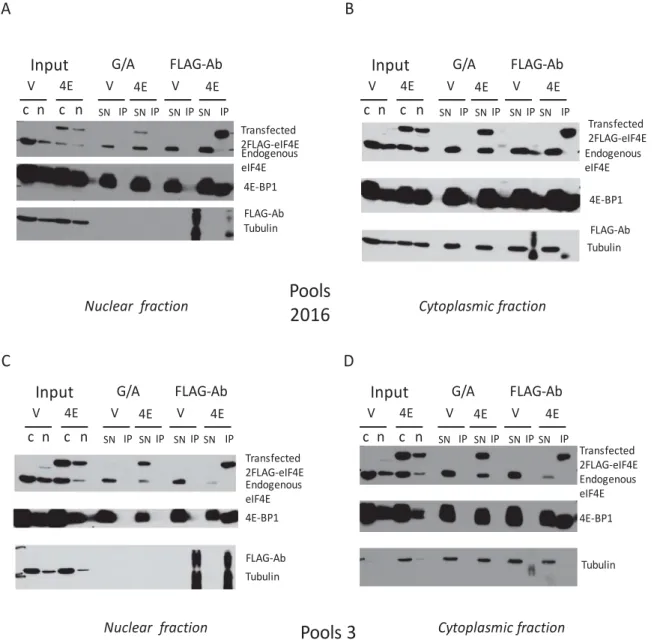
The FLAG-eIF4E mRNP was successfully immunoprecipitated in nuclear lysates.
Cell fractionation followed by immunoprecipitation was carried on in the lysates of cytoplasmic and nuclear fractions of pools 3 and B’s pools 2016. The quality of the IP was validated by Western Blot (Figure 6). The loading, positive and negative controls were the same as the immunoprecipitation experiment in whole-cell lysates. It was once more confirmed that the Flag Antibody-tagged beads bound the transfected flag-tagged eIF4E (whether wild type or mutant)