HAL Id: hal-01375899
https://hal.archives-ouvertes.fr/hal-01375899
Submitted on 7 Oct 2016
HAL is a multi-disciplinary open access
archive for the deposit and dissemination of
sci-entific research documents, whether they are
pub-lished or not. The documents may come from
teaching and research institutions in France or
abroad, or from public or private research centers.
L’archive ouverte pluridisciplinaire HAL, est
destinée au dépôt et à la diffusion de documents
scientifiques de niveau recherche, publiés ou non,
émanant des établissements d’enseignement et de
recherche français ou étrangers, des laboratoires
publics ou privés.
Sharing of energy among service categories in wireless
access networks using Shapley value
Wilfried Yoro, Tijani Chahed, Mamdouh Tabach, Taoufik En-Najjary,
Azeddine Gati
To cite this version:
Wilfried Yoro, Tijani Chahed, Mamdouh Tabach, Taoufik En-Najjary, Azeddine Gati. Sharing of
energy among service categories in wireless access networks using Shapley value. International Wireless
Communications & Mobile Computing Conference (IWCMC 2016) , Sep 2016, Paphos, Cyprus. pp.422
- 429, �10.1109/IWCMC.2016.7577095�. �hal-01375899�
Sharing of Energy among Service Categories in
Wireless Access Networks using Shapley Value
Wilfried Yoro
∗, Tijani Chahed
†, Mamdouh El Tabach
∗, Taoufik En-Najjary
∗, Azeddine Gati
∗∗Orange Labs, Issy-les-moulineaux, France
† Institut Mines-Telecom, Telecom SudParis, UMR CNRS 5157 SAMOVAR, Evry, France
Email:{wilfried.yoro, mamdouh.eltabach, taoufik.ennajjary, azeddine.gati}@orange.com tijani.chahed@telecom-sudparis.eu
Abstract—We investigate in this paper the sharing of energy
consumption among service categories in the access of a wireless network. We focus on the fixed part of the energy consumption of the network, which is known to be significantly larger than the load-dependent variable part, and propose its sharing among the service categories based on coalition game concept, the Shapley value. We consider five service categories, two large players: streaming and web browsing, and three smaller ones: download, voice and other minor services, and compare our proposal with two other sharing methods: uniform and proportional which follows the same traffic proportions. Our results, applied on a real dataset extracted from an operational network in Europe, show that our proposal is more fair both towards small services in that it reduces their shares in comparison to the uniform approach, and towards larger services as it reduces their shares in comparison with the proportional one. Indeed, our Shapley-based model accommodates both short term network behavior, in which the fixed energy component is independent of the traffic load, and longer term behavior, in which it varies with the load and infrastructure. Uniform sharing accounts only for the short term, and the proportional one only for the longer term.
Index Terms—Service-oriented, Energy consumption, Wireless
networks.
I. INTRODUCTION
Internet traffic is growing exponentially over the years, mainly due to the democratization of Smartphones and tablets and the increase of content. According to [1], overall IP traffic will grow at a compound annual growth rate (CAGR) of 23 percent from 2014 to 2019. In order to face this situation, Internet providers upgrade their networks so as to keep up or improve the users’ perceived Quality of Experience (QoE). This leads to an increase in power consumption, resulting in turn in two main challenges: economical, as operators margin is decreasing and ecological, in a context aiming at reducing greenhouse gas emissions. That is why optimizing the power consumption of network equipments is such an active area of research.
If modeling the energy consumption of network elements is important for ecological and economical reasons, assessment of energy consumption of services is not less important. In fact, knowing the energy consumed by services should help in eco-design of applications and cost sharing model design.
We focus in this work on the fixed part of energy con-sumption in the access of mobile networks and its sharing among different service categories. We consider several service
categories representing players of different sizes, large and small, in terms of traffic loads. We decompose the energy model into variable versus fixed components and share the former in a manner that is proportional to the traffic load of each service category. As of the latter, we propose an approach based on coalition game concept, the Shapley value [2].
Our results show that the Shapley value allows to strike a good balance between the different service categories, in that it offers small players reduced cost, as compared to a uniform sharing, and encourages hence their transport as well as the introduction of novel, small ones. It also offers big players reduced cost as well, as compared to a sharing proportional to the traffic proportion of each service category. In doing so, it acknowledges their role as major drivers for network activity and increased deployment. This fairness comes from that, unlike the uniform sharing (which takes into account only the short term) and the proportional sharing (which takes into account only the long term), our Shapley-based model accom-modates the double behavior of the fixed energy consumption which is independent of the network load over short periods of time, and varies with the load and infrastructure over longer periods of time, on the order of years.
The remainder of this paper is organized as follows. In section II, we review some literature related to the assessment of energy consumption per service category. In section III, we describe our Shapley-based models for sharing the fixed com-ponent of the energy consumption among service categories. We discuss some implementation issues of the Shapley-based model and how we tackle these issues in section IV. In section V, we run numerical applications, comparing our Shapley-based proposal to uniform as well as proportional sharing of energy, on a real dataset taken from an operational European network transporting three main service categories: streaming, browsing and download, in addition to voice and other minor services. Eventually, section VI concludes the paper.
II. RELATED WORK
Authors in [3] investigated the information and communica-tion technology (ICT) services’ energy consumpcommunica-tion and CO2 emission at life-cycle of the equipment, including negative and positive impacts: positive impact refers to potential gains due to dematerialization, such as physical transport substitution. Negative impact refers to CO2 emissions notably. The model
for assessing the end-to-end energy consumption of a service is based on the concept of consumption rate, i.e., the energy consumed per unit of service, for example kWh/hour/user. However, no distinction is made between fixed and variable energy consumptions.
In [4], an energy model was developed to estimate the energy consumption of cloud applications; This model was applied to the case of sharing photos on Facebook. The approach consists in determining the energy consumed per bit on a device, then multiplied by the traffic volume of the service. Only the load-dependent power consumption was considered in the model, the fixed power component is ignored since it is independent of services.
Authors in [5] propose a statistical model to assess the overall energy output required for a digital service, from a Datacenter to the end user, using Monte Carlo analysis. No information was given about the nature of the considered energy consumption, fixed, variable or both.
To date, the investigations in the literature related to model-ing the energy consumption of services are based on inputs that are very difficult or even impossible to measure. In [3] and [4] cited above, authors base their models on the energy consumed per transmitted bit of the service by the equipments implied on the path of the service flow. This approach has several limits. Firstly, it allows modeling much more the energy consumed by an application rather than the energy consumed by a service category. Secondly, it is quite impossible to measure the energy consumed per bit of service as most of the time, network equipments serve several services simultaneously. In order to overcome this complexity, the authors mostly refer to the power consumption models of the constructors which do not reflect the reality of the field. We propose to base our model on realistic inputs, i.e., the traffic volumes or proportions of the service categories.
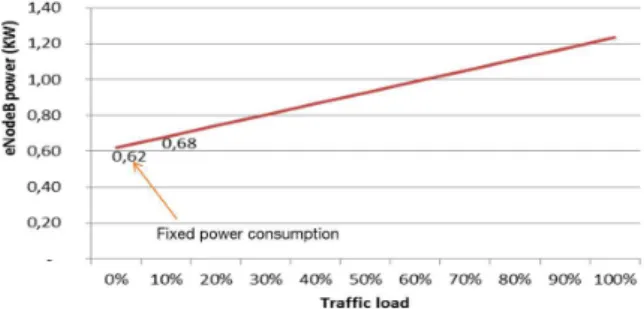
Depending on which network segment is considered, one of these component is preponderant over the other. For example, the energy consumption in the core of the network is largely load-dependent because routers energy consumption varies significantly with utilization, while it is largely independent of the load in the RAN because the access is typically under-loaded (typicallyρ <50% so as not to exceed some operating load threshold). Fig. 1 shows the power consumption of an operating 4G base station versus its traffic load. At 10% of load, the fixed power consumption represents91% of the base station total power consumption.
III. MODELING OF THE ENERGY CONSUMPTION SHARING
A. Description of the system
A wireless network is composed mainly of three segments, the access, the transport and the core as depicted in [6], [7], running possibly several technologies, for instance 2G/GSM, 3G/UMTS and 4G/LTE, for the access, as shown in Fig. 2.
The RAN (Radio Access Network) is the segment of the mobile network interfacing the end-users and the mobile core network. The GSM EDGE Radio Access Network (GERAN)
Fig. 1. Power consumption of a 4G base station.
Fig. 2. The system.
is composed of the Base Transceiver Station (BTS) and the Base Station Controller (BSC).
The UMTS Terrestrial Radio Access Network (UTRAN) is composed of the NodeB and the Radio Network Controller (RNC). The RNC, as with GSM, is in charge of the manage-ment of the radio resource and implemanage-ments Wideband Code Division Multiple Access (W-CDMA) as resource allocation algorithm.
The eNodeB hosts both the base station and the controller functions in a single equipment, for LTE networks. Orthogonal Frequency Division Multiplex (OFDM) is the modulation tech-nology and OFDM Access (OFDMA) the resource allocation algorithm.
Alongside with the network elements on a site, there are the equipments of the Technical Environment (TE) composed of the cooling system, the rectifiers and the backup battery.
Traffic and energy measurements are regularly made on the network for management and investigation purposes. These measures will feed our models for the numerical applications. B. Energy consumption model
Let us first consider a radio access network with only one radio technology (homogeneous network) transporting a set of N service categories, consuming energy E to be shared among the service categories. As stated earlier, the energy consumed
by the access equipments is composed of a variable and a fixed components, denoted byEv andEf, respectively. Then
we have
E= Ev+ Ef (1)
Denoting byEithe energy consumption induced by service
category i, with variable and fixed components Ev i and E f i, respectively, Ei= Eiv+ E f i (2)
We first focus on the variable energy consumption due to service category i. Let us denote by vi the traffic volume of
service i.
Eiv= ϕi× Ev (3)
where ϕi is the share of service categoryi in Ev, given by:
ϕi=
vi
PN k=1vk
(4) As of the fixed energy consumption component, it is given by:
Eif = φi× Ef (5)
where φi is the share of service i in Ef.
Unlike the share of a service category in the variable energy consumption, that corresponds, as shown above, to its traffic proportion, we propose to determine φi using the Shapley
value.
We begin by giving some introductory material on the Shapley value concept, based on [2], [8]. This mathematical tool has a number of applications in telecommunications, [9]– [11].
C. Shapley value: definition
The Shapley value is used in the theory of cooperative games to determine a solution for sharing the common revenue of a coalition. Let us consider a game ξ(N, V ) with N denoting the number of players and V the characteristic function, associating to each coalition of the game a value. A coalition is a set of players that cooperate so as to improve their revenue. The grand coalition is the coalition including all the players of the game. There are N! possible scenarios of constructing the grand coalition.
Let Sσ
i denote the largest coalition not containing yet the
playeri in the construction of the grand coalition, with regard to scenarioσ. We define the incremental cost vector associated to the scenario σ by:
cσinc= (c σ inc({1}), · · · , c σ inc({i}), · · · , c σ inc({N })) (6) where cσ
inc({i}) = V (Sσi ∪ {i}) − V (Sσi), i.e., the marginal
contribution of the player i inV(Sσ i ∪ {i}).
The Shapley value xShapley is the arithmetic mean of
the incremental cost vectors associated to the scenarios of constructing the grand coalition, i.e.,
xShapley= 1 N! X σ cσinc (7)
D. Game without mandatory players
As stated earlier, the game is characterized byξ(N, V ), with N the number of players and V the characteristic function. The characteristic function allocates to each coalition a cost, corresponding to a fraction of the fixed energy consumption of the network.
Let S denote a coalition of size s, with s = |S|, |.| the cardinal function. In the sequel, the payoffs of the players and values of the coalitions are normalized by the fixed energy consumption of the network, unless otherwise stated.
V(S) = Ps k1=1vk1,S PCs N j2=1 Ps k1=1vk1,Sj2 (8)
The value of the coalitionS is the ratio of its traffic volume and the traffic volume of all the coalitions having the same size as S, whose number is CNs. vk,S is the traffic volume of the
kth element of the coalitionS.
Now that the characteristic function of the game is defined, we use the Shapley value concept to compute the payoffs of the players. According to Shapley, the payoffφi of the player
i is: φi(V, S) = 1 N! N X s=1 (N − s)!(s − 1)! CN−1s−1 X j1=1 δ({i}, S) (9) whereδ({i}, S) = V (Sj1,{i})−V (Sj1,{i}\{i}) is the marginal
contribution of the player i, in coalition S. It represents the cost gained or lost by the coalition S with the entry of the player i.
The computational complexity of (9) grows exponentially in the number of service categories, which may represent an obstacle for being implemented. We hence propose a closed-form expression for the Shapley value computation, derived from (9).
Letpidenote the traffic proportion of the playeri: pi =vvit.
The closed-form expression of the Shapley value of the player i is : φi(N, pi) = ( N X s=1 1 sCs N )pi + ( N X s=2 (CNs−2−1− C s−1 N−1)C s−2 N−2 CNs−1−1CN−1s−2sCs N )(1 − pi) (10)
The derivation of this expression is found in Appendix A. E. Game with a mandatory player
Let us now consider a game with a mandatory player. As stated above, this is the case for instance when an operator has the obligation, by the state, to offer a given service, notably voice, when deploying a network infrastructure. A mandatory player is such that there can not exist any coalition without him.
Fig. 3. Runtimes of the classical-based and closed-form-based Shapley value algorithms.
Let us denote by i∗ the mandatory player and o a non mandatory player. The characteristic function of the game is defined as follows: V(S) = Ps k1=1vk1,S PCs N j2=1 Ps k1=1vk1,Sj2 1i∗∈S (11)
φi∗andφoof the mandatory playeri∗ and a non mandatory
player o, respectively, are obtained by (9).
The closed-form expression of the Shapley value of the mandatory player is : φi∗(N, pi∗) = ( N X s=1 1 sCs N )pi∗+ ( N X s=2 CNs−2−2 CNs−1−1sCNs )(1 − pi∗) (12) The derivation of this expression is found in Appendix B. The closed-form expression of the Shapley value of a non mandatory player is : φo(N, pi∗, po) = ( N X s=2 (CN−1s−2 − CNs−1−1)CNs−2−2 CN−1s−1CNs−2−1sCs N )pi∗ + ( N X s=2 CN−2s−2 CNs−1−1sCs N )po + ( N X s=3 (CNs−2−1− CNs−1−1)CNs−3−3 CNs−1−1CNs−2−1sCNs )(1 − pi∗− po) (13)
The derivation of this expression is found in Appendix C. IV. IMPLEMENTATION ISSUES
Fig. 3 shows the runtime (in minutes) of two algorithms for the computation of the Shapley values of service categories, one using (9) - denoted by Classical - and the other using the closed-form expression (10) - denoted by Optimized.
The algorithm using the closed-form expression (10) has a runtime independent of the number of service categories in the network (less than 1 second for up to 50 service categories, the maximum number of service categories one measures in the considered network), while the algorithm using (9) has a computational complexity growing exponentially in the
Fig. 4. Traffic proportions per service category.
number of service categories, it does not converge and has some resource limitation from a number of service categories (depending on the hardware and software environment). This comes from that (9) computes the marginal contribution of each service category in all N! scenarios of constructing the grand coalition, whilst the closed-form expressions we derive from (9) are simple linear functions of the traffic proportions.
V. NUMERICAL APPLICATIONS
We now turn to the evaluation of our Shapley-based sharing model of energy between different service categories. We consider a realistic commercial network of a European country. The period of the study covers two years representing a mature 2G/3G network with early LTE deployments and associated traffic increase. We measure all voice and data services that are transmitted in the network with the following segmentation for the service categories: two large ones, namely streaming and web browsing, and three smaller ones: download, voice and other minor services. Fig. 4 shows their traffic proportions as taken from the real dataset. We consider just the traffic and energy consumption of the 3G sub-network (the network of NodeBs and RNCs).
The variable component of the energy consumption is shared proportionally to the traffic load, as this component is load-dependent. This implies that data services induced 90% of the UMTS Terrestrial Radio Access Network (UTRAN) variable energy consumption. These services are dominated by Over The Top (OTT) actors like Google.
A. Performance metric
In order to compare the three sharing strategies, i.e., Shapley-based, uniform and proportional, we introduce a sat-isfaction measure based on the concept of regret.
Let S denote the set of strategies of the players. S = {u, p, s} with u denoting the uniform model, p the propor-tional model, ands the Shapley-based model. Each player has three strategies he can play. LetN denote the set of players, xk
i the fixed energy share of playeri when playing strategy k.
Letx˜i denote the minimum share of player i, with regard to
its strategies.
˜
Fig. 5. Sharing of the fixed energy using three approaches: uniform, proportional and Shapley.
˜
x= (˜xi)i∈N is the vector of minimum shares of the players.
Let rk
i denote the regret of playeri when playing strategy k.
It is the difference between its share when playing strategy k and its minimum share.
rik= x k
i − ˜xi (15)
rk = (rki)i∈N is the regret vector of players when strategyk
is chosen. A strategy k maximizes the satisfaction of players if it minimizes the variance of the regret vectorrkwith regard
to other strategies. By minimizing the variance of regrets, the strategy k minimizes the difference between the regrets of satisfied and those of unsatisfied players. A player is satisfied when its regret is lower than the mean regret of the players, and is unsatisfied otherwise.
var(rk) = min((var(rk′))k′∈S) (16)
B. Energy sharing without a mandatory service category We now turn to the fixed component of the energy consump-tion and show in Fig. 5 the sharing achieved by our Shapley-based proposal along with two other strategies: uniform shar-ing between the different service categories, independently of their traffic loads as on the short term the fixed energy consumption is independent of the network traffic load. And a proportional sharing which follows the traffic proportions of the service categories, given that traffic increase over a larger time scale causes network upgrades that in turn augment the fixed energy consumption.
It is worth to notice in the figure that the uniform approach favors ”big services” (in terms of load) while ”small ones” are favored by the proportional sharing. Our Shapley-based model achieves actually a trade-off among all the players, taking into consideration the double behavior of the fixed energy as it varies or not with the traffic load according to the time scale, unlike the uniform sharing that accounts only for the short term, and the proportional approach for the longer term. Indeed ”big players”, namely streaming and web services, have a lower impact in the network fixed energy consumption than they would have had with a proportional approach, as well
Fig. 6. Players’ satisfactions per sharing approaches.
as ”small players”, namely voice, download and other minor services with regard to a uniform sharing.
This is a good trade-off for streaming and web services as it does not penalize them a lot and acknowledges the fact that they are major drivers for network activity, and is also a good trade-off for services with small loads as it does not make them too much responsible of the fixed energy consumption and encourages their transport as well as introduction of yet new, small ones.
The trade-off offers by our Shapley-based model to all the players results in the maximization of their satisfaction for this sharing strategy, as illustrated in Fig. 6. Maximizing the satisfaction is equivalent to reducing the difference between the highest and the lowest regrets of the players, since the players have the same mean regret whatever the strategy.
Based on our Shapley-based model, data services represent 85% of the UTRAN fixed energy consumption, versus 15% for voice service. We deduce that data services represent 0.91θ3G + 0.85(1 − θ3G) of the total energy consumption
(fixed and variable) of the 3G RAN. Typically θ3G = 0.2
because the access is under-loaded (say ρ = 25%), finally data services represent 86% of the total RAN energy con-sumption. We consider the power consumption model of the base station in Fig. 1, i.e.,P(ρ) = 0.62(1 + ρ). For ρ = 25%, θ3G=
0.775−0.62 0.775 = 0.2.
C. Energy sharing with a mandatory service category: voice We now turn to the case where the voice service is manda-tory due to legal constraints. In this scenario, voice is not considered in the selection of the best sharing strategy since it is a mandatory player, then must play whatever the sharing approach.
Based on Fig. 7, the best sharing model can not be the proportional approach as the regret of big services is very high. Uniform sharing is also eliminated because it induced higher regrets for all the players with regard to the Shapley-based model. The Shapley-based sharing appears as the strategy that minimizes the difference between the players regrets, and thus maximizing their satisfaction, as depicted in Fig. 8.
It is worth to notice that the Shapley-based model takes into account the mandatory nature of the voice service by
aug-Fig. 7. Sharing of the fixed energy - voice a mandatory player.
Fig. 8. Players’ satisfactions per sharing approaches - voice a mandatory player.
menting significantly its share in the fixed energy consumption (from 15% to 29%). This results in a significant reduction of the impact of data services on the total energy consumption of the network. Data services represent now 57% of the total energy consumption, that corresponds to a decrease of 29% compared to the scenario where voice is not a mandatory player.
The mandatory nature of the voice service can be interpreted as if the network infrastructure was primarily deployed to deliver voice service in application of a legal obligation. That is reflected in the Shapley-based model, which is impossible with the uniform and proportional models.
VI. CONCLUSION
We investigated in this work the sharing of the energy consumed by a wireless access network among the provided service categories. We focused on the two energy components: small, load-dependent variable one, and significantly larger fixed one (since the RAN is most of the time under-loaded, with traffic load ρ < 50%), load-independent over the short term but load-dependent over longer period of time (typically years). The former is to be shared among the service categories according to their traffic proportions. As of the latter, we
proposed a sharing model based on coalition game concept, the Shapley value, which allows dealing with the double behavior of that energy component as it varies or not with the network load according to the time scale. Our proposal favors small players, in terms of traffic load, when compared to uniform sharing (which takes into account only the short term) and favors larger players as compared to proportional sharing (which takes into account only the long term). This is appreciable as it gives incentives to the introduction and transport of small services, and acknowledges the role of larger service categories as major drivers for network activity.
Our next work will focus on the end-to-end path, from the content location in a datacenter for instance to the end user, and on the quantification as well as the sharing of the total energy consumption, again, among the different service categories in the overall network.
APPENDIXA. GAME WITHOUT MANDATORY PLAYERS
The characteristic function of the game without a mandatory player is as follows: V(S) = Ps k1=1vk1,S PCs N j2=1 Ps k1=1vk1,Sj2
The value of a coalitionS is the ratio of the traffic volume of that coalition and the traffic volume of all the coalitions having the same size asS, whose number is Cs
N, and size is
s. vk,S is the traffic volume of thekth element of the coalition
S.
The marginal contribution of the playeri is the gain or loss of the coalitionS due to the entry of the player i in the coalition. It is determined as follows: V(S) − V (S\{i}) = Ps k1=1vk1,S PCs N j2=1 Ps k1=1vk1,Sj2 − Ps−1 k2=1vk2,S\{i} PCs−1N j4=1 Ps−1 k2=1vk2,Sj4 CN−1s−1 X j1=1 V(Sj1) − V (Sj1\{i}) = PCN−1s−1 j1=1 Ps k1=1vk1,Sj1,{i} PCs N j2=1 Ps k1=1vk1,Sj2 − PCN−1s−1 j1=1 Ps−1 k2=1vk2,Sj1\{i} PCs−1N j4=1 Ps−1 k2=1vk2,Sj4
CN−1s−1 is the number of coalitions of sizes containing the playeri,PC s N j2=1 Ps k1=1vk1,Sj2 and PCs−1N j4=1 Ps−1 k2=1vk2,Sj4 are
respectively the traffic volumes of the coalitions of sizes and s− 1. They are constant for a given coalition size s, hence we can get them out of the sum over coalitions of same size.
PCN−1s−1 j1=1
Ps
k1=1vk1,Sj1,{i} is the sum of the traffic volumes
of the coalitions of sizes containing the player i. vk,Sj,{i} is
the traffic volume of thekth element of the jth coalition of
sizes containing the player i. The player i of course is present in all theCN−1s−1 coalitions, while each other player is present
inCNs−2−2 coalitions. In fact there areCNs−2−2 coalitions of size
s with both player i and a given player k. PCs−1N−1
j1=1
Ps−1
k2=1vk2,Sj1\{i}is the sum of the traffic volumes
of the coalitions of size s− 1 not containing the player i. vk,Sj\{i} is the traffic volume of the k
th element of the jth
coalition of size |Sj| not containing the player i. |.| is the
cardinal function. Similarly, a given playerk appears in CNs−2−2
coalitions among the CN−1s−1 coalitions of size s− 1, derived from theCN−1s−1 coalitions of sizes containing i.
Then we have: CN−1s−1 X j1=1 V(Sj1) − V (Sj1\{i}) = CN−1s−1vi+ CNs−2−2 PN k3=1 k36=i vk3 CN−1s−1 PNk4=1vk4 − CNs−2−2 PN k3=1 k36=i vk3 CN−1s−2 PNk4=1vk4 φi(v) = 1 N! N X s=1 (N − s)!(s − 1)! CNs−1−1vi+ CNs−2−2 PN k3=1 k36=i vk3 CNs−1−1PNk4=1vk4 − 1 N! N X s=1 (N − s)!(s − 1)! CN−2s−2 PNk3=1 k36=i vk3 CN−1s−2 PNk4=1vk4 CNs = N! s!(N − s)! =⇒ (N − s)!(s − 1)! = N! sCs N Hence, φi(v) = 1 vT ( N X s=1 1 sCs N )vi + 1 vT ( N X s=2 (CN−1s−2 − CNs−1−1)CNs−2−2 CN−1s−1CNs−2−1sCs N )(vt− vi)
Let pi denote the traffic proportion of the playeri.
pi= vi vT φi(N, pi) = ( N X s=1 1 sCs N )pi + ( N X s=2 (CNs−2−1− C s−1 N−1)C s−2 N−2 CN−1s−1CN−1s−2sCs N )(1 − pi)
APPENDIXB. PAYOFF OF THE MANDATORY PLAYER
Leti∗ denote the mandatory player. The value of a coalition with the mandatory player is :
V(S) = Ps k1=1vk1,S PCs N j2=1 Ps k1=1vk1,Sj2 1i∗∈S
The payoff of the mandatory player is :
φi∗(v) = 1 N! N X s=1 (N − s)!(s − 1)! CN−1s−1 X j1=1 V(Sj1,{i∗}) In factV(S\{i∗}) = 0 ∀ S CN−1s−1 X j1=1 V(Sj1,{i}) = PCN−1S−1 j1=1 Ps k1=1vk1,Sj1,{i} PCs N j2=1 Ps k1=1vk1,Sj2 CN−1s−1 X j1=1 V(Sj1,{i}) = CNs−1−1vi+ CNs−2−2 PN k3=1,k6=ivk3 CN−1s−1 PNk4=1vk4 φi∗(v) = 1 N! N X s=1 (N − s)!(s − 1)!C s−1 N−1vi∗+ C s−2 N−2 PN k3=1,k6=i∗vk3 Cs−1N−1PNk4=1vk4 Hence, φi∗(v) = 1 vT ( N X s=1 1 sCs N )vi∗+ 1 vT ( N X s=2 CNs−2−2 CN−1s−1sCs N )(vT − vi∗) φi∗(N, pi∗) = ( N X s=1 1 sCs N )pi∗+ ( N X s=2 CNs−2−2 CNs−1−1sCNs )(1 − pi∗)
APPENDIXC. PAYOFF OF A NON MANDATORY PLAYER
Let o denote a non-mandatory player. The value of a coalition with a non mandatory player and the mandatory player is: φo(v) = 1 N! N X s=1 (N − s)!(s − 1)! CN−2s−2 X j3=1 V(Sj3,{i∗,o})− 1 N! N X s=1 (N − s)!(s − 1)! Cs−2N−2 X j3=1 V(Sj3,{i∗,o}\{o})
CN−2s−2 is the number of coalitions of sizes containing both playersi∗ and o.
V(S) − V (S\{o}) = Ps k1=1vk1,S PCs N j2=1 Ps k1=1vk1,Sj2 − Ps−1 k2=1vk2,S\{o} PCs−1N j4=1 Ps−1 k2=1vk2,Sj4
CN−2s−2
X
j3=1
V(Sj3,{i∗,o}) − V (Sj3,{i∗,o}\{o}) =
PCs−2N−2 j3=1 Ps k1=1vk1,Sj3,{i∗,o} PCs N j2=1 Ps k1=1vk1,Sj2 − PCN−2s−2 j3=1 Ps−1 k2=1vk2,Sj3,{i∗,o}\{o} PCNs−1 j4=1 Ps−1 k2=1vk2,Sj4 CN−2s−2 X j3=1
V(Sj3,{i∗,o}) − V (Sj3,{i∗,o}\{o}) =
CNs−2−2vi∗ +CNs−2−2vo+ CNs−3−3 PN k5=1 k56=i∗,o vk5 CNs−1−1PNk4=1vk4 − CN−2s−2vi∗ +CNs−3−3 PN k5=1 k56=i∗,j vk5 CNs−2−1 PN k4=1vk4
In the case of a mandatory player, any non mandatory player can not form a coalition of less than 2 members.
φo(v) = 1 N! N X s=2 (N − s)!(s − 1)! CNs−2−2vi∗ +CNs−2−2vo+ CN−3s−3 P N k5=1 k56=i∗,o vk5 CNs−1−1PNk4=1vk4 − 1 N! N X s=2 (N − s)!(s − 1)! CN−2s−2vi∗ +CNs−3−3 PN k5=1 k56=i∗,o vk5 CNs−2−1PNk4=1vk4 Hence, φo(v) = 1 vT ( N X s=2 (CN−1s−2 − CNs−1−1)CNs−2−2 CNs−1−1CNs−2−1sCs N )vi∗ + 1 vT ( N X s=2 CNs−2−2 CN−1s−1sCs N )vo + 1 vT ( N X s=3 (CNs−2−1− CNs−1−1)CNs−3−3 CNs−1−1CNs−2−1sCNs )(vT − vi∗− vo) φo(N, pi∗, po) = ( N X s=2 (CN−1s−2 − CNs−1−1)CNs−2−2 CNs−1−1CNs−2−1sCs N )pi∗ + ( N X s=2 CN−2s−2 CNs−1−1sCNs )po + ( N X s=3 (CN−1s−2 − CNs−1−1)CNs−3−3 CN−1s−1CNs−2−1sCNs )(1 − pi∗− po) ACKNOWLEDGMENT
Under the framework of Celtic-Plus, the studies of the SooGREEN project have been partially funded by the French Directorate General for Enterprise (DGE) and the Scientific and Technological Research Council of Turkey (TUBITAK).
REFERENCES
[1] Cisco, Cisco Visual Networking Index: Forecast and Methodology, 2014
2019. Cisco, 2015.
[2] L. Shapley, Contributions to the theory of games II. Reading, Mas-sachusetts: Annals of Mathematics Studes. Princeton University Press, 1953.
[3] D. Marquet, M. Aubre, P. J.-P. Frangi, and D. X. Chavanne, “Sci-entific methodology for telecom services energy consumption and co2 emission assessment including negative and positive impacts,”
Telecommunication-Energy Special Conference, pp. 1 – 14, 2009.
[4] F. Jalali, C. Gray, A. Vishwanath, R. Ayre, T. Alpcan, K. Hinton, and R. S. Tucker, “Energy consumption of photo sharing in online social networks,” in 2014 14th IEEE/ACM International Symposium on
Cluster, Cloud and Grid Computing, Institute of Electrical & Electronics
Engineers (IEEE), may 2014.
[5] C. Preist, D. Schien, P. Shabajee, S. Wood, and C. Hodgson, “Analyzing end-to-end energy consumption for digital services,” Computer, vol. 47, pp. 92–95, may 2014.
[6] W. Vereecken, W. Heddeghem, M. Deruyck, B. Puype, B. Lannoo, W. Joseph, D. Colle, L. Martens, and P. Demeester, “Power consumption in telecommunication networks: overview and reduction strategies,”
IEEE Commun. Mag., vol. 49, pp. 62–69, jun 2011.
[7] K. Hinton, J. Baliga, M. Z. Feng, R. W. A. Ayre, and R. S. Tucker, “Power consumption and energy efficiency in the internet,” IEEE
Net-work, vol. 25, pp. 6–12, mar 2011.
[8] R. B. Myerson, Game Theory, Analysis of Conflict. Cambridge, Massachusetts: Harvard University Press, 1991.
[9] A. A. Razzac, S. E. Elayoubi, T. Chahed, and B. Elhassan, “Dimen-sioning and profit sharing in hybrid LTE/DVB systems to offer mobile TV services,” IEEE Transactions on Wireless Communications, vol. 12, pp. 6314–6327, dec 2013.
[10] W. Saad, Z. Han, M. Debbah, A. Hjorungnes, and T. Basar, “Coalitional game theory for communication networks,” IEEE Signal Process. Mag., vol. 26, pp. 77–97, sep 2009.
[11] C. Singh, S. Sarkar, A. Aram, and A. Kumar, “Cooperative profit sharing in coalition-based resource allocation in wireless networks,” IEEE/ACM