Increasing breast cancer screening uptake: a randomized
controlled experiment
Léontine Goldzahl∗, Guillaume Hollard†Florence Jusot ‡§
Abstract
Early screening increases the likelihood of detecting cancer, thereby improving survival rates. National screening programs have been established so that eligible women receive a letter con-taining a voucher for a free screening. Yet, mammography use is often considered as too low. Using a large-scale randomized experiment involving 26,495 women, we test four behavioral in-terventions. Our main assumption is that, because of some biases in their decision process, women may be sensitive to the content and presentation of the invitation letter they received. No treatment had any significant impact on mammography use. Subsample analysis shows that even for women invited for the first time or low income women, treatments had no significant effects. Everything continues as if women are taking clear and well-informed decisions. Policy implications are that existing programs probably reached an upper-bound and can hardly be improved in their current form.
Keywords: cancer screening, randomized controlled experiment, behavioral interventions JEL classification: D03; I18
∗PSL, Université Paris-Dauphine, Leda-Legos, France. E-mail: [email protected] †CNRS and Ecole Polytechnique, France
‡PSL, Université Paris-Dauphine, Leda-Legos, France §
Acknowledgment: We gratefully acknowledge the financial support of the Ligue Contre le Cancer. The authors would like to thank Pierre-Emmanuel Couralet for his help on data analysis. For the first author, this research has been supported by a post-doctoral grant co-financed by the chair "Santé" at the Fondation du risque and the project ANR 11-LABX-0019 and by the National Institute of Cancer (INCA)
1
Introduction
Early screening increases the likelihood of detecting cancer at a more localized stage, thereby im-proving survival rates. To prevent asymptomatic breast cancer from progressing to a metastasic stage, national screening programs have been established in many countries. Eligible women receive an invitation letter containing a voucher for a free screening (namely a mammogram). Women are free to undertake the exam or not. Yet, many policy makers and researchers consider that mam-mography use is still too low (Altobelli and Lattanzi (2014)) and that socioeconomic disparities in mammography use linger (Carrieri and Wübker (2013), Devaux (2015), Jusot, Or and Sirven (2012) Sicsic and Franc (2014)). Improving mammography use is thus an important policy objective.
The present paper uses a large-scale Randomized Controlled Trial (RCT) with four treatments
corresponding to various behavioral interventions1. Each treatment consists of changing some
as-pects of the invitation letters based on insights from behavioral economics and psychology. Our behavioral interventions contrast with most previous approaches which either provide extra infor-mation (e.g. adding a leaflet to the letters) or financial incentives (e.g. a cash reward is attributed to those who undertake the medical tests). A desirable feature of the type of interventions studied here is that they are almost costless, as changing the letters entails no additional cost. In addition, our behavioral interventions let the individuals remain free to choose what they believe is best for themselves, because they mainly focus on the way the information is presented so that it may be better taken into account in the decision-making process. It is important to note that mammogram is not an entirely innocuous exam and that some women may choose not to undertake such exam for good reasons (Pace and Keating (2014)).
Our main hypothesis is that, because of some variability or biases in their decision process, women may be sensitive to the content and presentation of the invitation letter they receive. The alternative hypothesis would be that women have already gathered all relevant information and reached an informed decision that correctly balanced the pros and cons of undertaking a mammogram to detect breast cancer.
Our main result is that, despite a large sample of n=26,495 women, none of our four behavioral
1Behavioral interventions represent a variety of actions inspired by behavioral economics. It includes nudges
(Thaler and Sunstein (2008)), but also refers to providing specific information using behavioral insights. For instance, providing new information about the behavior of others. See below for a more elaborated discussion.
interventions had any significant impact on mammography use. We then ran a complementary analysis to better understand this negative result. It appears that even women who received their invitation letter for the first time are not sensitive to treatment effects. Furthermore, uptake decisions are found to be stable across time, as if women choose to screen (or not) once and for all. Our favorite interpretation is that everything continues as if women are making clear and well-informed decisions. In short, one can, as a first approximation, consider their behavior as optimal. Despite the lack of an average effect, it is possible that uptake rates have changed in particular subgroups and outcomes (eg. across social groups and screening in or outside the program). We suggest that one can be reasonably confident about the generality of our results, raising interesting policy issues.
2
Review
We first clarify what is meant by nudges and behavioral interventions. We then explain why be-havioral interventions may be considered as the last hope to improve existing screening programs in their current form. In particular, we provide some empirical and theoretical arguments explaining why we should expect a large treatment effect. Finally, we explain how the present work builds on previous attempts to change cancer screening rates.
2.1 Nudges and Behavioral interventions: definition and interest
Policy makers often wish to change behaviors. Traditional public policies rely on two main channels to promote a particular behavior: information and incentives. By providing easy access to the rele-vant information and decreasing the cost (or increasing the benefits) of adopting the recommended behavior, the goal is to make individuals reconsider their trade-off between a decision’s costs and benefits. A third channel has been popularized by Thaler and Sunstein (2008), under the name of nudges. A nudge intervention takes advantage of individuals’ cognitive or psychological patterns (status-quo, hyperbolic discounting for example) by changing the architecture of the choice in order to influence their behaviors. A simple example of a nudge would be placing healthy foods in a school cafeteria at eye level, while putting less-healthy junk food in harder-to-reach places. Individuals are not actually prevented from eating whatever they want, but arranging the food choices that way causes people to eat less junk food and more healthy food. As can be seen from this example, a typi-cal nudge intervention provides inexpensive ways to have an influence on the decision-making process
while respecting the individual’s freedom to choose what they consider best for themselves. As a result, policy makers devoted particular attention to nudges as attested by the creation of a behav-ioral Insights Team in the UK government or the US "Nudge Unit. The "Behavioural Experiments in Health Network" is another example of increasing institutionalization.
A pure nudge would be a way to influence the decision process, without adding any information. According to this restrictive definition, nudges have an effect because they are able to change the way in which individuals process information. For instance, they can change from a fast and automatic decision process to a slow and explicit one, as suggested by Kahneman (2003), or stick to the status-quo. However, it is difficult in practice to draw a clear line between nudges and information. For instance, providing information on what other’s do, adds new information but is also behaviorally inspired. As a result, we prefer to speak of behavioral interventions, in a broad sense, rather than nudges alone.
2.2 Why behavioral interventions (and not incentives or information)?
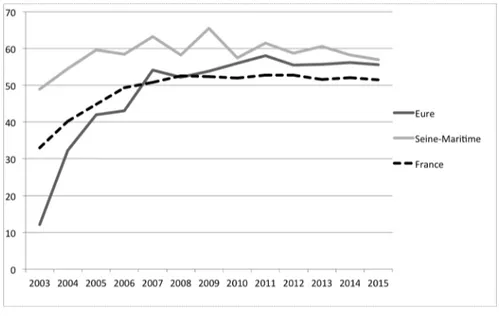
National programs have been implemented in many western countries to increase mammography use. The general principle is to send every two years a letter which contains an invitation to undertake a free mammography. Following this principle, the French program was successful in increasing mammography use by 14% (Buchmueller and Goldzahl (2017)). Carrieri and Wuebker (2016) find that organized screening programs increased participation in breast cancer screening by 24% in Europe. However, uptake rates often reached a stable upper bound. As can be seen from Figure 1, the French program has now been stable at a 52% rate for the last 8 years (as of 2016), as are the two departments in which the RCT was ran.
Several attempts were made to increase mammography use. These attempts can be classified according to whether they intended to change behavior based on financial incentives or based on providing more information. In what follows, we review existing evidence regarding the effectiveness of each channel.
Incentives: Four studies investigated the incentive channel by testing financial incentive mech-anisms rewarding cancer screening uptake. Gupta et al. (2016)’s interventions randomly assigned $5 or $10 Walmart vouchers (n=1000 in each treatment and n =6,565 in control group) in addition
Figure 1: Organized screening uptake rate since national program’s implementation
to a mailed invitation with a fecal blood screening kit, with phone call reminders. Bowel cancer screening did not differ between the incentivized and unincentivized groups. Interestingly, the $10 group screened significantly less than the $5 group, suggesting a boomerang effect for higher finan-cial incentives. Kullgren et al. (2014)’s study tested various amounts ($5, $10, $20 with n=713) and fixed versus lottery (n=836) financial incentives schemes to increase the completion rate of bowel cancer screening using a fecal blood screening kit. While none of the various fixed payments changed test completion, the lottery incentive increased test completion by 19% (p-value<0.01) as compared to the control group. In contrast, Merrick et al. (2015)’s study also test fixed versus lottery payments for rewarding breast cancer screening (n=4427) and find no difference in mammography use. Slater et al. (2005) tested whether an enhanced letter, or an enhanced letter that also offers a $10 reward conditional on mammography use would increase breast cancer screening among low-income women (n= 145,467). The financial incentive treatment group increased mammography use by 0.75%, with 70% being driven by the financial incentive component, as compared to the con-trol group. These results suggest that financial incentives rewarding cancer screening yield mixed results. When financial incentives are found to increase mammography use, they are difficult to replicate (lottery design), or the cost-effectiveness of a $10 voucher provided upon completion needs to be investigated. Another intervention, which specifically addresses transportation costs related to the distance to the radiologist, includes mobile mammography screening programs (nammely a trucks with mammogram materials, called "Mammobiles", which go to remote places). Vallée (2016)
reports that Mammobiles are expensive, have technical limitations and don’t seem to increase the uptake rate when Mammobiles are available. Thus, transaction costs do not seem to constitute a great limitation.
Information: The information channel was explored by two large-scale studies, in England and in France (Trial 1 and 2 of Wardle et al. (2016) and Bourmaud et al. (2016)). Both studies consisted of sending an additional leaflet with existing invitation letters, for bowel and breast cancers respectively. In Trial 1 of Wardle et al. (2016), the leaflet summarizes the key information about bowel cancer. Despite a large sample size (n=163,525), the supplementary leaflet is found to have had no effect on uptake rates. In their second trial (n=149,871), Wardle et al. (2016) found that adding a narrative leaflet including interview’ excerpts from people who already screened also did not have any effect on uptake rates. Bourmaud et al. (2016)’s study consists of adding a 12-page leaflet about breast cancer to a sample of 16,000 eligible women. They found a negative effect, driven by a specific geographical area. Thus, adding information is found to have a limited impact on well-established programs. This suggests concentrating attention on changing the invitation letters (rather than adding an extra leaflet) to avoid increasing the total quantity of written material.
As explained, increasing uptake rates any further seems difficult using the traditional channels, namely information and incentives. Behavioral interventions somehow represent the last hope for having any significant impact within the current system (i.e. sending invitation letters for a free screening) at a reasonable cost.
2.3 Should we expect behavioral interventions to be effective?
The popular book of Thaler and Sunstein (2008) sparked great interest for behavioral interventions. So far, results are mixed: the most empirically robust and sensitive interventions sometimes fail to change behavior as expected, while others have been surprisingly successful. Regarding the particular case of breast cancer screening, is there any particular reason to believe that any effect should be expected?
As we will argue below, there are good reasons to believe that the effect of our behavioral interventions is expected to be maximal. In other words, if we do not observe a significant treatment effect in the present situation, it is unlikely that we observe any for similar interventions.
screening decision. The decision arises by comparing the cons of screening (for instance breast cancer screening can be painful and even harmful with a small probability) and pros (if cancer is detected early, I will get a less invasive treatment). Let’s denote by f the (subjective) distribution of costs and g the (subjective) distribution of benefits.
A decision maker will screen if and only if
E(S) =
Z ∞
0
u(x)f (x) − v(x)g(x) dx > 0
where E(S) is the expected value of screening, u is the utility function used by the decision maker to assess losses and v the one to assess gains.
Behavioral interventions are expected to increase uptake rates, i.e. modify some elements of the decision making process so as to increase E(S). For instance, we may expect behavioral interventions to modify subjective beliefs, i.e. f and g. Behavioral interventions will thus have an effect on the "marginal" individuals, i.e. those for whom, prior to the treatment, we have:
E(S) =
Z ∞
0
u(x)f (x) − v(x)g(x) dx ≈ 0
The distribution of E(S) across individuals is thus of particular importance to evaluate the magnitude of the treatment effect. A reasonable assumption is to assume that the distribution exhibit a pick around the median (i.e. the individual that splits the sample into two equal parts). For instance, let’s consider the case where E(S) is normally distributed. As depicted in Figure 2, the same treatment will have a much different effect whether the marginal individual is close or far from the median. In the proposed example, the effect (i.e. the size of the shaded areas) can be multiplied by about according to the distance to the median.
The fact that, prior to our interventions, the national screening program’s uptake rate is around 50% means that our intervention takes place in the most favorable situation. The presented argument is reinforced by a recent meta analysis that links take-up rates in the baseline to the size of the treatment effect Coffman, Featherstone and Kessler (2015). As can be seen from the graph on the left in Figure 3, their meta-analysis shows that treatment effects are maximal when take-up rates are around 50%. Interestingly enough, they also propose a general theory to assess when nudges are likely to be effective. They assume that nudges operate though small changes in beliefs; i.e. nudges are considered as good or bad news. Under some reasonable assumptions, they are able to predict
Figure 2 0 .1 .2 .3 .4 Density -4 -2 0 2 4 E(S)
Effects of an intervention with two different baseline take-up rates
Figure 3: Effect size according to take-up in control group from Coffman, Featherstone and Kessler (2015)
the shape of relation between the size of the treatment effect and take-up rates in the baseline. Surprisingly enough, their model predicts that, for low values of take-up rates, the effect can even be negative as can be seen in Figure3 (right part).
2.4 Designing new behavioral interventions: lessons from past studies
Our treatments take advantage of past studies by selecting the features that should have the largest effect. We first review evidence regarding how the letters should be designed and we subsenquently review evidence about the effect of social norms.
2.4.1 Design and content of the invitation letters
Behavioral interventions which involve modifying the invitation letter itself seem more effective than providing more information in a leaflet, in addition to the letter (Wardle et al. (2016)’s Trials 1 and 2 and Bourmaud et al. (2016)). The main piece of evidence to support this line are Trials 3 and 4
of Wardle et al. (2016). In these trials, they implemented small changes of the invitation letter2and
it increased bowel cancer screening by 0.7%.
A key issue with actions on letters is that we are not sure that the individuals who receive them actually do read them. Bourmaud et al. (2016)’s study includes a post-treatment phone survey which gives an indication of the actual leaflet reading rates, which is found to be about 30%. This suggests that treatments which signal that the envelope contains important information may be effective. Our first treatment adds the logo of the three main National Health Insurance funds on the envelope containing the invitation letter to signal the importance of its contents.
Another point is the way the written material of the letter was tested before being sent (except Wardle et al. (2016)). Most studies are rather silent regarding how the letters and leaflets are designed. However, some letters may be judged more favorably than others by the individuals who received them. In addition, this opinion on the quality of the letters may differ from the opinion of the people who design these letters. This suggests introducing a treatment based on a letter that has been recognized as good by the recipients. Our second treatment includes a letter that went through a selection process by women eligible for the breast cancer screening program.
2.4.2 Social norm
Social psychology and community-based approaches3 suggest that providing information on what
peers do would influence one’s behavior. The effect is summarized by the following sentence "If everyone is doing it, it must be a sensible thing to do" in Keizer, Lindenberg and Steg (2008). Social norms interventions have been tested in various domains, such as restaurant menu choices (Cai, Chen and Fang (2009)), taste in songs (Salganik, Dodds and Watts (2006)), pro-environmental behaviors (Griskevicius, Cialdini and Goldstein (2008), Ayres, Raseman and Shih (2013)), contribution to retirement plans (Beshears et al. (2015)) and voting participation (Gerber and Rogers (2009)). Social norms interventions are found to be more effective when individuals can identify themselves with the reference group, i.e. when they consider members of the group as peers. For example, the normative messages used in hotel bathrooms increased towel reuse of visitors by 4% when the reference group
2In Trial 3 (n=264,325), they included the signature of the general practioner’s practice to which each letter’s
receiver was affiliated. In Trial 4 (n=167,741), the reminder letter included (a) a short paragraph saying that the risk increases with age, and a free phone number to get advice, and (b) a banner at the top of the letter saying "A reminder to you".
3
For instance, managing structures developed a network of informed women who already screened to spread information about breast cancer screening in their community.
changed from "most guests at the hotel reuse their towel" to "most previous occupants of the room
reused their towel" (Cialdini (2003)). In the same vein and closer to our purpose, Bronchetti,
Huffman and Magenheim (2015) used a field controlled experiment to test interventions through an email aiming to increase flu vaccines among American students. The peer effect intervention is based on a peer endorsing the flu vaccine. The peer was a reference individual on campus (tutor or athlete) who sent the email directly to the participants.
Recent field experiments have highlighted that social norm interventions may cause the oppo-site effect than the expected one, a so-called "boomerang" effect (Schultz et al. (2007)). In their experiment to test peer information on retirement plan choices, Beshears et al. (2015) argue that boomerang effects arise because of a negative belief update: individuals learn that the promoted activity is less widespread than they previously thought.
2.5 Other possible behavioral interventions
Other interventions exist, but the literature did not reach consensus on their efficacy or they were not feasible in our context. We review several of them below and explain our reasons for not adopting the approach.
Some studies have exploited the appointment system to change the default option. The usual default option is to let patients call and set the time of their appointment. The individual status-quo bias implies that they will stick to the the proposed default option. Following this idea, if individuals receive a letter with the date and time of an already-scheduled appointment, they will be more likely to attend it than if they have to call. But evidence on changing the default option in invitation letters is mixed: Narula et al. (2014) find a decrease in bowel cancer attendance, and Segnan et al. (1997) find an increase in cervical and breast cancer screenings.
There are more studies which test various features, especially the opportunity to have tailored letters. Tailored letters consists of gathering information on the receiver (such as perceived barriers to attend screening) and to adjust the letter content accordingly. Most of these studies rely on rather small samples (n<1000). They may, however, be informative since they provide converging evidence of ineffectiveness. Among recent evidence, Vernon et al. (2008) randomized two intervention groups with various levels of tailored interventions, compared with a targeted-only intervention among American veterans and found no difference between the intervention and control groups.
Bodurtha et al. (2009) tested whether risk-tailored information or general information would increase mammography uptake. They found less than a 2% not statistically significant difference between the two treatment arms. Lipkus et al. (2005) and Myers et al. (2008) used tailored interventions to increase bowel cancer screening and find mixed results. As a result, there is no strong evidence in support of tailored letters.
Some other studies included a signature of the GP on the invitation letter (Wardle et al. (2016), Segnan et al. (1997), Senore et al. (2015)) or that of various Health authorities or celebrity (Stein et al. (2005)). While only the signature of the GP seemed to increase screening uptake rate, implementing this method requires the GP and managing structures in charge of the screening program to share information. This is not currently possible in France.
While information and incentive-based interventions do not increase cancer screening, behavioral interventions seem promising and under-explored. We thus focus on behavioral interventions based on changing the invitation letter for cost and feasibility reasons.
3
Experimental design
After providing some background information about cancer screening in France, the present section presents our four treatments.
3.1 Contextual features
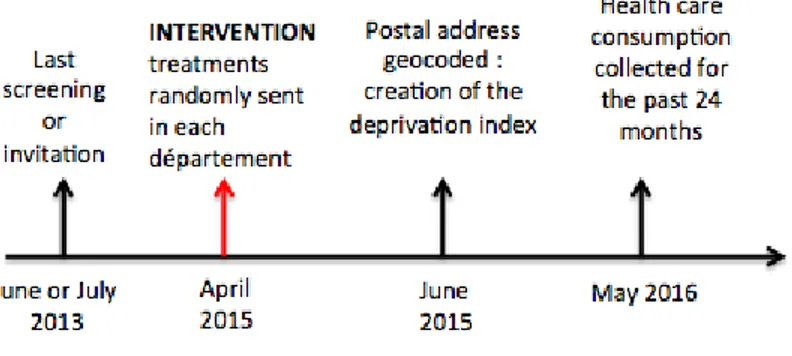
The experiment was simultaneously conducted in two départements, Seine-Maritime and Eure, in the Haute-Normandie region of France in 2015. There are 1.85 millions inhabitants and 275,652 women aged 50 to 74 years old (therefore eligible for the national screening program) in these two départements. The choice of these two départements was both for statistical reasons (one is more urban and educated, the other more rural) but also due to practical issues. The structures in charge of managing the program (managing structure thereafter) in each département were willing to undertake a randomized experiment. Without full support from the local teams, our experiment would have been impossible to run. As indicated on the timeline in Figure 4, the intervention took place in April 2015, and the data was collected the subsequent year. We also collected data from the last time the women were invited or screened. This data was from two years before our intervention (i.e. 2013) because the national program has a two-year invitation cycle.
Treatments were conveyed by the invitation letter sent to eligible women. Letters contain a voucher
Figure 4: Timeling of the experiment and data collection
that gives access to a free mammogram. The managing structure sends the letters and collects the information each time a women uses her voucher. However, whether or not a woman receives a letter of invitation, she is still free to screen outside the program. We refer to that situation as opportunistic screening. The service she receives by doing so is exactly the same (mammograms can only be performed at practices that welcome vouchers). There are two differences however. In the case of an opportunistic screening, a women incur some expenses (a minimum of 66 euros) and
require a prescription4. Second, every mammogram undertaken within the national program and
found normal is sent for a second reading to the managing structure (while opportunistic ones are not). To collect data about opportunistic screenings, we collected data from the Health Insurance
funds, since the managing structure does not receive corresponding information.5
The invitation letter has to follow guidelines which are defined by the National Institute of Cancer (i.e. it has to include information about mammography and the organized program, as well as a list of radiologists participating in the program in their département). The guidelines leave sufficient freedom to modify the letters in a substantial manner. We designed four treatments jointly with the head of each managing structure and a representative for each National Health Insurance fund of Haute-Normandie. Each treated invitation was randomly sent to a woman who was supposed to be invited anyway in April or May 2015. Women in the control group received the usual invitation
4
In France, 70% of the regulated fees are reimbursed by the Health Insurance fund and the last 30% is covered by complementary health insurance if they have one. This applies both to the opportunistic screening and the consultation to obtain the prescription.
5
The National Health Insurance funds can identify each health care consumption thanks to the medical acts classification code (Code de Classification des Actes Médicaux). This coding system allows us to know if women screened for breast cancer in the 12 months after the invitation was sent or if she screened during the 12 months before the invitations were sent. This classification code distinguishes between organized screening (coded QEQK004), opportunistic screening (coded QEQK001), and follow-up mammograms (coded QEQK005).
from each managing structure, which has never changed since the program was extended nationwide in 2004 in both départements. Even if they have the same default option (i.e. the usual letter), the usual invitation letters from the two départements differ enough so that the treatments’ effects need to be assessed separately in each département.
3.2 Treatments
We randomized invitations across 5 groups: a control group and 4 treatment groups. Treatments were conveyed by the invitation letter sent to eligible women and were thus embedded in the screening
system. This makes our intervention almost costless and easily replicable. Details about each
treatment are given below. Choices regarding the number and the nature of the treatments arose in relation to existing results. As is explained in our review section, important insights can be gained from existing results.
3.2.1 Logo treatment
By default, the envelope already has the logo of the managing structure in charge of breast cancer
prevention printed on it. However, this logo is hardly recognized and not very well known 6. In
our "logo" treatment, the official logos of the three National Health Insurance funds were added7.
National Health Insurance funds are trustworthy, well-known health institutions. Adding these
official logos to the envelope provided a clear signal that the letters came from an official institution. An image of the treated envelope as it was mailed out is available in Figure 14 in Appendix B.
Based on the saliency effect triggered by the logos, we expect the logo treatment to increase the probability of the envelope being opened. We also expect the official logos to increase the trust placed in the information contained in the letters through a messenger effect.
3.2.2 Clarity treatment
As already explained, most studies are rather silent regarding how the written content sent to receipients was selected. We use here a sample of 104 eligible women to evaluate the invitation letters. The evaluation was included in a longer questionnaire directly presented to respondents.
6
The reason for this is that there are almost 90 managing structures in France - with 90 different logos - and their only purpose is to manage the breast and bowel cancer programs for people aged 50 to 74 years old.
7
Namely, the CNAMTS (National Health Insurance Fund for Employees), the RSI (National Insurance Fund for Self-Employed Workers), the MSA (Agricultural Social Mutual Fund. These three insurance agences comprise the National Health Insurance funds (Assurance Maladie).
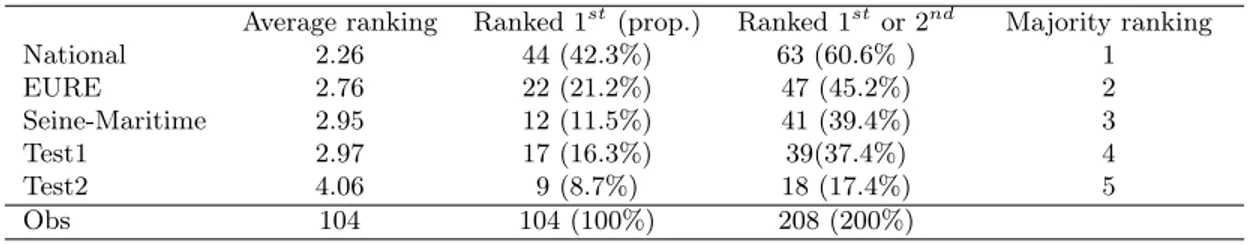
Each respondent received a set of 5 invitation letters: the two default or control invitation letters used in each département (labeled as "Eure" and "Seine-Maritime" in the paper), the initial letter suggested to management structures by the National Institute of Cancer (labeled as "National" in the paper), and two additional letters that we wrote in collaboration with the management structures (labeled as "Test1" and "Test2" in the paper). The full invitation letter set is available in Appendix A. The five letters were displayed in a neutral format such that only the textual content differed. Respondents had to physically rank the 5 letters with their prefered choice on top. They were asked to "Rank the letters by putting first the one you prefer (clearer, providing more incentive for instance) and last the one you liked the least.". We excluded from the sample any respondent who did not complete either the questionnaire or the task (24 women out of 128 (18.7%)).
There are various ways of evaluating which letter is best. We are faced here with a social choice problem, and it is wellknown that a social ordering can be obtained in several (potentially conflicting) ways. However, the individual rankings were easy to aggregate. In particular, the "National" letter was found to be obviously better. It is, for instance, preferred over its closest competitor (i.e. "Eure") by 61.5% of the respondents. The robustness of the ranking according to various criteria can be assessed from Table I.
Table I: Selection process analysis
Average ranking Ranked 1st(prop.) Ranked 1stor 2nd Majority ranking
National 2.26 44 (42.3%) 63 (60.6% ) 1 EURE 2.76 22 (21.2%) 47 (45.2%) 2 Seine-Maritime 2.95 12 (11.5%) 41 (39.4%) 3 Test1 2.97 17 (16.3%) 39(37.4%) 4 Test2 4.06 9 (8.7%) 18 (17.4%) 5 Obs 104 104 (100%) 208 (200%)
Majority rankings are obtained by comparing each pair of options. An option that is prefered by a majority to each other option is ranked first, and so on. Note that majority rankings may not exist since the aggregation of individual preferences can lead to cycles.
Our purpose was to select the best letter as our best chance to increase uptake rates. We assumed that the prefered letter was also the most appropriate to convey the information.
Interestingly enough, Test1 and Test2 were elaborated by ourselves in collaboration with the people usually in charge of writing these letters. However, letters Test1 and Test2 were not selected by the eligible women, as they were no found to be more clear. It illustrates the need for testing the letter with actual recipients.
3.2.3 Mixed treatment
The mixed treatment is simply a combination of the logo treatment and the clarity treatment. Our aim was to maximize the odds that the letters would be opened and that the envelope would be easily understood.
3.2.4 Social norm
As explained above, social norms interventions consist of providing information about what others are doing. In particular, rather than anonymous others, social norms work best when the references are peers (i.e. similar individuals). We thus chose our reference group as women living in the same département. The peer information provided in this treatment is the number of women in one’s département who screened in the program the previous year. Using a number instead of the uptake rate (around 55%) prevents revealing the fact that screening avoidance is more pervasive than previously believed, which could reduce screening attendance because a lower uptake rate than the one the receiver expects may negatively affect beliefs. We thus chose to provide the absolute number of participants in the previous year, which is a sizable number. The exact wording reads: "In 2014, 17,682 women screened in the national program in Eure. Why not you?". This sentence
was introduced in the invitation letter between the 1st and the 2nd paragraphs. It constitutes a
paragraph on its own, as shown on Figure 13 in Appendix B.
4
Data and empirical strategy
A total of 27,137 invitation letters were sent out. A small fraction of them, 2.37%, were returned to the managing structures marked as "not living at this address". Hence, our final sample is N=26,495,
with NEure=10,411 (40%) and NSeineM aritime=16,084 (60%). The main outcome is Total screening.
To obtain this variable, we merged data from the managing structure with the data from the National Health Insurrance funds. It is almost impossible for someone to have gotten a mammogram without appearing in our dataset. Total screening equals 1 if a participant had a mammogram either as part of the program or not, within one year after being invited. Other available individual characteristics in our dataset are described in Appendix D.1. The random assignment of treated letters means that, in expectation, women in the control and various treatment groups have comparable background characteristics. Thus they would have, on average, comparable outcomes in the absence of any change
in the letters. By comparing the outcomes between each treated group and the control group, we can estimate the effect of each treated letter we are testing. The multiple testing problem has received increasing attention as many authors re-conducted their analysis of randomized controlled studies and provided new results when adjusting for the multiplicity of hypothesis (for instance the RCTs on education and health programs in Lee and Shaikh (2014), Carneiro, Heckman and Vytlacil (2011)) as well as a charity field experiment (List, Shaikh and Xu (2016))).The family of hypotheses in this study corresponds to the null hypothesis that each of the four treatments has a similar effect on mammography use (total, organized or opportunistic screenings) as the control group for the full sample, as well as in each sub-population of interest. If the multiplicity of tests is not addressed, then the probability of a true null hypothesis being rejected alone increases with the number of tests. To avoid erroneously rejecting the null hypothesis, we use the Holm-Bonferroni procedure that controls the family-wise error rate. This method does not assume any dependent structure between the tests, and therefore provides fairly conservative results for tests that may be dependent. In our case, we can assume that while the treatments are independent, the three outcomes are not.
5
Results
To assess the validity of our results, we first check that the experimental design was actually imple-mented as planned. Table VII in Appendix C presents summary statistics on experiment implemen-tation in the two départements seperatly. Differences across the treatment and control groups are tested while correcting for the family-wise error rate using the Holm-Bonferroni method. Differences in bold indicate statistically significant unadjusted differences, and a star (*) indicates that the adjusted p-value is smaller than 0.1. Differences across the treatment and control groups are small in magnitude, and only 3 of 57 adjusted p-values estimated are smaller than 0.10, suggesting that the randomization was effective at creating a balance between the groups.
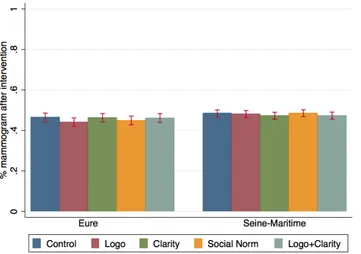
Table II presents in columns 3 and 6 the percentage of women receiving a mammogram, columns 4 and 7 present respectively the differences between the proportion of women who undertake a mammogram in the treatment and control groups with the standard errors in parenthesis. If the difference is written in bold, the unadjusted p-values are statistically significant, and if a star was added, the adjusted p-values with the Holm-Bonferoni method are smaller than 0.1. No treatment has an impact on the probability to screen as, can also be seen on Figure 5.
Figure 5: Treatment effects on mammography use
Table II: Treatment effects on mammography use
Seine-Maritime Eure
N % mammogram Diff T-C N % mammogram Diff T-C
Control 3,186 48.4 2,091 46.4 Logo 3,227 48.1 -0.3 2,069 44.0 -2.4 (0.012) (0.015) Clarity 3,214 47.3 -1.1 2,101 46.2 -0.2 (0.012) (0.015) Norm 3,234 48.5 0.1 2,073 44.9 -1.5 (0.012) (0.015) L+C 3,223 47.3 -1.1 2,077 46.1 -0.3 (0.012) (0.015) Total 16,084 47.9 10,411 45.5
5.1 Analysis and interpretation
The presented RCT delivers clear and unambiguous results: none of our four treatments caused any significant change in screening behavior. As can be seen from Table II, none of the differences between the control group and treatments reaches significance. However, the case of the "Eure" département looks like there is a negative effect generated by the treatments. As will be explained in more detail below, it appears that a particular subgroup, included in the control group in Eure, had an abnormally high screening rate of 60%, pushing up the overall screening rate in the control group. So, the most likely explanation is not that treatments tend to have a negative effect (although not significant), but that screening rates were abnormally high because of a particular subgroup. Excluding this particular subgroup from the analysis shows that screening rates are moving in no
predictable direction (see Table IX in Appendix E). Furthermore, if we were observing an effect, which was too small to reach significance, i.e. a tendency, the observed effects should have a similar magnitude and direction in both départements. This is not what we observe.
How should one interpret these results? The kind of interventions we used, namely behavioral interventions, are not supposed to be effective unless individuals exhibit some biases, i.e. some systematic deviations away from a normative model of decision-making. Since no treatment is found to be effective, we cannot reject our assumption that women exhibit no cognitive biases relative to their screening decision. Everything appears as if women decide according to their own best interest. To further explore this result, the available data allows us to design more stringent tests for our assumption that we present below.
5.2 Stability of decision across time
If, as assumed, the behavior corresponds to an unbiased decision, we expect to find some regularity in screening behavior. Those who screen keep on doing so, and those who don’t also continue not to screen. Since women are invited to screen every two years, we can compare their decision in 2015 with the one they made in 2013. Table III shows that about 80% of the women who screened the last time they were invited to do so, did it again two years later. Similar figures are found for those who
did not screen8. Having in mind that preference reversal is a common bias in decision making, the
stability of choices across time is viewed as sign that the decisions do not exhibit much variability.
Table III: Probability of screening in 2015 conditional on screening in 2013
Seine-Maritime Eure
Screened in 2015 (%)
Screened in 2013 79.25 83.39
Not screened in 2013 22.93 13.81
Note: 79.25% of women who screened in 2013 screened again in 2015 after being invited.
5.3 Treatment effects on the newly eligible
The newly eligible are women aged 50 years old who are invited to undertake a mammogram for the first time. Because they have never received the invitation before, we assume that there is a
8
Women who didn’t screen in 2013 is a group of interest in terms of public health. But, no treatment has any effect on their mammography use (table is available upon request).
Figure 6: Treatment effects on mammography use among the newly eligible
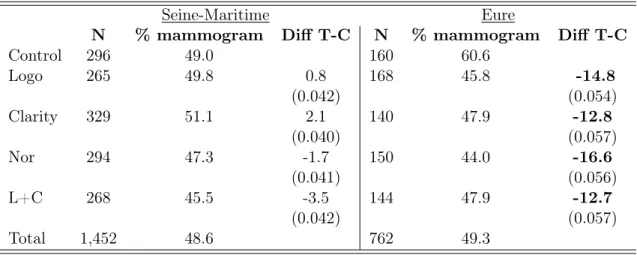
higher chance that they will read the letter inside. Indeed, women who have already been invited several times, may just pick up the voucher and screen (or not) as usual. Figure 6 shows that the different treatments led to similar screening rates. As mentioned earlier, the most notable fact is the abnormal rate found in the control group for "Eure". As can be seen from Table IV, the uptake rate reaches 60% for the group of the newly eligible women who were randomly assigned to the control. It is in sharp contrast with the same group in "Seine Maritime". Although this group is of a small size (N=160), it is enough to create most of the differences that were observed in "Eure", even in the whole sample. To clarify this point, the results for the whole sample in which the 160 women were withdrawn are presented in the left-hand side of Table IX in Appendix E. Compared to this high figure for the control group, treatments had a significant effect on the newly eligible (as indicated by bolded numbers). When controlling for multiple hypothesis testing, however, these figures are close to significance but do not reach the usual benchmarks. However, if this group had an average screening rate, say 45.5% (the average screening rate in the whole sample in Eure), all differences would had been very close to zero. Indeed, the corresponding figures, reported in the right-hand column of Table IX, show that the differences become uninformative. We double checked whether anything noticeable happened with that group and came up to the conclusion that it is not the case. In sum, all noticeable effects in the whole sample, as well as for the newly eligibles, are driven by a specific subgroup of 160 women.
were more likely to emerge if we concentrated on a group that has a greater chance of reading the invitation letters. For instance, if learning occurs through trial and error, these women may change the set of information they consider as relevant and thus exhibit a different behavior. However, they behaved exactly as those women who had already received several letters. This reinforces the previous results showing that we did not detect any bias or flaw in their decision-making process.
Table IV: Treatments effects on total screening among the newly eligible (50 yo)
Seine-Maritime Eure
N % mammogram Diff T-C N % mammogram Diff T-C
Control 296 49.0 160 60.6 Logo 265 49.8 0.8 168 45.8 -14.8 (0.042) (0.054) Clarity 329 51.1 2.1 140 47.9 -12.8 (0.040) (0.057) Nor 294 47.3 -1.7 150 44.0 -16.6 (0.041) (0.056) L+C 268 45.5 -3.5 144 47.9 -12.7 (0.042) (0.057) Total 1,452 48.6 762 49.3
6
Evaluation according to alternative policy objectives
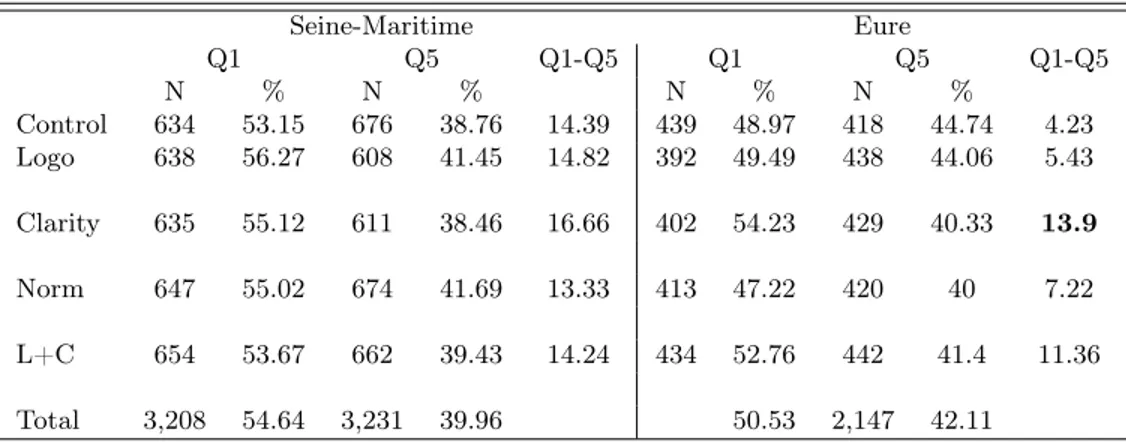
We have shown that none of our treatments provided a positive effect for a policy maker who wishes to increase mammography use. However, despite the lack of an average effect, it is possible that uptake rates have moved in some particular subgroups. From a policy perspective, two subgroup analysis are of particular importance. First, it is well known that there is a social gradient in mammography use. Policy makers may thus value an overall reduction of the differences in uptake rates across social groups, even if the average mammogram adoption rate remains constant. To evaluate whether our treatments have any impact along the social inequality dimension, we approximate the socioeconomic status by a deprivation index at a local scale (2000-inhabitant area). The higher the value of the index, the more deprived the area is and the more likely the individual that lives in it has a low social status. In Table V, we show the percentage of women getting mammograms when living in an area at the bottom (1st quintile - Q1) and at the top of the deprivation index distribution (5th quintile - Q5). The gap in mammography use between the two extreme quintiles (Q1-Q5) is stable across treatment and control groups in the Seine-Maritime. In the Eure, the clarity and mixed
treatments seemed to have increased the gap in mammogram use between Q1 and Q5. To test if this gap differs between each treatment and the control group, we run a regression model with an interaction between the two quintiles and the treatments. No difference is statistically significant when we adjust for the multiplicity of hypotheses tested (table upon request). Again, we note that at best the behavioral interventions had no effect. However, they potentially had a rather negative effect on the social gradient.
Table V: Treatment effects on the deprivation gradient
Seine-Maritime Eure Q1 Q5 Q1-Q5 Q1 Q5 Q1-Q5 N % N % N % N % Control 634 53.15 676 38.76 14.39 439 48.97 418 44.74 4.23 Logo 638 56.27 608 41.45 14.82 392 49.49 438 44.06 5.43 Clarity 635 55.12 611 38.46 16.66 402 54.23 429 40.33 13.9 Norm 647 55.02 674 41.69 13.33 413 47.22 420 40 7.22 L+C 654 53.67 662 39.43 14.24 434 52.76 442 41.4 11.36 Total 3,208 54.64 3,231 39.96 50.53 2,147 42.11
Q1 is the least deprived quintile and Q5 is the most deprived quintile.
Another policy objective could be to increase uptake rates within the national program and, thus, to reduce the share of opportunistic screening (i.e. mammograms received without using the voucher). This policy objective is motivated by the fact that there is a higher quality of screening within the program (a second reading of every normal mammogram by an independent radiologist is provided, and it leads to more regular mammogram use than opportunistic screening shown in ?), and a higher uptake rate guarantees the efficacy of the national program.
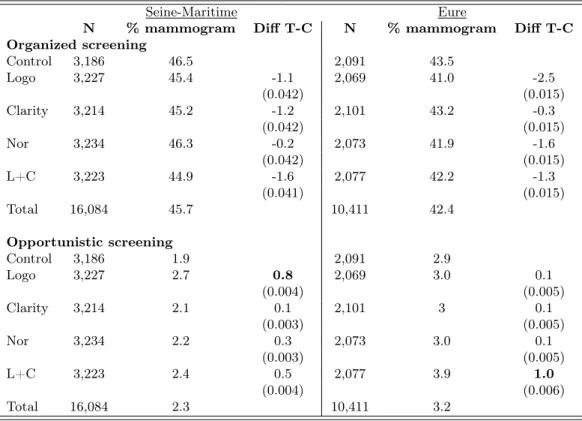
Again, even if the average uptake rates remain constant, our treatments may have an impact on the preferred way to get a mammogram. To evaluate this possibility, it is important to keep in mind that opportunistic screening is of limited size (between 2 and 3% in both départements). Detailed results can be found in Table VI. None of our treatments had any significant impact. There maybe even a small tendency for treatments to decrease the uptake rate in the national program by about 1%. In sum, even secondary policy objectives are not met by our four behavioral interventions.
Table VI: Treatment effects on organized and opportunistic screenings
Seine-Maritime Eure
N % mammogram Diff T-C N % mammogram Diff T-C
Organized screening Control 3,186 46.5 2,091 43.5 Logo 3,227 45.4 -1.1 2,069 41.0 -2.5 (0.042) (0.015) Clarity 3,214 45.2 -1.2 2,101 43.2 -0.3 (0.042) (0.015) Nor 3,234 46.3 -0.2 2,073 41.9 -1.6 (0.042) (0.015) L+C 3,223 44.9 -1.6 2,077 42.2 -1.3 (0.041) (0.015) Total 16,084 45.7 10,411 42.4 Opportunistic screening Control 3,186 1.9 2,091 2.9 Logo 3,227 2.7 0.8 2,069 3.0 0.1 (0.004) (0.005) Clarity 3,214 2.1 0.1 2,101 3 0.1 (0.003) (0.005) Nor 3,234 2.2 0.3 2,073 3.0 0.1 (0.003) (0.005) L+C 3,223 2.4 0.5 2,077 3.9 1.0 (0.004) (0.006) Total 16,084 2.3 10,411 3.2
7
Robustness and limitations
We first list the possible impediments that may affect our results and then explore the generality of our results, i.e. to what extent are our results informative in a different context?
7.1 Limitations and internal validity
We here adopt an intention-to-treat (ITT) perspective. An ITT analysis is based on the initial allocation of treatment and not on the treatment that is eventually received: we randomly sent the letters, but we cannot know if these letters were actually received, opened, read and taken into account. At the extreme, suppose that most women have already made up their mind before receiving the letters. In such an extreme situation, it is obvious that no behavioral intervention could have any effect. Simiarly, if the postman did not deliver half of the letters, no treatment will have any effect. In the same vein, we have little control on contagion effects that may blur the distinctions among treatments. Let us consider the (extreme) example of twin women who both receive a letter at the same time. By comparing their letters they may offset, or muddle, treatment effects. These two limits (intention to treat and contagion) will reinforce our main conclusion that
there is little hope, under the current system, that behavioral interventions may have an effect. In addition, there is no reason to believe that the ITT perpective and contagion are correlated with our treatments, hence they do not affect the treatment differently.
Statistical power is another possible limitations of the present study. Despite a large sample, we only detected effects that exceed a magnitude of about 3% (i.e. which generates a change of 3% in mammogram use). The existence of smaller, undetected effects seems unlikely, since no clear trend appears in the presented results. However, a study using a larger population (and/or fewer treatments), would be welcome. Comparable studies, e.g. Wardle et al. (2016), used a larger sample (n>150,000) and were able to detect effects of a smaller magnitude (0.7 % specifically). Being able to detect a treatment effect of a magnitude of about 1%, that is significant at the 1% level, requires that each group has a minimal size of N = 58000. Given that only women from 50 to 74 years old are eligible, a back-of-the-envelope calculation indicates that such an experiment should be conducted in a region with a general population of about 3 million. Given that running the experiment in two regions is important, we basically can conclude that the correct scale to conduct such an analysis is over an entire country.
Lastly, there is also an intrinsic limit regarding reminders. If after a year women did not screen, they will receive a reminder. These reminders have a large effect since more than 10 % screen using the voucher contained in the reminder letter (which, by the way, explains why uptakes rates differ between Figure 1 and Table II), although they should have a similar effect across treatment groups. In the present study, we only measure the treatment effects during the first twelve months. A more complete study should also add interventions on the reminders before drawing conclusions about the effect of behavioral interventions. We indeed cannot exclude that behavioral interventions have a larger effect if carried by these letters, although we believe it to be unlikely.
7.2 Scaling-up and external validity
The two départements in which the experiment were conducted are very representative of France
as a whole. National figures9 are as shown in Table VII. While the two départements are border
areas and belong to the same administrative region, they differ in a number of ways. We thus find it reassuring that the same results are found in both départements, since policy recommendations
9
We use a sample of women aged 50 to 74 that is representative of the French population. Data is from wave 2010 and 2012 of the Enquete sur la Santé et la Protection Sociale (ESPS) survey.
will only be attached to treatment effects that are robust enough to contextual features. To further explore the external validity, it is possible to regress the available covariates on the decision to screen. Existing literature provides ample evidence that having a low income, being sick, having a limited health insurance coverage and a low health care consumption are all associated with a lower propensity to screen (Carrieri and Wübker (2013), ?, Sicsic and Franc (2014) Devaux (2015), Wübker (2014), Jusot, Or and Sirven (2012), Hsia et al. (2000), Trivedi, Rakowski and Ayanian (2008)). We indeed find these expected trends in our sample (in Table VIII in the Appendix D.3). Women in our sample display behaviors very much in line with the existing evidence, such that our results may be valid among women living in similar conditions.
A potential limit to scaling-up the experiment would be the existence of a national program for the last decade. We can somewhat claim that the current programs have reached a limit, since uptake rates no longer move. Perhaps, in a situation in which uptake rates are still low, e.g. before or at the introduction of a national program, some behavioral intervention might accelerate the increase of uptake rates.
8
Discussion
Behavioral economics provides useful empirical insights by pointing out the most common flaws that may affect individual decision making. Bringing these insights to the field is a major challenge to help designing better policies. We here propose to apply this approach to screening behavior. The present study thus addresses a simple policy question. Can we use behavioral interventions, to increase mammography use? The answer we have provided seems negative at first glance: none of our treatments had any significant impact. Having in mind that we designed our program so as to maximize treatment effects, we cannot reject the possibility that women’s current screening decisions are optimal.
Does this (negative) result mean that there is no room for behavioral interventions? Not nec-essarily. We rather suggest that our study complements existing results to show that the three approaches to improve mammography use (incentives, information and behavioral interventions) have reached a limit, within the current system. So, we believe that the main policy implication of the present study is that it is perhaps time to rethink the design of the programs. As highlighted by Duflo (2017), moving from general principles to a policy that works requires paying attention to
details. We have paid much attention here to the details pertaining in the content of the letters, but there are other details that are included in current programs that may be worth thinking about before rejecting behavioral interventions.
References
Altobelli, E, and A Lattanzi. 2014. “Breast cancer in European Union: An update of screening programmes as of March 2014 (Review).” International journal of oncology, 45(5): 1785–1792. 2 Ayres, Ian, Sophie Raseman, and Alice Shih. 2013. “Evidence from two large field experiments
that peer comparison feedback can reduce residential energy usage.” Journal of Law, Economics, and Organization, 29(5): 992–1022. 9
Beshears, John, James J Choi, David Laibson, Brigitte C Madrian, and Katherine L Milkman. 2015. “The effect of providing peer information on retirement savings decisions.” The Journal of finance, 70(3): 1161–1201. 9, 10
Bodurtha, Joann, John M Quillin, Kelly A Tracy, Joseph Borzelleca, Donna McClish, Diane Baer Wilson, Resa M Jones, Julie Quillin, and Deborah Bowen. 2009. “Mam-mography screening after risk-tailored messages: The Women Improving Screening through Edu-cation and Risk Assessment (WISER) randomized, controlled trial.” Journal of Women’s Health, 18(1): 41–47. 11
Bourmaud, Aurelie, Patricia Soler-Michel, Mathieu Oriol, Véronique Regnier, Fabien Tinquaut, Alice Nourissat, Alain Bremond, Nora Moumjid, and Franck Chauvin. 2016. “Decision aid on breast cancer screening reduces attendance rate: results of a large-scale, randomized, controlled study by the DECIDEO group.” Oncotarget, 7(11): 12885. 6, 8, 9
Bronchetti, Erin Todd, David B Huffman, and Ellen Magenheim. 2015. “Attention, in-tentions, and follow-through in preventive health behavior: Field experimental evidence on flu vaccination.” Journal of Economic Behavior & Organization, 116: 270–291. 10
Buchmueller, Thomas, and Léontine Goldzahl. 2017. “The Effect of Organized Breast Cancer Screening on Mammography Use: Evidence from France.” Working paper. 4
Cai, Hongbin, Yuyu Chen, and Hanming Fang. 2009. “Observational learning: Evidence from a randomized natural field experiment.” 3. 9
Carneiro, Pedro, James J Heckman, and Edward J Vytlacil. 2011. “Estimating marginal returns to education.” The American economic review, 101(6): 2754–2781. 16
Carrieri, Vincenzo, and Ansgar Wübker. 2013. “Assessing inequalities in preventive care use in Europe.” Health policy, 113(3): 247–257. 2, 24
Carrieri, Vincenzo, and Ansgar Wuebker. 2016. “Quasi-Experimental Evidence on the Effects of Health Information on Preventive Behaviour in Europe.” Oxford Bulletin of Economics and Statistics, 78(6): 765–791. 4
Cialdini, Robert B. 2003. “Crafting normative messages to protect the environment.” Current directions in psychological science, 12(4): 105–109. 10
Coffman, Lucas, Clayton R Featherstone, and Judd B Kessler. 2015. “A Model of Informa-tion Nudges.” 7, 8
Devaux, Marion. 2015. “Income-related inequalities and inequities in health care services utilisa-tion in 18 selected OECD countries.” The European Journal of Health Economics, 16(1): 21–33. 2, 24
Duflo, Esther. 2017. “The Economist as Plumber (January 23, 2017).” MIT Department of Eco-nomics Working Paper, 17(3). 24
Gerber, Alan S, and Todd Rogers. 2009. “Descriptive social norms and motivation to vote: everybody’s voting and so should you.” The Journal of Politics, 71(01): 178–191. 9
Griskevicius, Vladas, Robert B Cialdini, and Noah J Goldstein. 2008. “Applying (and resisting) peer influence.” MIT Sloan management review, 49(2): 84–88. 9
Guillaume, Elodie, Carole Pornet, Olivier Dejardin, Ludivine Launay, Roberto Lillini, Marina Vercelli, Marc Marí-Dell’Olmo, Amanda Fernández Fontelo, Carme Borrell, Ana Isabel Ribeiro, et al. 2016. “Development of a cross-cultural deprivation index in five European countries.” Journal of epidemiology and community health, 70(5): 493–499. 44
Gupta, Samir, Stacie Miller, Mark Koch, Emily Berry, Paula Anderson, Sandi L Pruitt, Eric Borton, Amy E Hughes, Elizabeth Carter, Sylvia Hernandez, et al. 2016. “Financial incentives for promoting colorectal cancer screening: a randomized, comparative effectiveness trial.” The American Journal of Gastroenterology, 111(11): 1630–1636. 4
Hsia, Judith, Elizabeth Kemper, Catarina Kiefe, Jane Zapka, Shoshanna Sofaer, Mary Pettinger, Deborah Bowen, Marian Limacher, Linda Lillington, and Ellen Mason. 2000. “The importance of health insurance as a determinant of cancer screening: evidence from the Women’s Health Initiative.” Preventive medicine, 31(3): 261–270. 24
Jusot, Florence, Zeynep Or, and Nicolas Sirven. 2012. “Variations in preventive care utilisa-tion in Europe.” European Journal of Ageing, 9(1): 15–25. 2, 24
Kahneman, Daniel. 2003. “Maps of bounded rationality: Psychology for behavioral economics.” American economic review, 1449–1475. 4
Keizer, Kees, Siegwart Lindenberg, and Linda Steg. 2008. “The spreading of disorder.” Science, 322(5908): 1681–1685. 9
Kullgren, Jeffrey T, Tanisha N Dicks, Xiaoying Fu, Diane Richardson, George L Tza-nis, Martin Tobi, and Steven C Marcus. 2014. “Financial Incentives for Completion of Fecal Occult Blood Tests Among VeteransA 2-Stage, Pragmatic, Cluster, Randomized, Controlled Tri-alFinancial Incentives for Completion of Fecal Occult Blood Tests Among Veterans.” Annals of internal medicine, 161(10_Supplement): S35–S43. 5
Lee, Soohyung, and Azeem M Shaikh. 2014. “Multiple Testing And Heterogeneous Treatment Effects: Re-Evaluating The Effect Of Progresa On School Enrollment.” Journal of Applied Econo-metrics, 29(4): 612–626. 16
Lipkus, Isaac M, Celette Sugg Skinner, John Dement, Lisa Pompeii, Barry Moser, Gregory P Samsa, and David Ransohoff. 2005. “Increasing colorectal cancer screening among individuals in the carpentry trade: test of risk communication interventions.” Preventive medicine, 40(5): 489–501. 11
List, John A, Azeem M Shaikh, and Yang Xu. 2016. “Multiple hypothesis testing in experi-mental economics.” National Bureau of Economic Research. 16
Merrick, Elizabeth Levy, Dominic Hodgkin, Constance M Horgan, Laura S Lorenz, Lee Panas, Grant A Ritter, Paul Kasuba, Debra Poskanzer, and Renee Altman Nefussy.
2015. “Testing novel patient financial incentives to increase breast cancer screening.” The American journal of managed care, 21(11): 771–779. 5
Myers, Ronald E, Terry Hyslop, Randa Sifri, Heather Bittner-Fagan, Nora C Katu-rakes, James Cocroft, Melissa DiCarlo, and Thomas Wolf. 2008. “Tailored navigation in colorectal cancer screening.” Medical care, 46(9): S123–S131. 11
Narula, Trishna, Chethan Ramprasad, Enrica N Ruggs, and Michelle R Hebl. 2014. “Increasing colonoscopies? A psychological perspective on opting in versus opting out.” Health Psychology, 33(11): 1426. 10
Pace, Lydia E, and Nancy L Keating. 2014. “A systematic assessment of benefits and risks to guide breast cancer screening decisions.” Jama, 311(13): 1327–1335. 2
Pornet, Carole, Cyrille Delpierre, Olivier Dejardin, Pascale Grosclaude, Ludivine Lau-nay, Lydia Guittet, Thierry Lang, and Guy Launoy. 2012. “Construction of an adaptable European transnational ecological deprivation index: the French version.” Journal of epidemiology and community health, 66(11): 982–989. 44
Salganik, Matthew J, Peter Sheridan Dodds, and Duncan J Watts. 2006. “Experimental study of inequality and unpredictability in an artificial cultural market.” science, 311(5762): 854– 856. 9
Schultz, P Wesley, Jessica M Nolan, Robert B Cialdini, Noah J Goldstein, and Vladas Griskevicius. 2007. “The constructive, destructive, and reconstructive power of social norms.” Psychological science, 18(5): 429–434. 10
Segnan, N, C Senore, L Giordano, A Ponti, and G Ronco. 1997. “Promoting participation in a population screening program for breast and cervical cancer: a randomized trial of different invitation strategies.” Tumori, 84(3): 348–353. 10, 11
Senore, Carlo, Andrea Ederle, Giovanni DePretis, Corrado Magnani, Debora Canuti, Silvia Deandrea, Manuel Zorzi, Alessandra Barca, Piero Bestagini, Katia Faitini, et al. 2015. “Invitation strategies for colorectal cancer screening programmes: The impact of an advance notification letter.” Preventive medicine, 73: 106–111. 11
Sicsic, Jonathan, and Carine Franc. 2014. “Obstacles to the uptake of breast, cervical, and colorectal cancer screenings: what remains to be achieved by French national programmes?” BMC health services research, 14(1): 465. 2, 24
Slater, Jonathan S, George A Henly, Chung Nim Ha, Michael E Malone, John A Nyman, Sarah Diaz, and Paul G McGovern. 2005. “Effect of direct mail as a population-based strategy to increase mammography use among low-income underinsured women ages 40 to 64 years.” Cancer Epidemiology and Prevention Biomarkers, 14(10): 2346–2352. 5
Stein, K, G Lewendon, R Jenkins, and C Davis. 2005. “Improving uptake of cervical cancer screening in women with prolonged history of non-attendance for screening: a randomized trial of enhanced invitation methods.” Journal of Medical Screening, 12(4): 185–189. 11
Thaler, Richard H, and Cass R Sunstein. 2008. Nudge: Improving decisions about health, wealth, and happiness. Yale University Press. 2, 3, 6
Trivedi, Amal N, William Rakowski, and John Z Ayanian. 2008. “Effect of cost shar-ing on screenshar-ing mammography in Medicare health plans.” New England Journal of Medicine, 358(4): 375–383. 24
Vallée, Alexandre. 2016. “Le «Mammobile»: une méthode pertinente en France?” Santé Publique, 28(5): 599–602. 5
Vernon, Sally W, Deborah J del Junco, Jasmin A Tiro, Sharon P Coan, Catherine A Perz, Lori A Bastian, William Rakowski, Wen Chan, David R Lairson, Amy Mc-Queen, et al. 2008. “Promoting regular mammography screening II. Results from a randomized controlled trial in US women veterans.” Journal of the National Cancer Institute, 100(5): 347–358. 10
Wardle, Jane, Christian von Wagner, Ines Kralj-Hans, Stephen P Halloran, Samuel G Smith, Lesley M McGregor, Gemma Vart, Rosemary Howe, Julia Snowball, Gra-ham Handley, et al. 2016. “Effects of evidence-based strategies to reduce the socioeconomic gradient of uptake in the English NHS Bowel Cancer Screening Programme (ASCEND): four cluster-randomised controlled trials.” The Lancet, 387(10020): 751–759. 6, 8, 9, 11, 23
Wübker, Ansgar. 2014. “Explaining variations in breast cancer screening across European coun-tries.” The European Journal of Health Economics, 15(5): 497–514. 24
Appendix A
Letters from the selection process
Figure 8: National
During her life nearly one in eight women will be faced with this cancer that usually takes several years to develop. It is
therefore essential, from 50 years to participate regularly in organized screening in order to deal as quickly as possible
potential anomalies.
Organized screening is the only device where, for more security, mammograms found normal are systematically proofread
by a second radiologist.
Mammography is covered at 100% without upfront payment. If a additional exams are needed, such as ultrasound, for
example, it will be charged to usual conditions by the Health Insurance.
Do not wait, make an appointment with one of the radiologists of your choice listed in the list printed on the back.
During the consultation, please bring:
-
‐ This mail
-
‐ Your Vitale Card
-
‐ Your previous mammograms
For more information, see the attached flyer, contact your doctor or contact us at the telephone number of the management
structure.
Figure 9: Seine-Maritime
Madam,
A systematic screening campaign for breast cancer with mammography is organized in the department of Seine-Maritime and is open to women aged 50 to 74 years.
We invite you to make an appointment with a certified radiologist (list overleaf) to have a screening mammogram covered at 100% without upfront payment.
The day of the examination, submit: - This mail
- your insurance card and your insurance card, - previous mammograms and ultrasounds.
You can meet with your doctor or gynecologist during a consultation. They can also give you a EMMA letter for care and explain the interest of organized screening.
The radiologist after examination will give you a first result, your file will then be addressed to the Association EMMA for a second reading for safety. The final result and your mammograms will be sent directly by mail after approximately three weeks. Your general practitioner and / or gynecologist will also be informed of the result. If you do not wish to use this screening invitation, thank you for sending us this voucher ; you will avoid unnecessary reminder letters.
Figure 10: Eure
Madam,
As part of the organized screening program of breast cancer, the association DECAD'E, in partnership with the Health
Insurance Funds and the Regional Health Agency - ARS – invite you to perform a mammogram every 2 years from 50 years
old.
You have never had a mammogram or this exam was more than 2 years ago. You can now make an appointment for a breast
screening in a licensed radiologist of your choice (radiologists list of Eure on the back).
You will receive:
- A medical care covered at 100% without upfront payment,
- A second reading of the mammogram if considered normal.
Please have your Vital card and your insurance card with you. Bring back your old mammograms if you have them.
You will get your exam and medical report at your radiologist within 3 weeks.
Figure 11: Test 1
Madam,
Do you know that a free organized breast cancer screening program exists for all women aged 50 to 74 years old?
Mammography is an X-ray of the breast.
We invite you to undertake this free and reliable medical test at the certified radiologist practice that you prefer (as listed overleaf). For a higher quality, organized screening is the only device in which each mammography found normal is read a second radiologist.
Breast cancer is frequent, but detected early it is easier to treat. The day of the exam, please bring:
- This letter
- Your Vitale card and complementary health insurance card
- Your previous mammography if you have them
Figure 12: Test 2
Madam,
Do you know that a free organized breast cancer screening program exists for all women aged 50 to 74 years old?
Why?
Breast cancer is frequent, but if detected early it is easier to treat. A mammography is an X-ray of the breasts. It is free and reliable.
How?
Book an appointment to the certified radiologist practice that you prefer (as listed overleaf ). The day of the exam, you just have to present this invitation, your last X-ray and your Vitale Card and complementary health insurance card.